Manage Kafka Brokers Using Control Center for Confluent Platform
The Brokers overview page enables you to easily assess the health of brokers (nodes) in a Kafka cluster. You can quickly drill into Broker metrics or view the configuration settings for a specific broker.
Brokers and Control Center mode
The panels that are visible on the Brokers overview page, and whether they are clickable, depends on if you are running Control Center in Normal mode or Reduced infrastructure mode.
The following table summarizes the view by mode:
| Panel | Normal | Reduced infrastructure mode |
|---|---|---|
| Partitioning and replication | Visible and clickable | Visible |
| Active controller | Visible and clickable | Visible |
| Self-balancing | Visible and clickable | Visible and clickable |
| Tiered Storage | Visible and clickable | Visible and clickable |
| Production and Consumption | Visible and clickable | Not visible |
| Zookeeper | Visible and clickable | Not visible |
| Disk | Visible and clickable | Not visible |
| System | Visible and clickable | Not visible |
Access the Brokers page
To access the Brokers overview page, select a cluster and then select Brokers from the navigation menu in the left panel of the page.

View of Brokers page in Normal mode
Brokers table
On the bottom of the Brokers overview page, is table that contains a list of brokers for the cluster. The Brokers table lists all brokers by ID.

Use this table to:
- Search for a broker by its ID.
- Sort a column by clicking in the column title cell.
- View throughput (bytes in and out per second) and latency percentage metrics.
- Access and download broker configuration settings
Download broker configuration settings
From the brokers table, select a broker.
Click the Configuration tab, and then Overview.
Click Download. A JSON file that contains the broker configuration settings is downloaded into your downloads directory. The filename is based on the broker name. The file contains a
KafkaBrokerConfigListthat in Turn contains a list ofKafkaBrokerConfigobjects.Example filename:
broker_config_0.jsonExample KafkaBrokerConfig:
{
   "kind":"KafkaBrokerConfig",
   "metadata":{
      "self":"http://somehost:9021/api/kafka-rest/12345-qTpmvu9WlO3g6wA/kafka/v3/clusters/12345-qTpmvu9WlO3g6wA/brokers/0/configs/advertised.listeners",
      "resource_name":"crn:///kafka=12345-qTpmvu9WlO3g6wA/broker=0/config=advertised.listeners"
   },
   "cluster_id":"12345-qTpmvu9WlO3g6wA",
   "name":"advertised.listeners",
   "value":null,
   "is_read_only":false,
   "is_sensitive":false,
   "source":"DEFAULT_CONFIG",
   "synonyms":[

   ],
   "broker_id":0,
   "is_default":true
}
Broker metrics
All of the metrics for your broker are summarized on one page. To view metrics, click any of the following panels on the Brokers overview page:

Tip
You can set alerts on many of these metrics, such as: production request latency, under-replicated partitions, out of sync replica count, ZooKeeper status, and more. Send alerts action notifications though email, Slack, or PagerDuty. For details, see Control Center Alerts for Confluent Platform.
Filter brokers
In a multiple broker environment, you can view the metrics charts for multiple brokers. Click Select all or Deselect all, or individually select each broker for which you want to view metrics. If all brokers are deselected, each panel displays a No Brokers Selected message.

Customize the dashboard for broker metrics
Drag and drop to rearrange the order of the brokers metrics dashboard panels.
Note
The settings only persist across the same browser and computer.
Click Customize Dashboard on the Brokers Overview > Metrics page.

Drag the panels into the order you want.
Click Save.
Viewing latency by percentage
To view production or consumption request latency by a specific percentage, select a percentage from the menu over the Request latency graph.

Tip
Click a point on the graph in the Request latency panels to view details on Production or Consumption request latency.
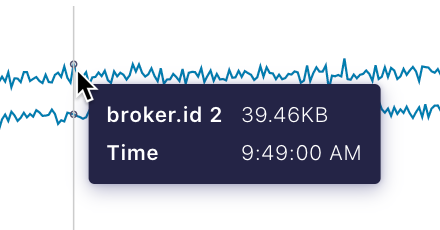
Hover to view details
Hover on any point in a metrics chart to view details for a specific point in time.
Production metrics panel
To view Production metrics, click the Production panel from the Brokers overview page.
The chart shows throughput, request latency, and any failed production requests.

Click a point on the graph in the Request latency panel to view details on Production request latency.

Production request latency
Consumption metrics panel
Important
Production and consumption metrics are visible in Normal mode only.
The charts show throughput, request latency, and any failed consumption requests.

Click a point on the graph in the Request latency panel to view details on Consumption request latency.

Consumption request latency
Partition and replication metrics
To view partition and replication metrics, click the Partitioning and replication panel.
The charts show the total number of partitions, leaders, under-replicated partitions, and under min in-sync replicas.

Broker uptime and ZooKeeper metrics
To access the broker uptime and ZooKeeper panel, click the ZooKeeper panel on the Brokers and Control Center mode.
Important
Broker uptime and zookeeper metrics are visible in Normal mode only.
The charts show uptime for available brokers and ZooKeeper.

Note
Broker uptime metrics are cluster-wide, and do not apply to individual brokers. The Filter broker controls are not applicable to the Broker uptime panel.
Disk usage panel
To view disk usage metrics, click the Disk panel from the Brokers overview page. This panel will show a red sidebar if disk usage is skewed and should be rebalanced.
Important
The Disk usage panel is visible in Normal mode only.
The Disk panel shows maximum usage, minimum usage, and distribution.

System usage panel
To access the System panel, click the System summary card from the Brokers and Control Center mode.
Important
The System panel is visible in Normal mode only.
The System panel shows network and request pool usage.
Network pool usage is the average network pool capacity usage across all brokers; that is, the percentage of time that the network processor threads are not idle.
Request pool usage is the average request handler capacity usage across all brokers; that is, the percentage of time that the request handler threads are not idle.

Active controller
The Active controller panel identifies which broker in your cluster is reporting as the Active controller. In a Kafka cluster, one of the brokers serves as the controller, which is responsible for managing the states of partitions and replicas and for performing administrative tasks like reassigning partitions. At any given time there is only one controller broker in your cluster. This identifier panel enables operators to know which broker is working as the controller.

Self-Balancing Clusters
Starting with Confluent Platform 6.1, when the Self-Balancing Clusters feature is enabled, clicking the Self-balancing card displays broker task statuses.

If Self-Balancing is disabled, the Self-balancing card takes you to Cluster Settings -> Self-balancing, which includes a tab where to edit settings and enable Self-Balancing.
The Self-Balancing panel on the Brokers page itself indicates the status of Self-Balancing.

To learn more, see the following topics:
- Work with Self-Balancing Clusters in Control Center
- Manage Self-Balancing Kafka Clusters in Confluent Platform in the Kafka Operations documentation
Tiered storage
The Tiered storage panel takes you to Cluster Settings -> Storage, which includes a tab where you can configure Tiered Storage.

Once Tiered storage is up and running, this panel shows storage data statistics.

Click into these initial stats to view a metrics chart for Tiered Storage.

To learn more, see the following topics:
- Configure Tiered Storage in Control Center
- Tiered Storage in the Kafka Operations documentation