
Monitor Confluent Cloud Clients
When developing Apache Kafka® applications on Confluent Cloud, you must track the health of your deployment to maintain optimal performance. Performance monitoring provides a quantitative account of the health of each Kafka or Confluent component.
Because production environments are dynamic–that is, data profiles can change, you can add new clients and enable new features–performance monitoring is crucial. Ongoing monitoring is as much about identifying and responding to potential failures as it is about ensuring the service goals are consistently met even as the production environment changes. Before going into production, you should have a robust monitoring system for all the producers, consumers, topics, and any other Kafka or Confluent components you’re using.
This section helps you configure a robust performance tracking system when working with Confluent Cloud.
Monitor clients on the Confluent Cloud Console
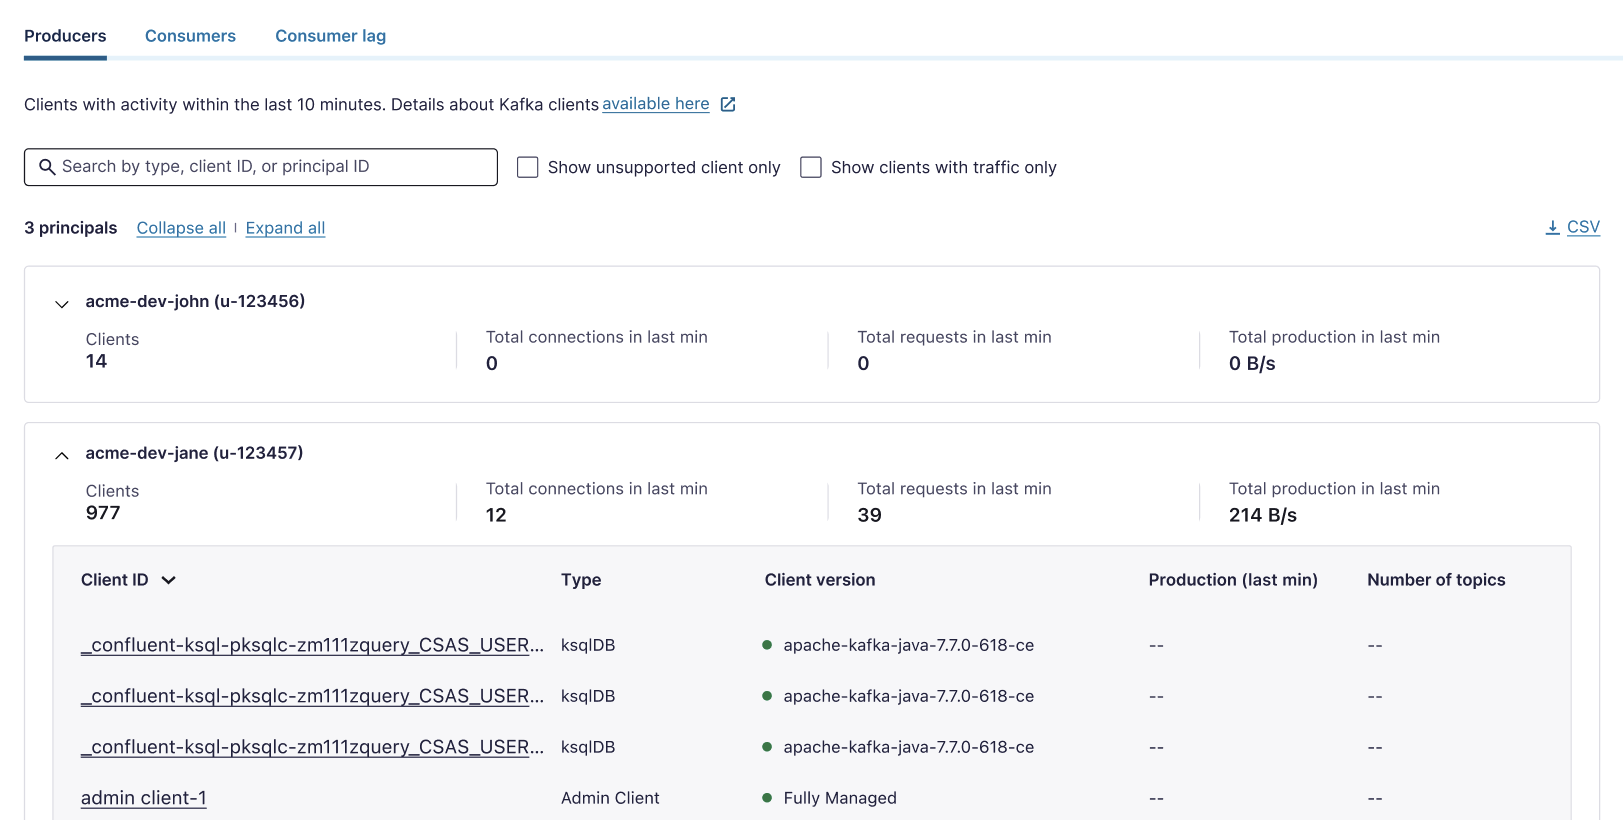
The Clients overview page in Confluent Cloud organizes the clients into the principal groups. You can view the client metrics that are aggregated within a principal. You can also filter for unsupported client versions.
To view and monitor the installed clients on the Clients overview page of the Confluent Cloud cluster:
On the Confluent Cloud Console, browse to the environment and the cluster, and click Clients.
For a specific principal, click the Producers, Consumers, Consumer lag, or Share groups tabs to see applicable clients in the category.
For each principal, you can see client metrics.
To see consumer lag information, click the Consumer lag tab.
Consumer lag refers to the delay between the production and consumption of messages in Kafka, which can significantly impact your system’s overall performance.
For details about monitoring consumer lag, see Monitor Kafka Consumer Lag in Confluent Cloud.
Expand one or all principals to see clients for the principal.
For each producer client, you can see the average request latency, which is the average latency between the client and the Kafka cluster.
This metric is only available for the clients using Java 3.8+ when the client configuration,
enable.metrics.push, has the valuetrue(the default setting).For the best practices in the latency monitoring in Confluent Cloud, refer to Optimize Confluent Cloud Clients for Latency.
Monitor unsupported client versions
On the Clients overview page of the Confluent Cloud Console, you can check if you are using an unsupported client version.
It is recommended that you update your client versions regularly to avoid undesired behavior in your clusters. Some issues that can arise from running unsupported client versions are:
Security vulnerabilities: Confluent Cloud is regularly updated with security patches and bug fixes. Using an unsupported client version means that you may be missing critical security updates, leaving your applications and data vulnerable to potential security threats or exploits.
Lack of support: Confluent provides official support and maintenance for supported client versions only. If you encounter issues or bugs while using an unsupported client version, Confluent may not be able to provide assistance or troubleshooting help, leaving you to resolve the issues on your own.
Missing features and improvements: Newer versions of client libraries often introduce new features, performance improvements, and bug fixes.
Potential service disruptions: Confluent Cloud may introduce changes or updates that are designed to work with supported client versions. Using an unsupported client version could lead to service disruptions or unexpected behavior when such changes are made.
To ensure a stable, secure, and well-supported experience with Confluent Cloud, it is highly recommended that you use the officially supported client versions for your specific programming language or framework. See the Client versions and support for the supported client versions and their compatibility with Confluent Cloud services and features.
To monitor clients versions on the Confluent Cloud Console:
Select your cluster name.
Click Clients, and navigate to the Producer or Consumer tab depending on which clients you would like to view.
Select Show clients with traffic only to filter down to only clients that have produced/consumed a message in the last 10 minutes.
Principals containing unsupported clients are indicated by a yellow warning icon.
Click the dropdown arrow to view unsupported clients associated with this principal.
Supported versions are indicated with a green status, and the unsupported versions are indicated with a yellow status.
Locate the unsupported version and update the client.
Some clients report “unknown” as the version because those clients do not emit the ApiVersion.
Metrics API
The Confluent Cloud Metrics provides programmatic access to actionable metrics for your Confluent Cloud deployment, including server-side metrics for the Confluent-managed services. To retrieve client-side metrics, see Producers and Consumers.
The Metrics API, enabled by default, aggregates metrics at the topic and cluster level. Any authorized user can gain access to the metrics that allow you to monitor overall usage and performance. To get started with the Metrics API, see the Confluent Cloud Metrics documentation.
You can use the Metrics API to query metrics at the following granularities (other resolutions are available if needed):
Bytes produced per minute grouped by topic
Bytes consumed per minute grouped by topic
Max retained bytes per hour over two hours for a given topic
Max retained bytes per hour over two hours for a given cluster
You can retrieve the metrics easily over the internet using HTTPS, capturing them at regular intervals to get a time series and an operational view of cluster performance. You can integrate the metrics into any cloud provider monitoring tools like Azure Monitor, Google Cloud’s operations suite (formerly Stackdriver), or Amazon CloudWatch, or into existing monitoring systems like Prometheus and Datadog, and then plot them in a time series graph to see usage over time. When writing your own application to use the Metrics API, see the full API specification to use advanced features.
JMX metrics
Kafka applications expose some internal Java Management Extensions (JMX) metrics, and many users run JMX exporters to feed the metrics into their monitoring systems. You can retrieve JMX metrics for your client applications and the services you manage by starting your Kafka client applications with the JMX_PORT environment variable configured. You cannot use JMX metrics for the Confluent-managed services.
There are many Kafka Metrics that are exposed through JMX to provide insight on the performance of your applications.