
View Connector Events for Confluent Cloud
You can view Confluent Cloud connector events directly through the Confluent Cloud Console or Confluent CLI. You can also consume events from a topic using the Confluent CLI, Java, or C/C++ for output to a display or other application. This feature is available for Basic, Standard, Enterprise, Dedicated, and Freight Apache Kafka® clusters in Confluent Cloud.
Important
Viewing connector events using Confluent Cloud Console and Confluent CLI is available for the following RBAC roles:
Using Confluent Cloud Console
The logs provide a centralized view for monitoring the operational health and activity of your Confluent Cloud connectors. The following are the key controls available in the Logs screen to analyze the event logs:
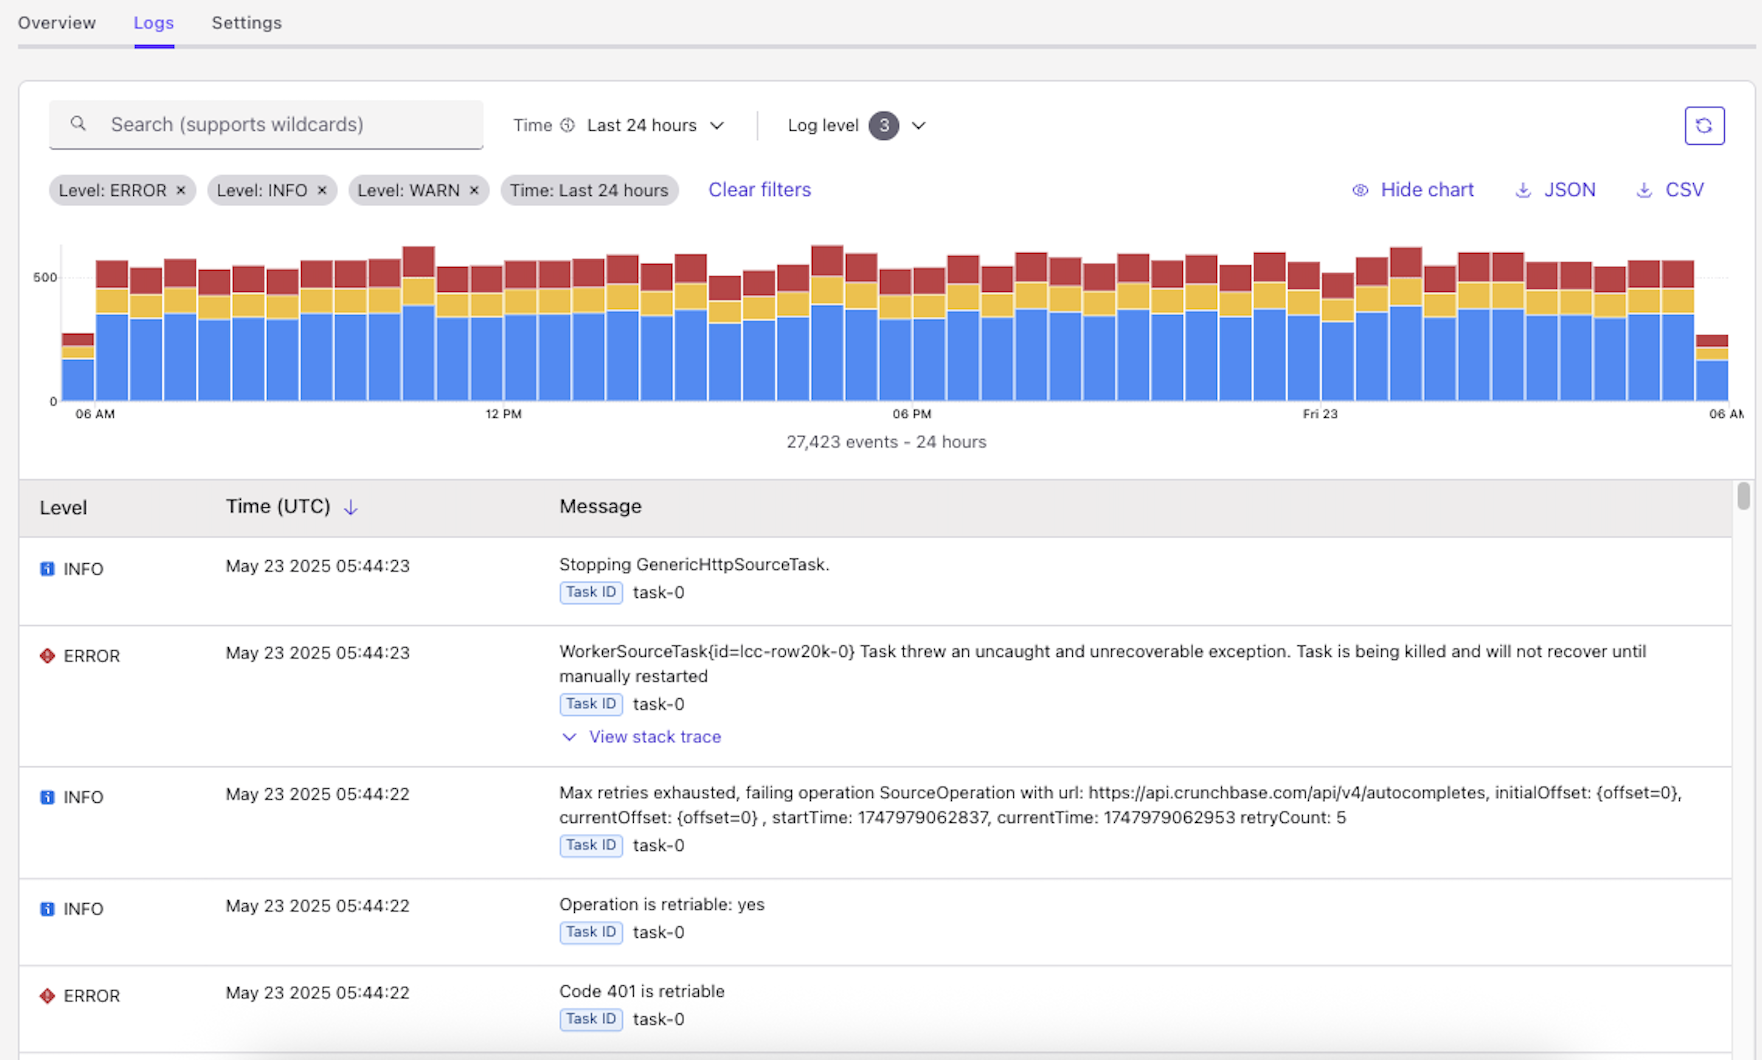
Connector Event Log
Log search: Allows you to filter logs by entering keywords or wildcards. Use wildcards for flexible searching, for example,
NullPointerException*.Important
Avoid using short-string wildcards such as single or two-letter wildcard searches (for example,
a*,at*,org*) to optimize performance.Time filter: Lets you filter logs by a specific time range. For example, Last 24 hours or Last 1 hour. The default retention period for logs on Confluent Cloud Console is three days. This release does not support custom ranges.
Log level filter: Enables filtering logs by their severity (for example, ERROR, INFO, WARN). You can use ERROR-level message to correct the issue yourself or provide it to Confluent support for additional investigation. Most INFO-level events are informational only and do not require corrective action.
Clear filter: Resets all applied search and time filters.
Bar chart: Visually represents the distribution of log levels (ERROR, INFO, WARN) over the selected time period (for example, Last 24 hours).
Hide chart: Allows you to collapse the bar chart to maximize space for event log entries.
JSON / CSV download: Allows you to export the log data in JSON or CSV format for further analysis.
Log entry table: Displays the actionable insights within logs as per log levels and the time period selected.
Level column: Indicates the severity of the log message (for example, ERROR, INFO, WARN).
Time (UTC) column: Shows the timestamp (in Coordinated Universal Time) when the log event occurred.
Message column: Contains the actual log message, providing details about the event. Use the clickable links within the message for debugging.
Use the steps below to view an event for a Confluent Cloud connector:
Select a connector in the Cloud Console to open the connector overview page.
Click on Logs.
Use the control described above and view the event log you want.
Using Confluent CLI
The Confluent CLI allows you to view connector logs with various search criteria, similar to the Confluent Cloud Console. Additionally, it allows you to store logs in an output file.
For more information, see Connect Logs CLI.
Limitations
A rate limit of 5 requests/minute applies per connector.
Log data can be queried only for the past 3 days.
Query examples
The following examples show how to view connector log events using the Confluent Cloud CLI.
The example assumes the following:
You have the Confluent CLI installed and configured for your environment.
You have the Connector ID (e.g.,
lcc-123456) for the connector whose logs you want to view.
Query logs by time range: Allows you to query connector logs with a specific log level within a defined time window.
confluent connect logs <connector-id> --level <log-level> --start-time "<start-time>" --end-time "<end-time>"
For example, to query for
ERRORlevel logs for connectorlcc-123456between February 1, 2025, 00:00:00Z and February 1, 2025, 23:59:59Z:confluent connect logs lcc-123456 --level ERROR --start-time "2025-02-01T00:00:00Z" --end-time "2025-02-01T23:59:59Z"
Example output:
Found 2 log entries for connector lcc-123456:

          Timestamp         | Level  | Task ID |            Message                | Exception
---------------------------+--------+---------+-----------------------------------+------------------------------------------------------
   2025-02-01T00:00:00.757Z | ERROR  | task-0  | WorkerSourceTask{id=lcc-123456-0} | org.apache.kafka.connect.errors.ConnectException: ...
                            |        |         | Task threw an uncaught and        |
                            |        |         | unrecoverable exception. Task is  |
                            |        |         | being killed and will not recover |
                            |        |         | until manually restarted          |
   2025-02-01T00:00:00.761Z | ERROR  | task-0  | WorkerSourceTask{id=lcc-123456-0} | org.apache.kafka.connect.errors.ConnectException: ...
                            |        |         | Task threw an uncaught and        |
                            |        |         | unrecoverable exception. Task is  |
                            |        |         | being killed and will not recover |
                            |        |         | until manually restarted          |
Filter by multiple log levels: Lets you query connector logs by specifying multiple log levels using the | (OR) operator within the defined time window.
confluent connect logs <connector-id> --level "<log-level-1>|<log-level-2>" --start-time "<start-time>" --end-time "<end-time>"
For example, to query for
ERRORorINFOlevel logs for connectorlcc-123456between February 1, 2025, 00:00:00Z and February 1, 2025, 23:59:59Z:confluent connect logs lcc-123456 --level "ERROR|INFO" --start-time "2025-02-01T00:00:00Z" --end-time "2025-02-01T23:59:59Z"
Example output:
Found 2 log entries for connector lcc-123456:

          Timestamp         | Level  | Task ID |            Message                | Exception
---------------------------+--------+---------+-----------------------------------+------------------------------------------------------
   2025-02-01T00:00:00.757Z | INFO   | task-0  | WorkerSourceTask{id=lcc-123456-0} |
                            |        |         | Committing offsets for 130        |
                            |        |         | acknowledged messages             |
   2025-02-01T00:00:00.761Z | ERROR  | task-0  | WorkerSourceTask{id=lcc-123456-0} | org.apache.kafka.connect.errors.ConnectException: ...
                            |        |         | Task threw an uncaught and        |
                            |        |         | unrecoverable exception. Task is  |
                            |        |         | being killed and will not recover |
                            |        |         | until manually restarted          |
Search for specific text and save to a file: Allows you to query connector logs with a specific log level and search for particular text within the logs. You can also save the results to an output file. You can use regular expressions for the search text.
confluent connect logs <connector-id> --level <log-level> --search-text "<search-term>" --start-time "<start-time>" --end-time "<end-time>" --output-file <output-filename>
For example, to query for
ERRORlevel logs for connectorlcc-123456containing “example error” between February 1, 2025, 00:00:00Z and February 1, 2025, 23:59:59Z, and save them toerrors.json:confluent connect logs lcc-123456 --level "ERROR" --search-text "example error" --start-time "2025-02-01T00:00:00Z" --end-time "2025-02-01T23:59:59Z" --output-file errors.json
Example output:
Appended 1 log entries to file: errors.json
$ cat errors.json

{
 "Timestamp":"2025-02-01T00:00:00.757Z",
 "Level":"ERROR","TaskId":"task-0",
 "Message":"example error 1",
 "Exception":""
}
Example with a regular expression
"exa*":confluent connect logs lcc-123456 --level "ERROR" --search-text "exa*" --start-time "2025-02-01T00:00:00Z" --end-time "2025-02-01T23:59:59Z" --output-file errors.json
Example output:
Appended 1 log entries to file: errors.json
$ cat errors.json

{
 "Timestamp":"2025-02-01T00:00:00.757Z",
 "Level":"ERROR","TaskId":"task-0",
 "Message":"example error 1",
 "Exception":""
}
Navigate through log pages: Allows you to query subsequent pages of connector logs for the same query by using the
--nextflag. Continue executing the command with this flag untilNo logs found for the current queryis displayed.confluent connect logs <connector-id> --level <log-level> --start-time "<start-time>" --end-time "<end-time>" --next
For example, to navigate to the next page of
ERRORlevel logs for connectorlcc-123456between February 1, 2025, 00:00:00Z and February 1, 2025, 23:59:59Z:confluent connect logs lcc-123456 --level ERROR --start-time "2025-02-01T00:00:00Z" --end-time "2025-02-01T23:59:59Z" --next
Found 2 log entries for connector lcc-123456:

          Timestamp         | Level  | Task ID |            Message                | Exception
---------------------------+--------+---------+-----------------------------------+------------------------------------------------------
   2025-02-01T23:59:59.850Z | ERROR  | task-0  | WorkerSourceTask{id=lcc-123456-0} | org.apache.kafka.connect.errors.ConnectException: ...
                            |        |         | Task threw an uncaught and        |
                            |        |         | unrecoverable exception. Task is  |
                            |        |         | being killed and will not recover |
                            |        |         | until manually restarted          |
   2025-02-01T23:59:59.860Z | ERROR  | task-0  | WorkerSourceTask{id=lcc-123456-0} | org.apache.kafka.connect.errors.ConnectException: ...
                            |        |         | Task threw an uncaught and        |
                            |        |         | unrecoverable exception. Task is  |
                            |        |         | being killed and will not recover |
                            |        |         | until manually restarted          |
Consume events from the event topic
Important
Consuming connector events is restricted to the OrganizationAdmin role.
Connectors that fail during provisioning are not reported to the events topic.
Confluent will make non-breaking changes to the schema without advance notice. Breaking changes will be widely communicated at least 180 days in advance, and we will continue to maintain compatibility during this time. For additional details, see the event schema compatibility policy.
Events logged in the Connect events topic follow the cloudevents schema. The types of events logged in the topic are currently limited to io.confluent.logevents.connect.TaskFailed and io.confluent.logevents.connect.ConnectorFailed.
There are no ordering guarantees for events. Each record has a timestamp, but the events themselves may appear out of order when viewed. You can sort these based on the timestamp if needed. Note that you cannot sort the events directly in the Cloud Console.
For connector failure events, Connect attempts to resolve the failure automatically. For this reason, you may see an event get repeated if the issue cannot be resolved by Connect.
Note that connector events and audit logging operate from the Audit Log cluster. Consumption charges for both connector events and audit logging are combined. For more information, see Connector events and audit log.
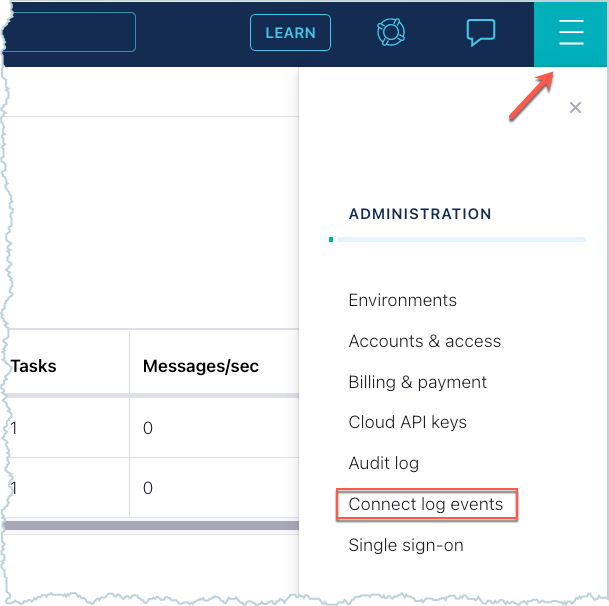
In addition to what is provided in this document, the Cloud Console provides in-product documentation that steps through how to set this up. To view the in-product documentation for event logs, go to the Administration menu and select Connect log events.
You can consume events from the Connect events Kafka topic using the Confluent Cloud CLI, Java, or C/C++. The steps assume that:
Confluent CLI version 2 is being used. For more information, see Confluent CLI v2.
That you are already connected to your Confluent Cloud environment and cluster.
Audit Log cluster API key
Both the connector events feature and audit logging operate from the Audit Log cluster. There is a limit of two API keys for the Audit Log cluster. Enter the following Confluent CLI commands to find out how many API keys are being used for the Audit Log cluster.
Get the Audit Log cluster ID.
confluent connect event describe
Example output:
+-----------------+-------------------------------+
| Cluster         | lkc-abcd123                    |
| Environment     | env-o36079                    |
| Service Account |                        ...... |
| Topic Name      | confluent-connect-log-events  |
+-----------------+-------------------------------+
Check the API keys being used for the Audit Log cluster.
confluent api-key list --resource <audit-log-cluster-ID>
To create a new API and secret to consume connector events, you may need to delete an API key if there are two in use already. Make sure it’s okay to delete an API key first. Here is the command to delete an API key.
confluent api-key delete <audit-log-API-key>
After deleting an existing key, you can create the new audit log cluster API key.
confluent api-key create --service-account <service-account-ID> --resource <audit-log-cluster-ID>
Use the Audit Log API key.
confluent api-key use <audit-log-API-key> --resource <audit-log-cluster-ID>
Consume events using the Confluent CLI
The following steps provide information for consuming event records from the Connect event topic using the Confluent CLI.
Important
Consuming connector events is restricted to the OrganizationAdmin role.
Connectors that fail during provisioning are not reported to the events topic.
Confluent will make non-breaking changes to the schema without advance notice. Breaking changes will be widely communicated at least 180 days in advance, and we will continue to maintain compatibility during this time. For additional details, see the event schema compatibility policy.
- Prerequisites
Authorized access to a Confluent Cloud cluster.
The Confluent CLI installed and configured for the cluster. See Install the Confluent CLI.
One or more running Confluent Cloud connectors.
Make sure you are using the Audit Log cluster API key.
Enter the following command to get the event log topic name.
confluent connect event describe
Example output:
+-----------------+---------------------------------+
| Cluster         | <cluster-ID>                    |
| Environment     | <environment-ID>                |
| Service Account | <service-account-ID>            |
| Topic Name      | confluent-connect-log-events    |
+-----------------+---------------------------------+
Enter the following command to begin consuming event records from the topic. When a Connect event occurs, it is provided as a JSON-formatted record in the displayed output.
confluent environment use <environment-ID>
confluent kafka cluster use <cluster-ID>
confluent kafka topic consume -b confluent-connect-log-events
Consume events using Java and C/C++
Instructions for consuming records using Java and C/C++ are provided in the Confluent Cloud in-product documentation. To view the in-product documentation, go to the Administration menu and select Connect log events.
Confluent Cloud Administration Menu