
Profile a Query with Confluent Cloud for Apache Flink
Confluent Cloud for Apache Flink® enables you to profile the performance of your queries.
The Query Profiler provides enhanced visibility into how a Flink statement is processing data, which enables rapid identification of bottlenecks, data skew issues, and other performance issues.
The profiler updates metrics in near real-time, enabling you to monitor query performance as data flows through your pipeline.
For more information about the Query Profiler, see Flink SQL Query Profiler.
Prerequisites
You need the following prerequisites to use Flink in Confluent Cloud Console.
Access to Confluent Cloud.
Step 1: Analyze and run a statement
In this step, you use the EXPLAIN statement to perform a static analysis on a query and then start the query. The query is a temporal join between the orders and customers tables.
Log in to Confluent Cloud and navigate to your Flink workspace.
Run the following EXPLAIN statement to view a static analysis of a query.
EXPLAIN
SELECT
  o.order_id,
  o.`$rowtime`,
  c.customer_id,
  c.name,
  o.price
FROM examples.marketplace.orders o
JOIN examples.marketplace.customers FOR SYSTEM_TIME AS OF o.`$rowtime` c
ON o.customer_id = c.customer_id
WHERE o.`$rowtime` >= CURRENT_TIMESTAMP - INTERVAL '1' HOUR;
Your output should resemble:
== Physical Plan ==

StreamSink [12]
  +- StreamCalc [11]
    +- StreamTemporalJoin [10]
      +- StreamExchange [3]
      :  +- StreamCalc [2]
      :    +- StreamTableSourceScan [1]
      +- StreamExchange [9]
        +- StreamCalc [8]
          +- StreamChangelogNormalize [7]
            +- StreamExchange [6]
              +- StreamCalc [5]
                +- StreamTableSourceScan [4]
...
Run the statement.
SELECT
  o.order_id,
  o.`$rowtime`,
  c.customer_id,
  c.name,
  o.price
FROM examples.marketplace.orders o
JOIN examples.marketplace.customers FOR SYSTEM_TIME AS OF o.`$rowtime` c
ON o.customer_id = c.customer_id
WHERE o.`$rowtime` >= CURRENT_TIMESTAMP - INTERVAL '1' HOUR;
Step 2: Profile the query
In this step, you use the Query Profiler to monitor the performance of the query. The Query Profiler helps identify performance bottlenecks by showing where records are flowing slowly or backing up in the pipeline.
Navigate to your environment’s overview page.
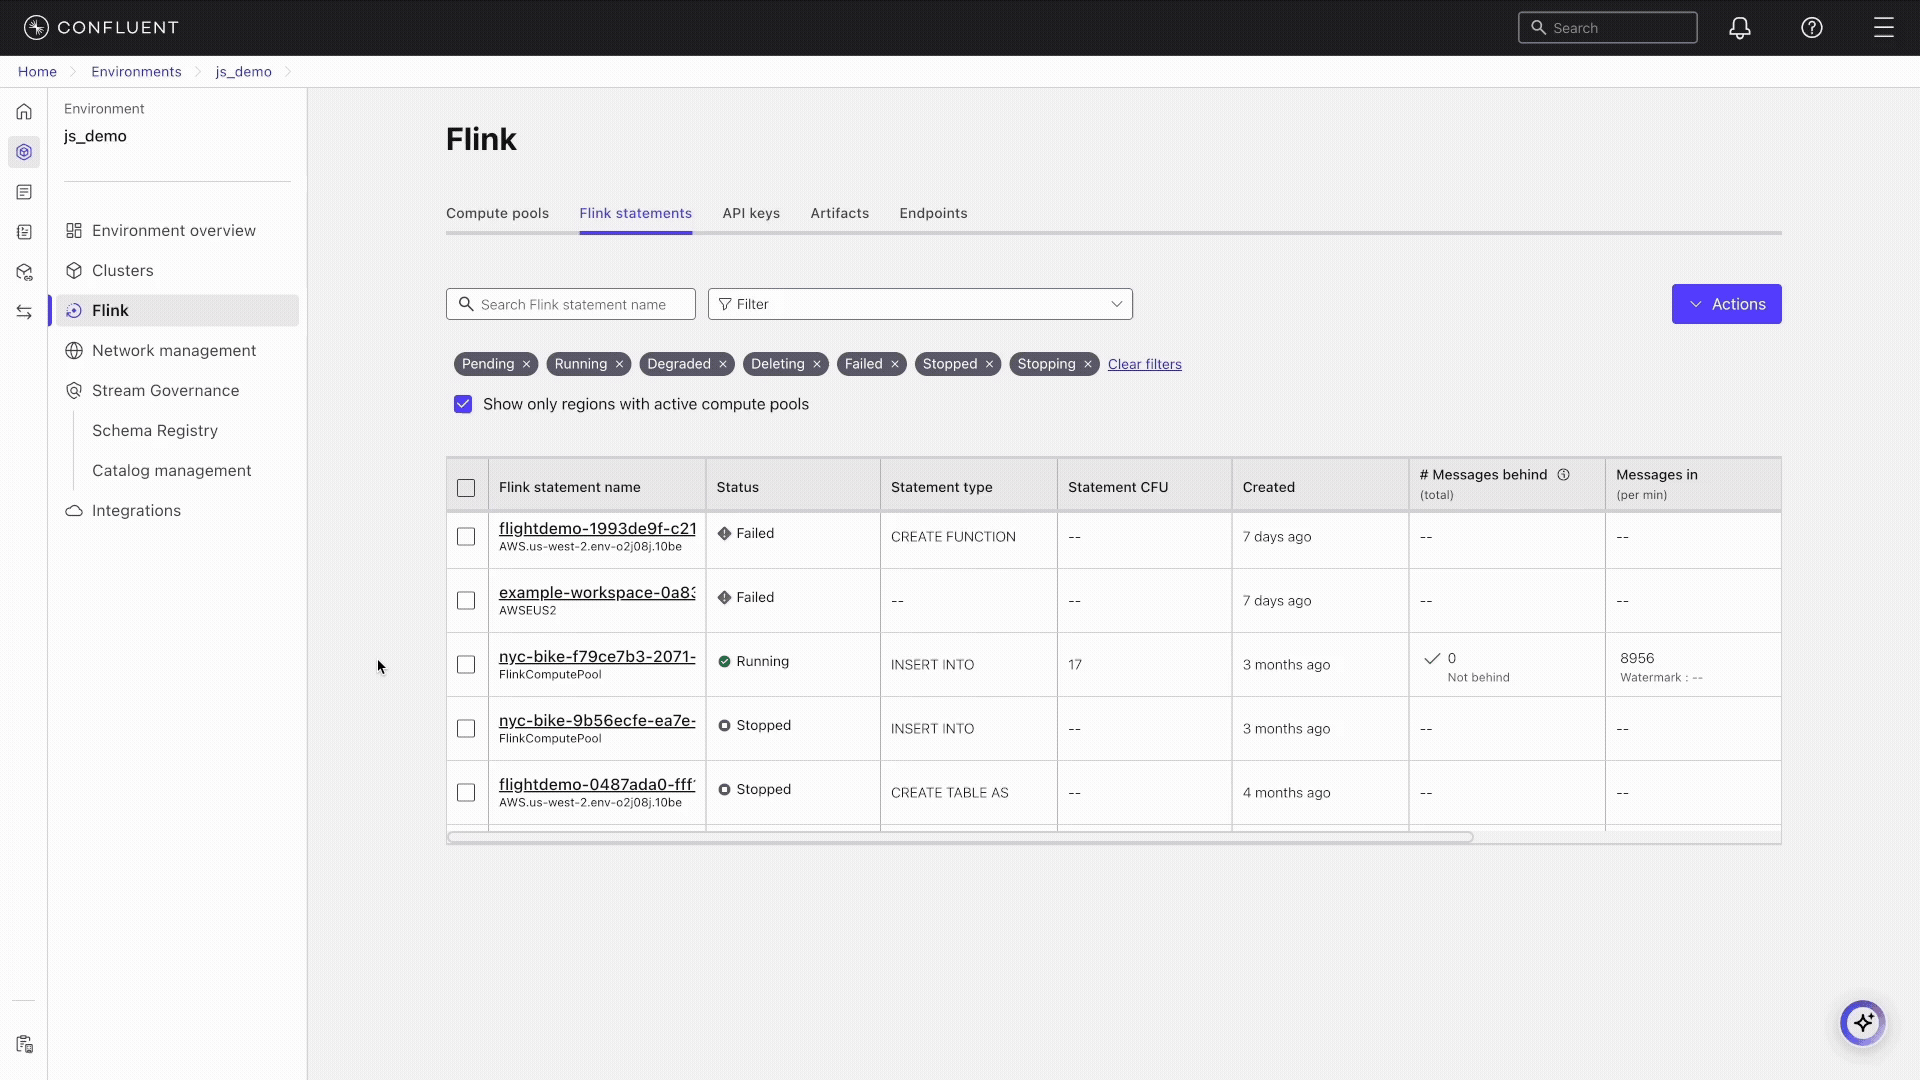
In the navigation menu, click Flink, and in the overview page, click Flink statements.
In the statement list, click your statement to open the statement details page.
Click Query profiler to view the profiler graph.
The Query Profiler opens and shows a graph of the Flink tasks that are running. The graph shows the physical execution plan of your query, with each operator represented as a node. Arrows connect the nodes and show the flow of data between operators. For each operator node, you can see:
The operator name and ID.
Metrics such as Idleness and Backpressure.
Resource utilization such as CPU and memory usage.
Key operators in the current temporal join query include:
StreamTableSourceScan nodes [1] and [4] reading from the orders and customers tables.
StreamCalc nodes [2], [5], [8], [11] performing filtering and projection.
StreamExchange nodes [3], [6], [9] handling data redistribution between tasks.
StreamChangelogNormalize [7] processing changelog records from the versioned customers table.
StreamTemporalJoin [10] joining the orders with customer versions based on event time.
StreamSink [12] writing results to the output.
Click the title bar of the TemporalJoin node to open the operator details pane.
Click Operator to view details about the operators in the task.
Expand State Size to view the amount of data currently stored by the task.
In the graph, click on other operator nodes to see metrics about their performance.
Check the Skew column in the Task tab metrics to identify data distribution imbalances across subtasks. A red diamond icon marks high skew values.
If you detect high skew, expand the metric row to see the warning banner. Click View parallel operators to see which operators have skew.
On the Operator tab, find the operator with high skew and click View parallel subtasks to see per-subtask metrics.
In the subtask breakdown, use the metric dropdown to compare different metrics across subtasks and identify hot subtasks.
Note
The same profiling workflow applies to statements in the DEGRADED state. You can use the Query Profiler to diagnose the root cause of degradation and identify which tasks or operators are driving resource consumption.