
Use the Flink SQL Query Profiler in Confluent Cloud for Apache Flink
The Query Profiler is a tool in Confluent Cloud for Apache Flink® that provides enhanced visibility into how a Flink SQL statement is processing data, which enables rapid identification of bottlenecks, data skew issues, and other performance concerns.
To use the Query Profiler, see Profile a Query.
The Query Profiler is a dynamic, real-time visual dashboard that provides insights into the computations performed by your Flink SQL statements. It boosts observability, enabling you to monitor running and degraded statements and diagnose performance issues during execution. The Query Profiler presents key metrics and visual representations of the performance and behavior of individual tasks, subtasks, and operators within a statement. Query Profiler is available in the Confluent Cloud Console.
Key features of the Query Profiler include:
Monitor in real time: Track the live performance of your Flink SQL statements, enabling you to react quickly to emerging issues.
View detailed metrics: The profiler provides a breakdown of performance metrics at various levels, including statement, task, operator, and partition levels, which helps you understand how different components of a Flink SQL job are performing.
Visualize data flow: The profiler visualizes data flow as a job graph, showing how data is processed through different tasks and operators. This helps you identify operators experiencing high latency, large amounts of state, or workload imbalances.
Reduce manual analysis: By offering immediate visibility into performance data, the profiler reduces the need for extensive manual logging and analysis, which can consume significant developer time. This enables you to focus on optimizing your queries and improving performance.
The Query Profiler helps you manage the complexities of stream processing applications and optimize query performance in real time.
Available metrics
The Query Profiler provides the following metrics for the tasks in your Flink statements.
Metric | Definition |
|---|---|
Backpressure | Percentage of time a subtask is stuck because it has produced output that it can’t send downstream. The downstream subtask has fallen behind and is temporarily unable to receive more records. Query Profiler reports the maximum backpressure value among all parallel subtasks for this task during the reporting interval. |
Busyness | Percentage of time a subtask is doing productive work. Query Profiler reports the maximum busyness value among all parallel subtasks for this task during the reporting interval. Idleness and busyness do not always add up to 100% because backpressure is a separate state. |
Bytes in/min | Amount of data received by a task per minute. |
Bytes out/min | Amount of data sent by a task per minute. |
Idleness | Percentage of time a subtask is neither backpressured nor busy. Query Profiler reports the maximum idleness value among all parallel subtasks for this task during the reporting interval. Idleness and busyness do not always add up to 100% because backpressure is a separate state. |
Messages in/min | Number of events the task receives per minute. |
Messages out/min | Number of events the task sends out per minute. |
State size | Amount of data stored by the task during processing to track information across events. |
Watermark | Timestamp Flink uses to track event time progress and handle out-of-order events. |
The Query Profiler provides the following metrics for the operators in your Flink statements.
Metric | Definition |
|---|---|
Messages in/min | Number of events the operator receives per minute. |
Messages out/min | Number of events the operator sends out per minute. |
State size | Amount of data stored by the operator during processing to track information across events. |
Watermark | Timestamp Flink uses to track event time progress and handle out-of-order events. |
The Query Profiler provides the following metrics for the Kafka partitions in your data source(s).
Metric | Definition |
|---|---|
Active | Percentage of time the partition is active. An active partition processes events and creates watermarks to keep your statements running smoothly. |
Blocked | Percentage of time the partition is blocked. A blocked partition is overwhelmed with data, causing delays in the watermark calculation. |
Idle | Percentage of time the partition is idle. An idle partition has not received any events for a certain time period and is not contributing to the watermark calculation. |
Data skew
The Query Profiler includes a Skew column alongside the task and operator metrics tables. The Skew column shows a percentage (0%–100%) that measures how unevenly data is distributed across the parallel subtasks of a task or operator. A skew of 0% means all subtasks are processing roughly equal amounts, while 100% means one subtask is handling all the work.
The Skew column is available for the following metrics:
Messages in/min
Messages out/min
Bytes in/min
Bytes out/min
State size
Busyness
Time backpressured
Metrics where skew does not apply, such as Watermark, display N/A in the Skew column.
High skew values are highlighted with a red diamond icon. When you expand a metric row that has high skew, a warning banner appears:
Task tab: A red banner indicates high data skew and directs you to the Operator tab to find which operators have skew. Click View parallel operators to navigate there.
Operator tab: A yellow banner indicates high skew for a specific operator and directs you to the subtask breakdown. Click View parallel subtasks to see per-subtask metrics.
For guidance on diagnosing and resolving high skew, see Troubleshoot data skew.
Subtask breakdown
Subtasks are the parallel instances of a task. The subtask breakdown view lets you compare metrics across individual subtasks to pinpoint which instances are overloaded or underutilized.
You can access the subtask breakdown in two ways:
Click View subtasks at the bottom of the Task tab.
Click View parallel subtasks from the operator-level skew warning banner.
The subtask breakdown view shows:
A breadcrumb trail for navigation (Task > or Operators >).
A metric dropdown that lets you select different metrics to compare across subtasks, such as Messages in/min, Busyness, or State size.
A two-column table showing the subtask number and the value for the selected metric.
Use the subtask breakdown to identify hot subtasks, for example, one subtask processing significantly more data than others. If you see an imbalance, see Troubleshoot data skew for resolution steps.
Note
The subtask breakdown only shows subtasks that have reported metrics. If a subtask has not emitted any data for the selected metric, it does not appear in the list. This means you can see gaps in the subtask numbering, for example, subtasks 6, 9, and 11 without the numbers in between.
Troubleshoot Flink SQL statements
The Query Profiler enables you to examine your running or degraded Flink SQL statements:
Verify throughput: is it fast enough?
Verify liveness: is data flowing?
Verify efficiency: is it cost-effective?
The following sections cover the three most common operational scenarios, explaining the core concepts and providing a step-by-step resolution workflow.
Scenario 1: The high-latency problem (throughput)
The issue: The job is running, but consumer lag is increasing, or the statement can’t keep up with input volume.
Always check this scenario first. If your job is backpressured, it could also cause the symptoms described in Scenario 2 (Stalled Watermarks).
Concepts and context
At any moment, each parallel instance of a Flink SQL task, which is called a subtask, is in one of three states: idle, busy, or backpressured.
Backpressured: A subtask is stuck because it has produced output that it can’t send downstream. The downstream subtask has fallen behind and is temporarily unable to receive more records. Backpressure propagates upstream, from sink to source.
Busy: A subtask is doing productive work.
Idle: A subtask is neither backpressured nor busy.
The task-level Backpressure, Busyness, and Idleness metrics that Query Profiler reports are the maximum values reported by any of the parallel subtasks for that task during the reporting interval. Query Profiler reports these worst-case values because one overwhelmed instance can significantly degrade the performance of the entire Flink SQL job.
Tasks vs. operators: The nodes in the graph are tasks. A single task can contain multiple operators chained together, for example, a join chained with a filter. You must infer which operator inside the task is causing the bottleneck.
Usually, there is only one “heavy” operator in the chain, which is almost always a join, an aggregation, or a sink materializer.
Almost always, these operators run in separate tasks, as they are usually keyed differently.
If you see a task that is 100% busy, you are almost certain that the vast majority of the busyness can be attributed to one of these “known to be heavy” operators.
Step 1: Find the bottleneck
Use the following flowchart to identify the bottleneck.
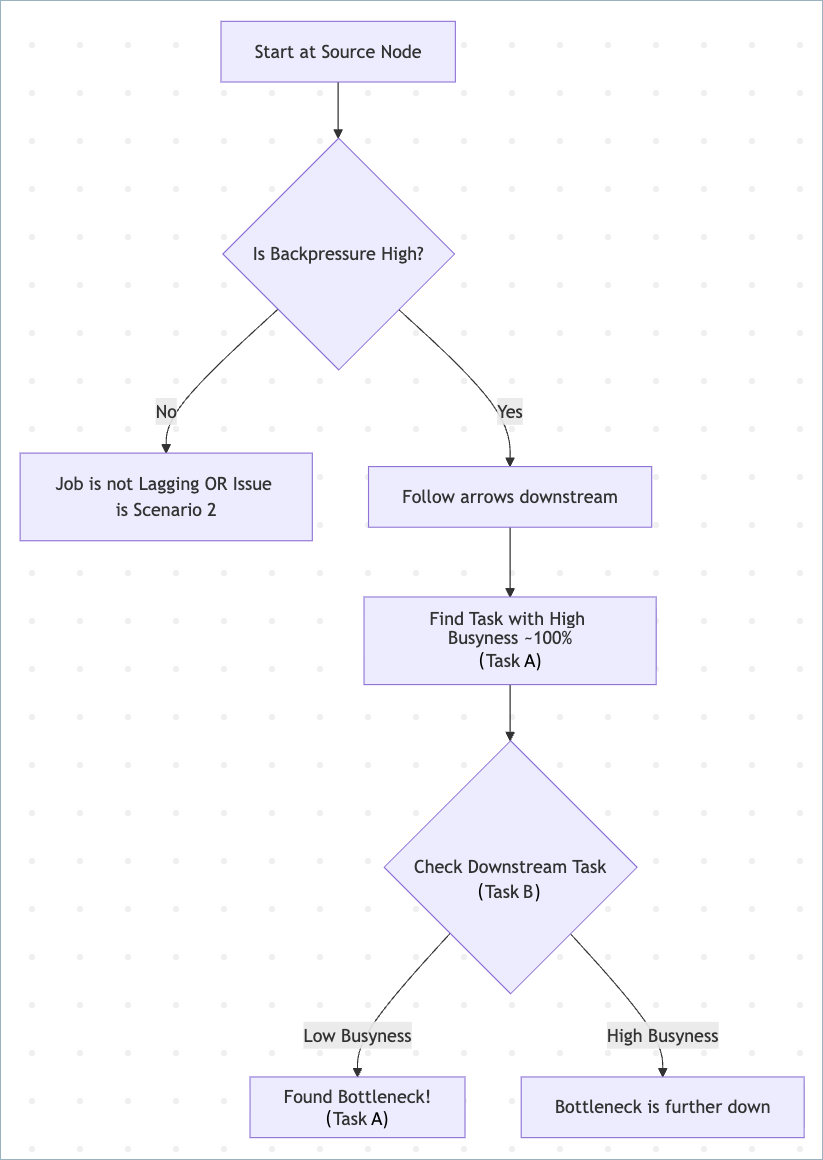
Start at the source node. If lag exists, the source usually shows high backpressure.
Follow the graph downstream.
Look for the most busy task, with busyness near 100%.
The bottleneck is the task performing heavy work and is 100% busy, while its downstream neighbor is relatively idle, waiting for data.
Usually, the first upstream task with busyness near 100% is the bottleneck, even if the downstream has high busyness, like 90%.
If multiple tasks are 100% busy, focus on the one with the most complex logic like joins or aggregations.
Step 2: Analyze the bottleneck task
Click the bottleneck task and check its metrics.
Check the Skew column.
Because busyness reports the maximum value across subtasks, a task can report 100% busy even if only one subtask is overloaded.
Look for metrics with high skew (marked with a red diamond). Expand the metric row to see the warning banner. Click View parallel operators to identify which operator has skew, then click View parallel subtasks to see the per-subtask breakdown.
For a detailed walkthrough on diagnosing and fixing skew, see Troubleshoot data skew.
Note
Skew can be less reliable when metric values are extremely low, for example, low state size or low throughput.
Identify the heavy operator.
You can see individual operator metrics in the operator tab.
Usual suspects: Joins, Aggregations, Window functions, and Sinks.
Unlikely: Calc, Filter, or Map (unless using complex UDFs/Regex).
Check for window firing (edge case).
If an upstream window operator and a downstream operator both show “Medium” busyness, like 60%, and fluctuating backpressure, the bottleneck might be moving. This happens when a window fires, momentarily flooding the downstream operator.
Step 3: Apply the fix
Fix the bottleneck task.
If skew is high:
Check your distribution keys (GROUP BY or PARTITION BY keys). Avoid keys with frequent NULL or default values.
Use a WHERE clause to filter bad data before it hits the aggregation.
If busyness is high (CPU Bound) and evenly distributed:
Scale up by increasing the MAX_CFU of your compute pool. Flink Autopilot increases the parallelism of the bottleneck task.
Optimize logic. Look for expensive operations that can be simplified, such as regular expressions, complex JSON parsing, or large UNNESTs.
Step 4: Verify the fix
Backpressure at the source should drop to 0% or fluctuate at low levels.
Consumer lag should decrease continuously.
Scenario 2: The “no output” problem (liveness)
The statement is RUNNING and has available capacity, meaning that it’s not backpressured, but no data is appearing in the sink.
Ensure the job is not backpressured. Backpressure also blocks watermark flow.
Concepts and context
Watermarks: Markers inserted into the stream to measure event-time progress. For more information, see Time and Watermarks.
The Minimum Watermark Rule: If reading from multiple partitions, the slowest partition determines the global watermark.
Idle partition: A partition sending no data. If it sends no data, it advances no watermarks. This freezes the global time, preventing windows and interval joins from triggering.
Blocked partition (watermark alignment): A partition status meaning Flink has paused reading from a fast partition to let older data from other partitions catch up. This is usually a healthy symptom of Flink managing alignment, not a root cause requiring user intervention.
Step 1: Check the sink watermark
Use the following flowchart to identify the bottleneck.
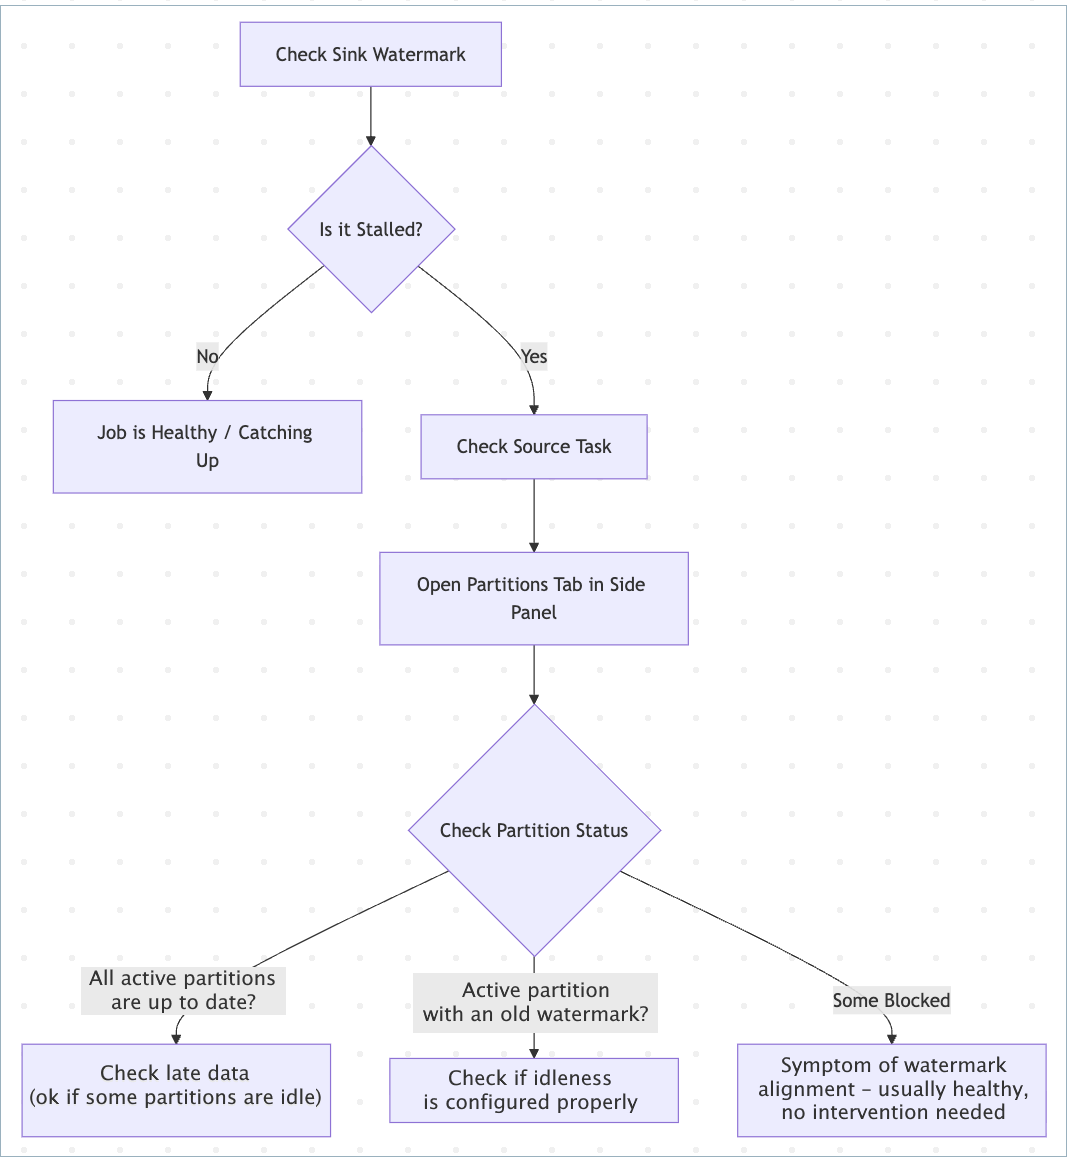
Look at the Sink task card.
Healthy: Timestamp is near real-time.
Stalled: Timestamp is old, for example, 4 hours behind, or empty (-).
Inspect source partitions.
If Flink marks a partition as idle, this means idleness detection has kicked in, and the partition isn’t blocking watermarks.
Are watermarks stalled with no backpressure? If yes, check active partitions that are holding back the combined watermarks, those with the lowest watermark, and decide whether to mark them as idle sooner or more aggressively.
This holds true if all partitions are active and if some are idle/blocked. For stalled watermarks, always focus on active partitions with old watermarks.
A common problem occurs when you have “de-facto” idle or almost-idle partitions but haven’t configured idleness detection. In this case, Flink marks all partitions as active, with a large spread of watermark values between partitions. For example, truly active partitions would have watermarks that are nearly up to date, while de-facto idle partitions have a stalled watermark from the distant past.
Step 2: Apply the fix
Update your table definition to include the sql.tables.scan.idle-timeout property. This tells Flink to ignore partitions that haven’t sent data for a specific duration. This approach can lead to dropped late records when you apply a more aggressive watermarking strategy.
CREATE TABLE orders (
  ...
  WATERMARK FOR order_time AS order_time - INTERVAL '5' SECOND
) WITH (
  'sql.tables.scan.idle-timeout' = '1 minute'
);
Step 3: Verify the fix
Redeploy the statement.
Check the Watermark metric on the sink. It should advance steadily, even if some source partitions remain idle.
Scenario 3: High cost or “degraded” status (efficiency)
The statement is consuming excessive CFUs and increasing your bill, or it has entered a DEGRADED status and is failing to checkpoint.
Tip
The Query Profiler is available for DEGRADED statements. When a statement enters the DEGRADED state, open the Query Profiler as your first step to see which tasks and operators are driving resource consumption.
Concepts and context
Unbounded state: Operations like JOIN without interval and GROUP BY without windows must store data in memory forever unless you tell Flink when to forget it.
State bloat: As state grows, checkpoints become slower and more expensive, eventually causing the job to degrade or crash.
Retractions and changelogs: Operators that handle updates or deletions, like SinkMaterializer and ChangelogNormalize, require significant state to manage the stream history correctly.
Step 1: Check resource trends
Use the following flowchart to check for unbounded state and state bloat.
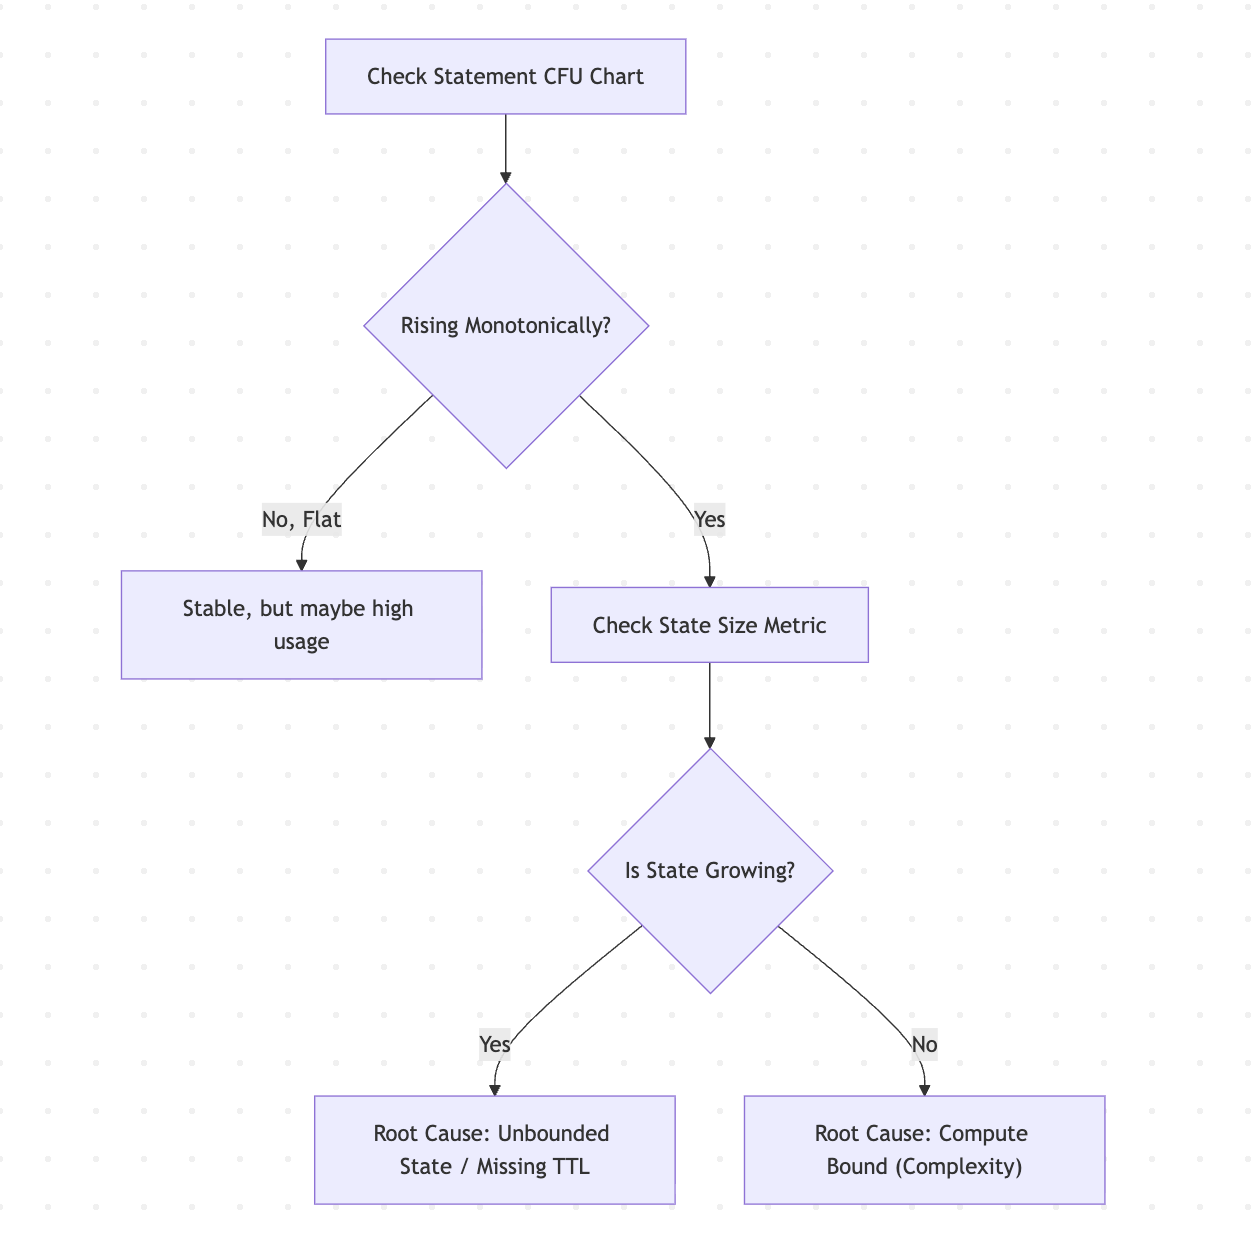
Check resource trends.
Healthy: CFUs rise during startup, then plateau.
Unhealthy: CFUs continually rise over time until hitting the pool limit.
Identify the resource driver.
State Bloat: Click on the heavy operators and check the State Size.
Common culprits are join and aggregation operators.
Changelog operators: Look for SinkMaterializer or ChangelogNormalize. These operators maintain state to handle data retractions and updates.
Compute Bloat: Check Busyness. If Busyness is consistently 100% across all nodes, the query complexity is high for the cluster size.
Step 2: Apply the fix
Fix unbounded state
Consider the following approaches to fix unbounded state. This list is not exhaustive. Fixing efficiency issues can sometimes require completely rewriting the query logic to avoid heavy operations or unnecessary state retention.
Apply a state time-to-live (TTL) hint to specify operator-level Idle State Retention Time (TTL).
SELECT /*+ STATE_TTL('posts'='6h', 'users'='2d') */ *
FROM posts
JOIN users ON posts.user_id = users.id;
Use interval joins instead of regular joins to limit the matching window.
-- Efficient: Join only if events are within 1 hour of each other
-- ...
WHERE o.ts BETWEEN c.ts - INTERVAL '1' HOUR AND c.ts
Use temporal joins (lookup joins) against a versioned table. This can significantly reduce state usage compared with standard stream-stream joins.
Fix resource exhaustion
If you have optimized the query and applied TTL but the statement remains degraded, the workload requires more resources. Increase the compute pool size (Max CFUs).
Step 3: Verify the fix
Statement CFU usage should stabilize.
State size should stop growing monotonically. State size still can grow monotonically during the bootstrapping phase of the job, but growth should slow down and approach a reasonable limit.
State size can be unbounded and initially can grow rapidly, for example, 1 GB/hour, but after the job catches up, state should grow slowly, for example, 1 GB/year.
The statement status should return to RUNNING.
Troubleshoot data skew
You have identified high data skew in the Query Profiler. This section walks you through diagnosing the root cause and applying a fix.
Step 1: Diagnose the skew
Open the Task tab and check the Skew column. Identify which metrics show high skew, marked with a red diamond.
Expand the metric row to see the warning banner. Click View parallel operators to switch to the Operator tab.
On the Operator tab, find the operator with high skew. Click View parallel subtasks to open the subtask breakdown.
In the subtask breakdown, use the metric dropdown to examine different metrics across subtasks. Identify hot subtasks, for example, one subtask processing 10x more messages than others.
Step 2: Identify the root cause
Common causes of data skew include:
Hot keys: A small number of key values in your
GROUP BYorPARTITION BYclause receive a disproportionate share of traffic.NULL or default values: Records with NULL or default key values all route to the same subtask.
Uneven source partitions: The upstream Kafka topic has partitions with significantly different data volumes.
Temporal patterns: Traffic patterns that concentrate data on certain keys during specific time windows.
Step 3: Apply the fix
Rebalance keys: Choose distribution keys with higher cardinality, or add a secondary key to spread data more evenly.
Filter before aggregation: Use a
WHEREclause to remove NULL or default values before they reach the aggregation operator.Increase parallelism: Scale up by increasing the
MAX_CFUof your compute pool. Flink Autopilot increases the parallelism of the bottleneck task, which can help distribute work more evenly.
Step 4: Verify the fix
The Skew percentage should drop across the affected metrics.
Busyness should distribute more evenly across subtasks. Check the subtask breakdown to confirm.
If skew was causing backpressure, the source backpressure should decrease.