
Monitor Confluent Platform clients with Unified Stream Manager
With Unified Stream Manager (USM), you can monitor producer and consumer client metrics for your Confluent Platform clusters in the Confluent Cloud Console. Clients push observability data directly to the Kafka brokers using the KIP-714 client metrics push mechanism, an Apache Kafka® standard for client-side observability. The USM Agent, which runs in your on-premises environment, collects this data and visualizes it in Confluent Cloud alongside your other cluster metrics.
Use client monitoring to identify issues and optimize client configurations by tracking connections, requests, throughput, and latency.
Supported versions
Client monitoring supports Confluent Platform clusters running KRaft mode on the following versions:
Confluent Platform 7.9.6 or later within the 7.9.x series
Confluent Platform 8.1.2 or later
Note
ZooKeeper-based clusters are not supported.
Before you begin
Complete the following steps before monitoring clients in the Confluent Cloud Console:
Ensure your Confluent Platform cluster meets the version requirements in Supported versions and is running in KRaft mode.
Ensure your clients are using a supported client version:
Java client 3.7.2 or later
C/C++ client (librdkafka) 2.6 or later
Enable client monitoring on your Confluent Platform cluster. For configuration steps using Confluent for Kubernetes (CFK), Confluent Ansible, or manual broker configuration, see Configure client monitoring.
View clients in the Confluent Cloud Console
Follow these steps to navigate to the Clients page for your Confluent Platform cluster in the Confluent Cloud Console.
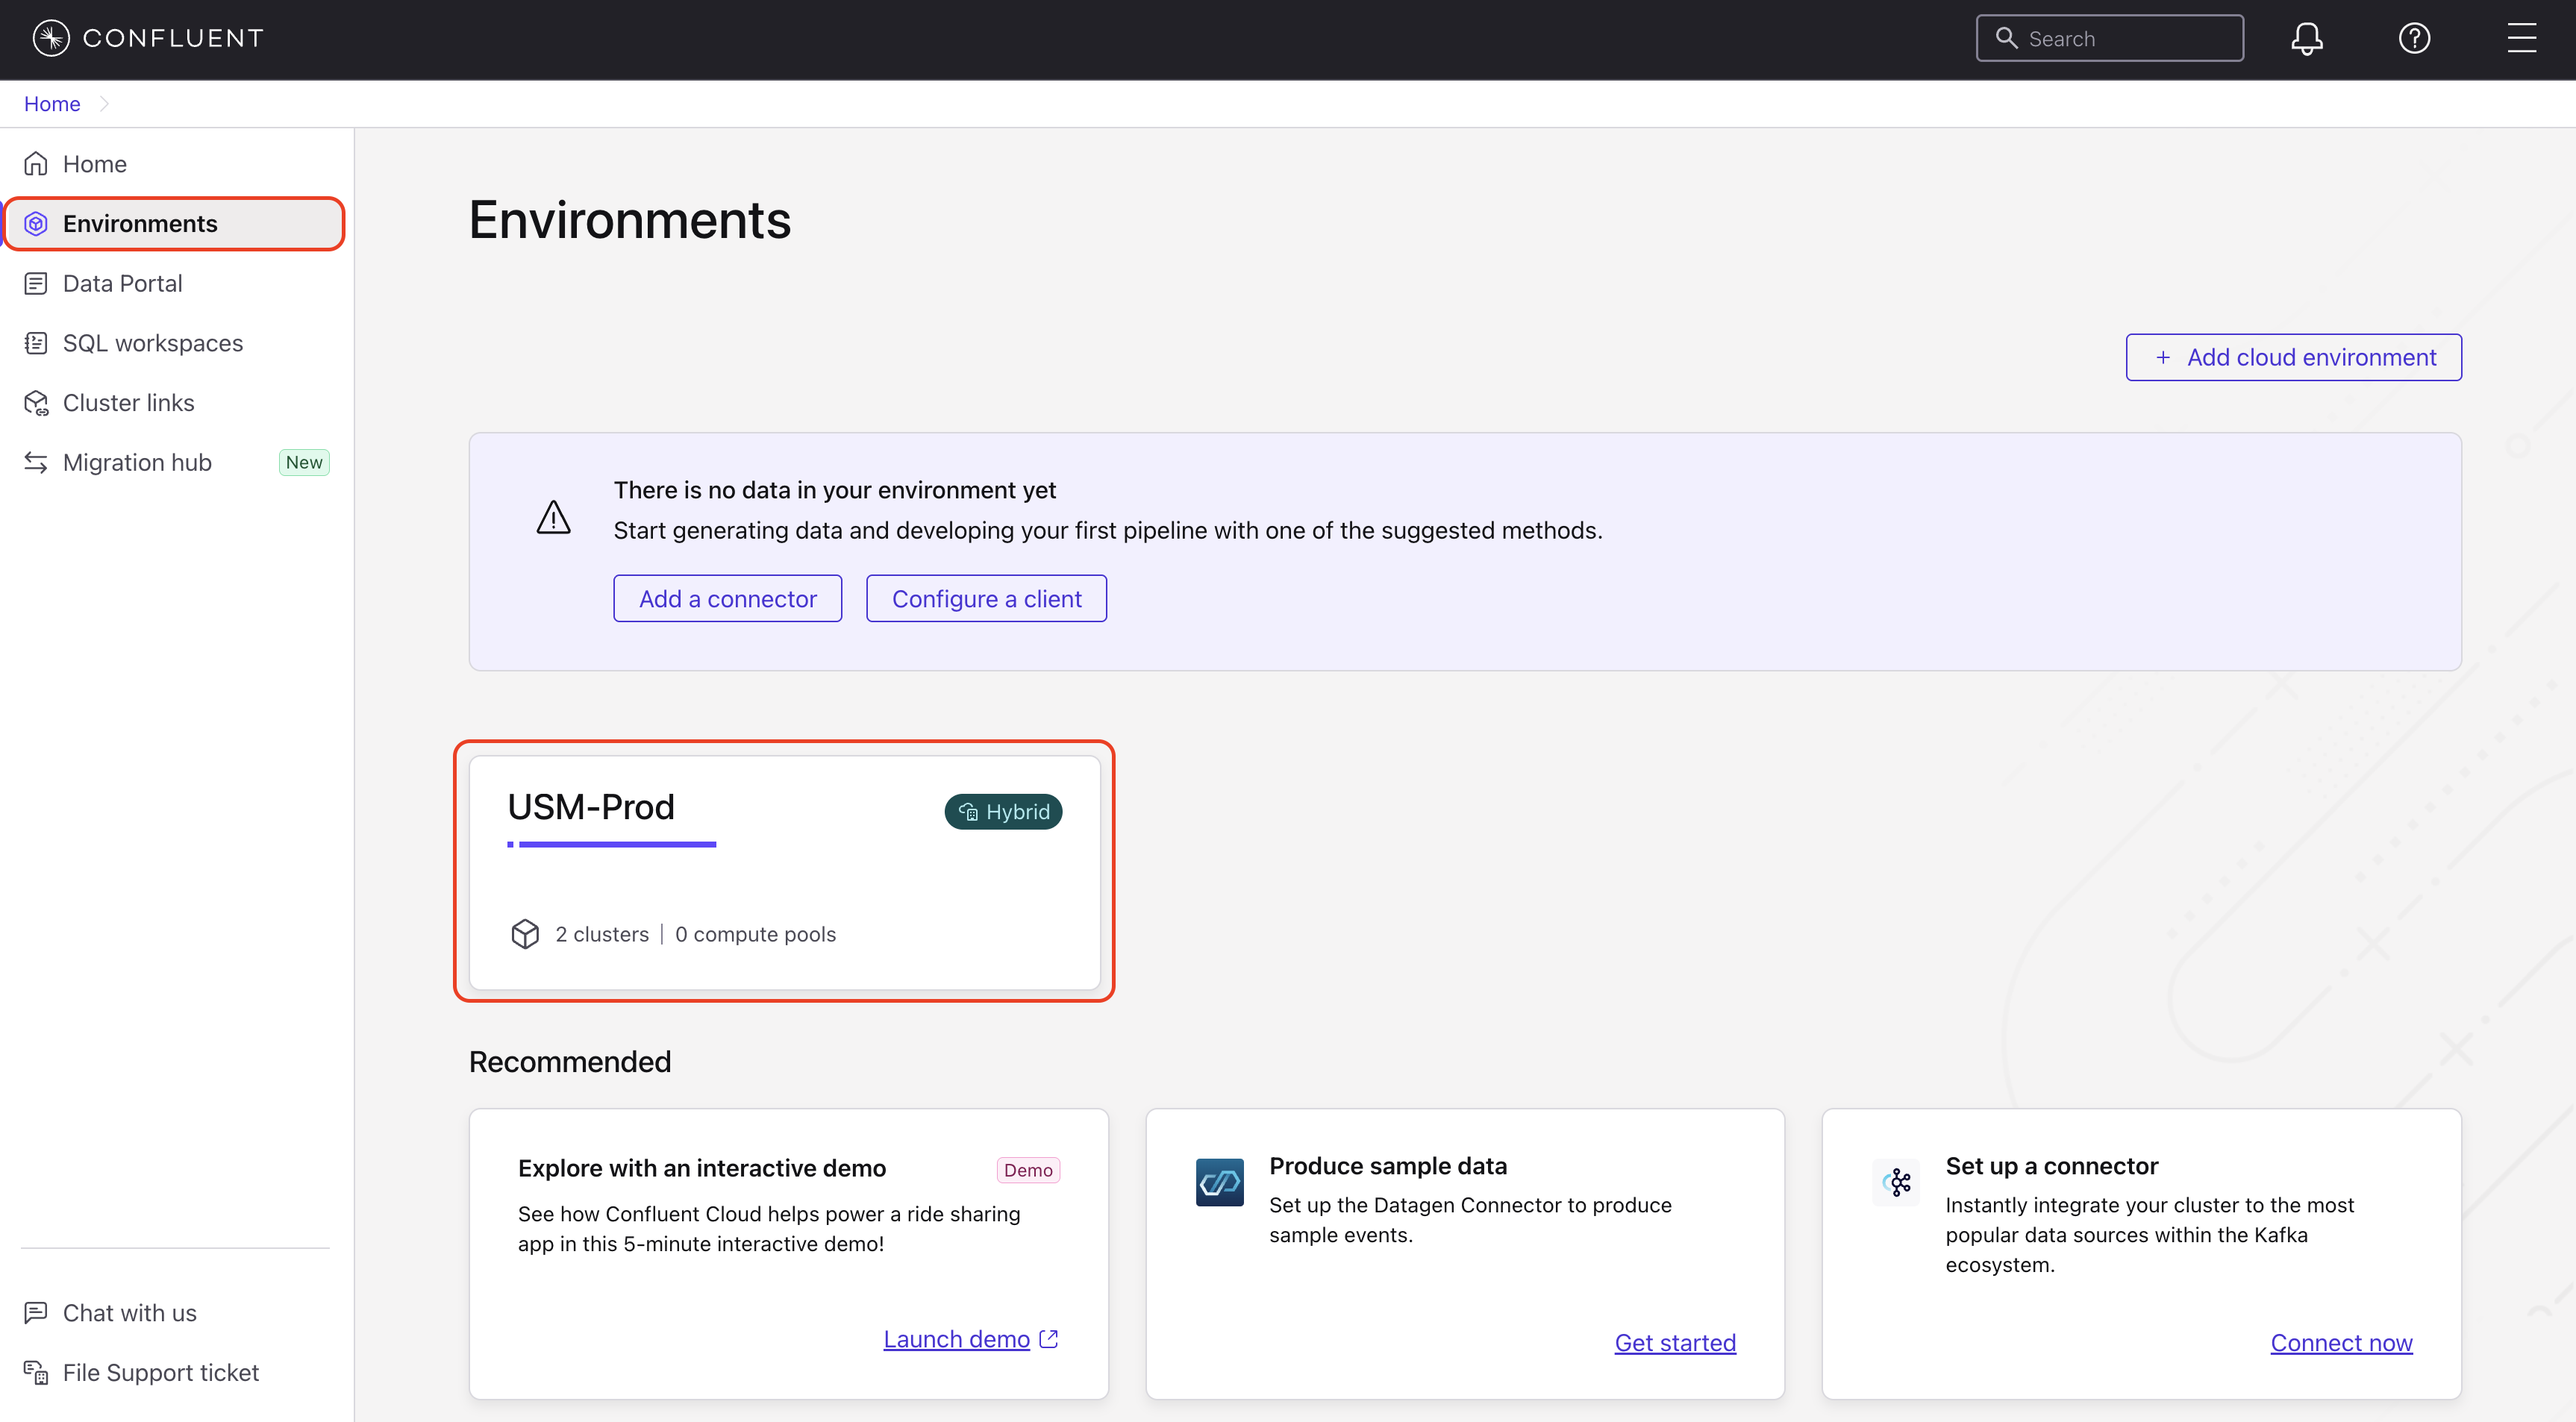
In the Confluent Cloud Console, navigate to the Environments page and select your environment.
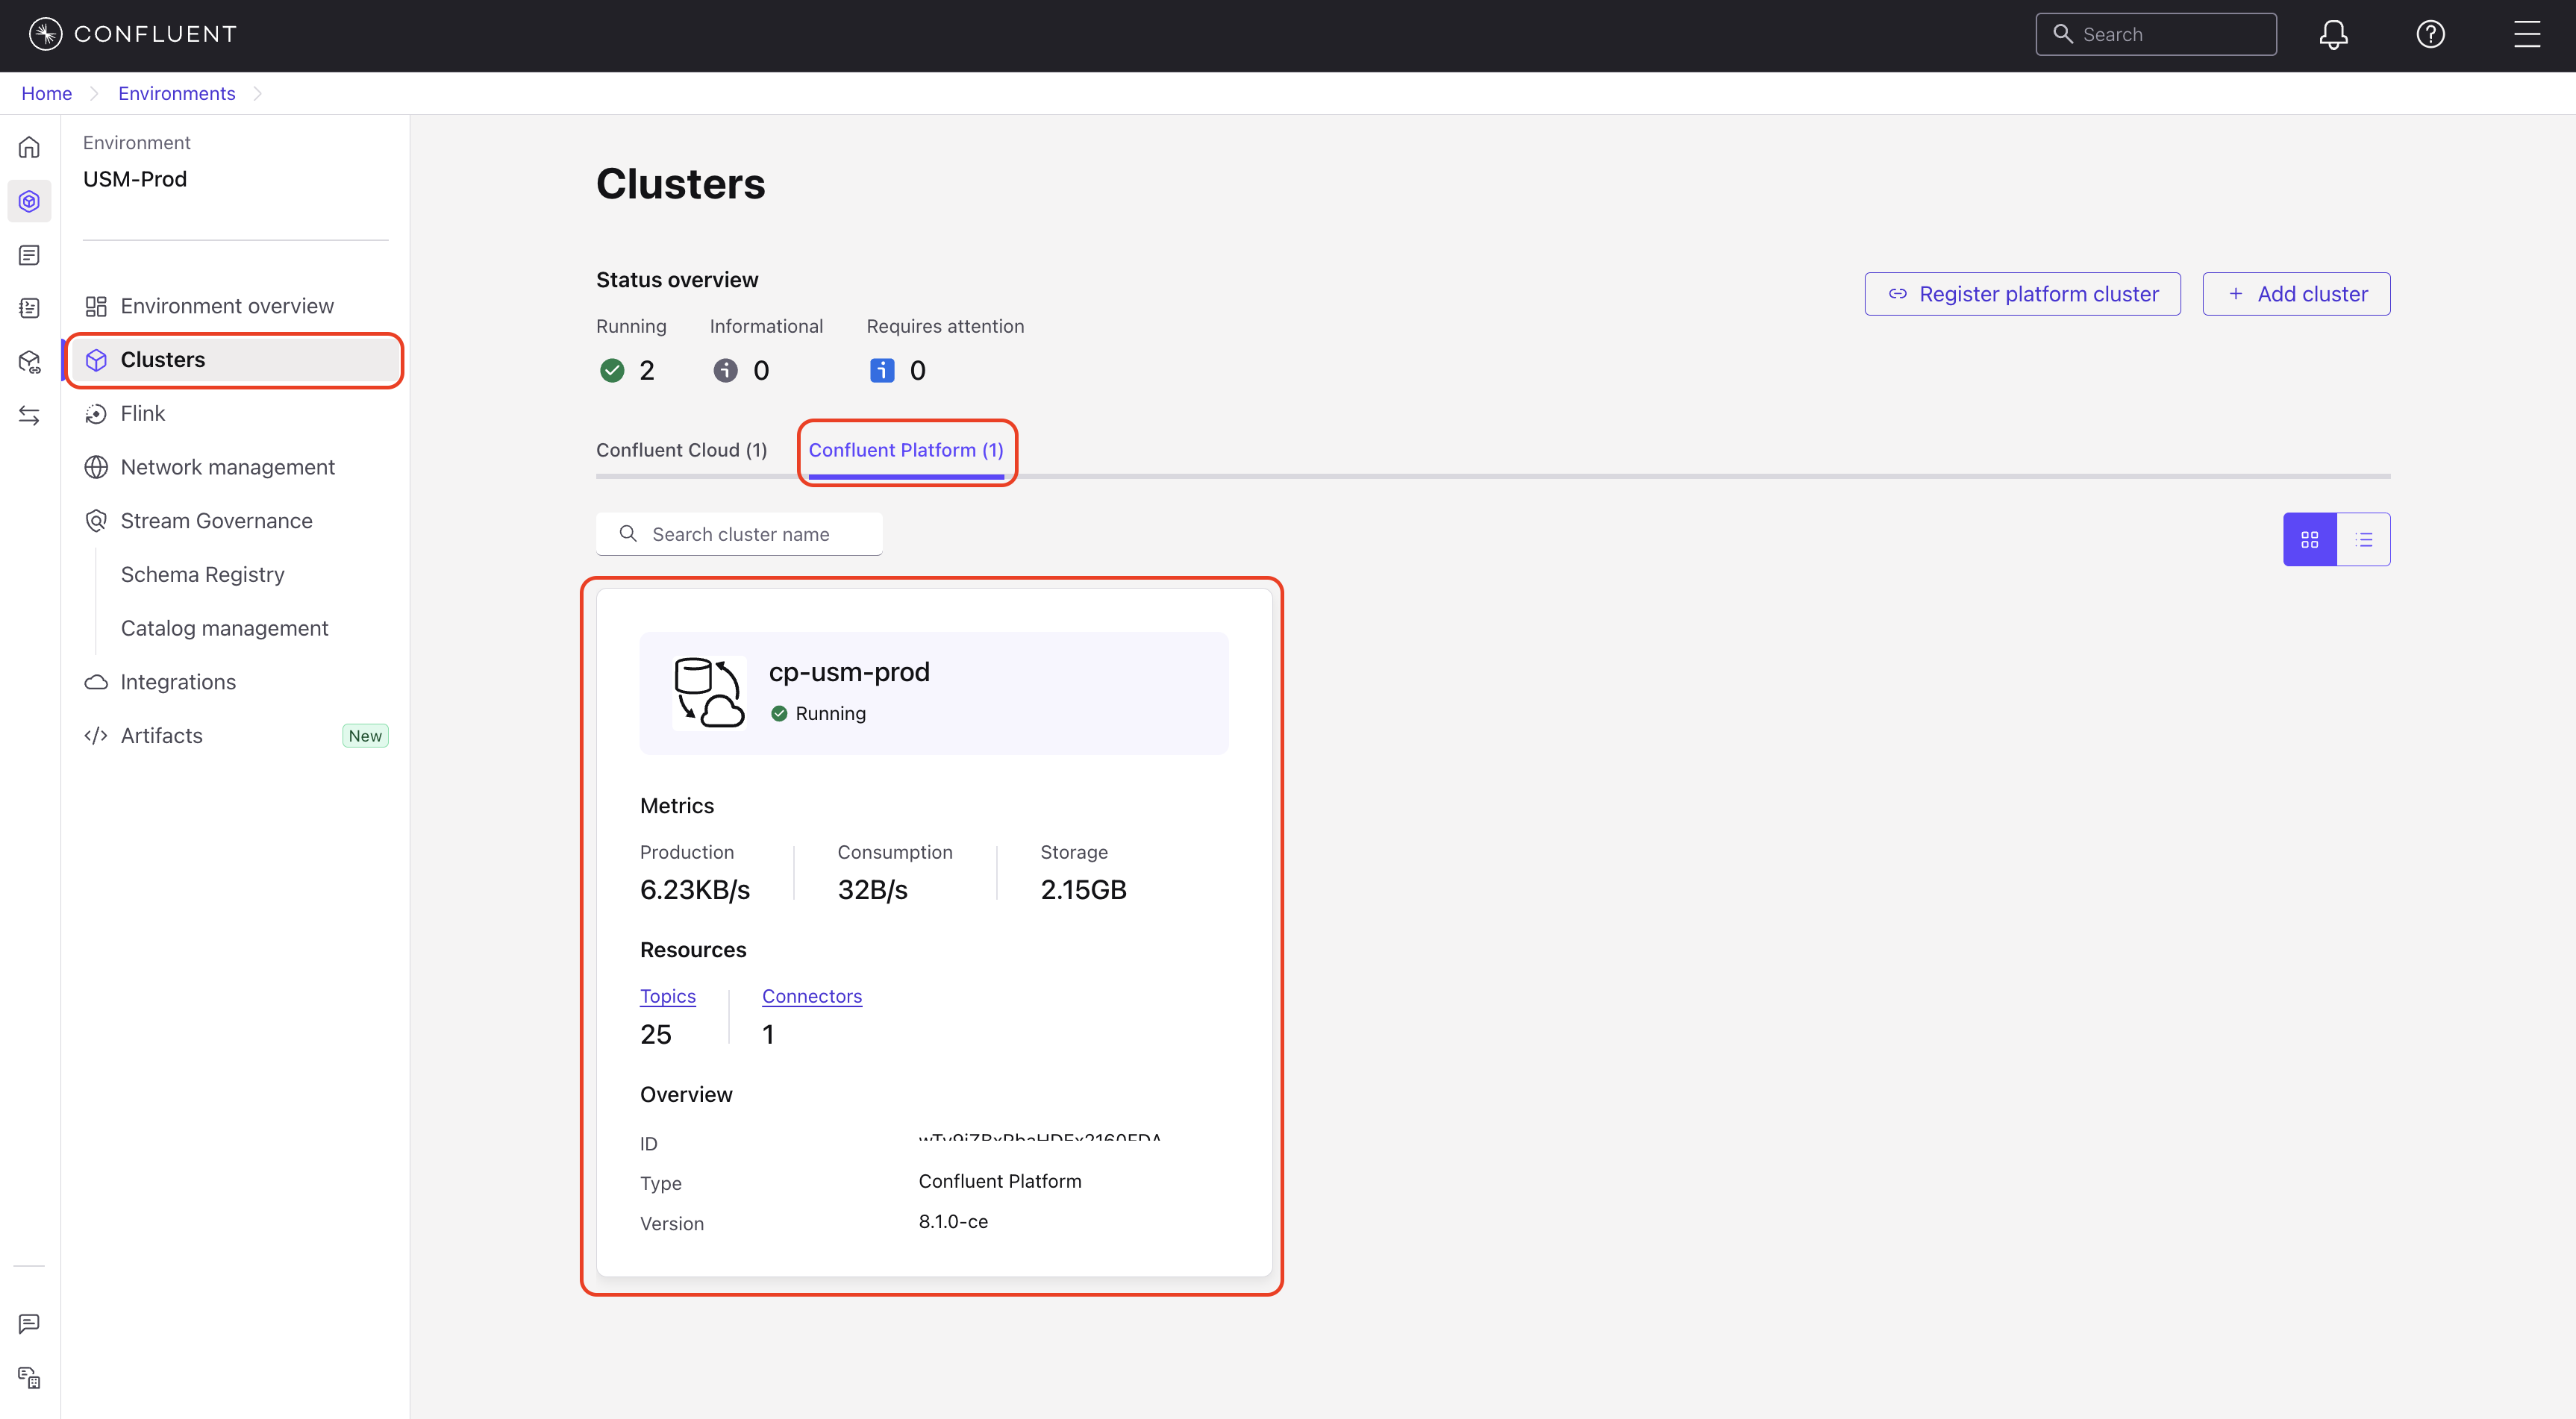
In the navigation menu, select Clusters, then select your Confluent Platform cluster.
In the cluster’s navigation menu, select Clients.
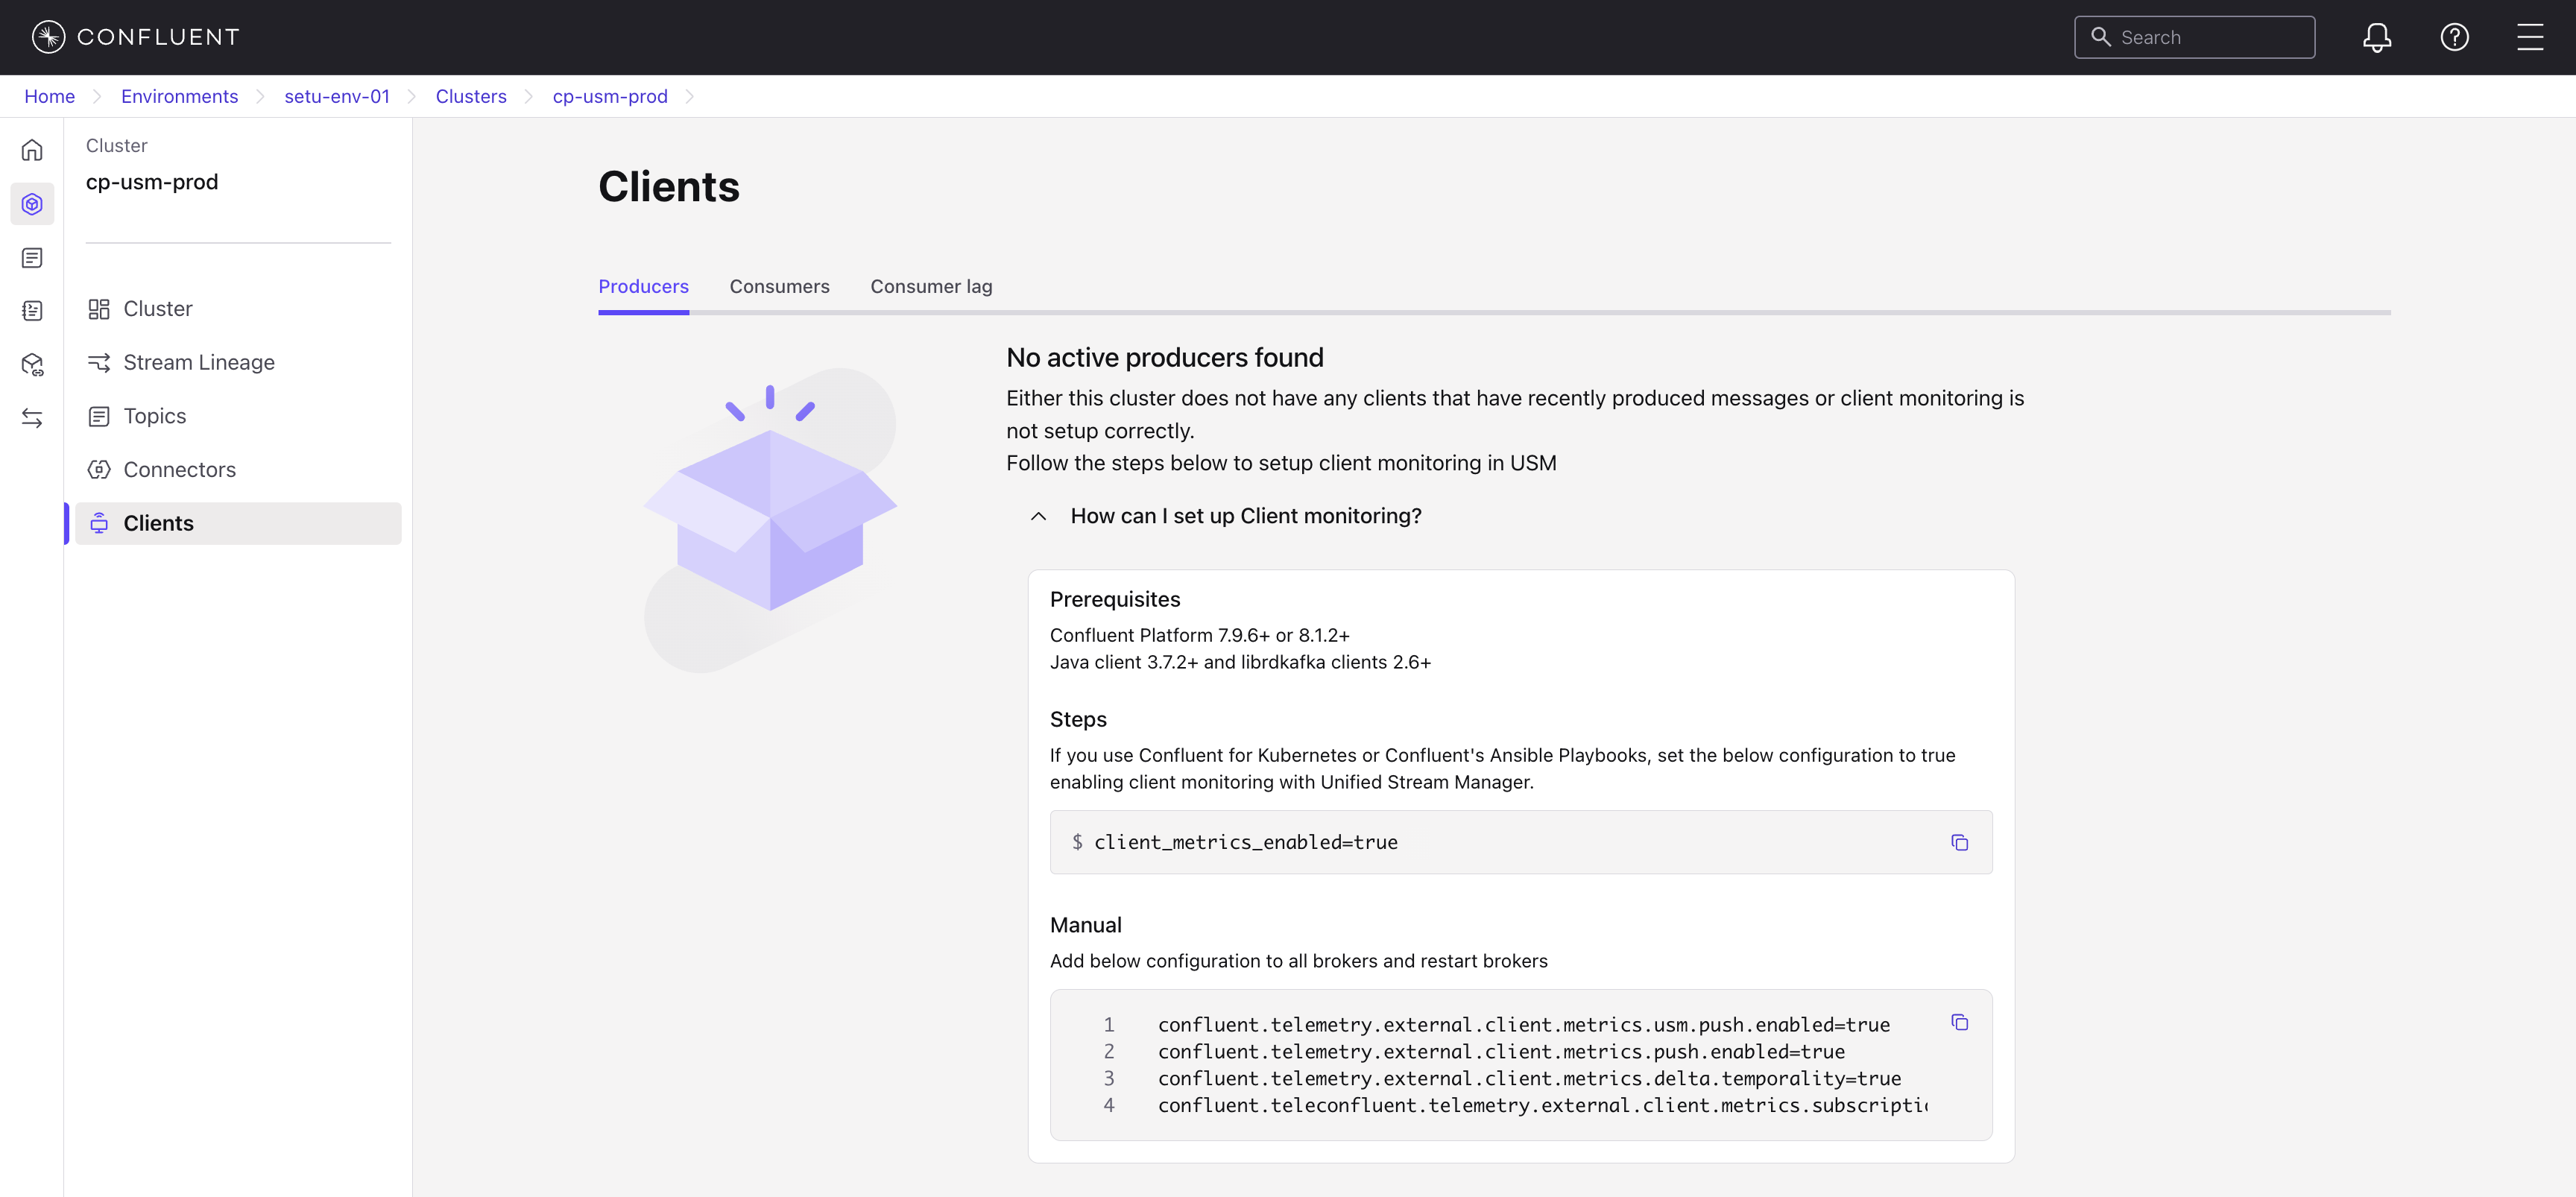
If you see an empty state with setup instructions, client monitoring is not yet configured on this cluster. Complete the steps in Configure client monitoring before proceeding.
Monitor producers and consumers
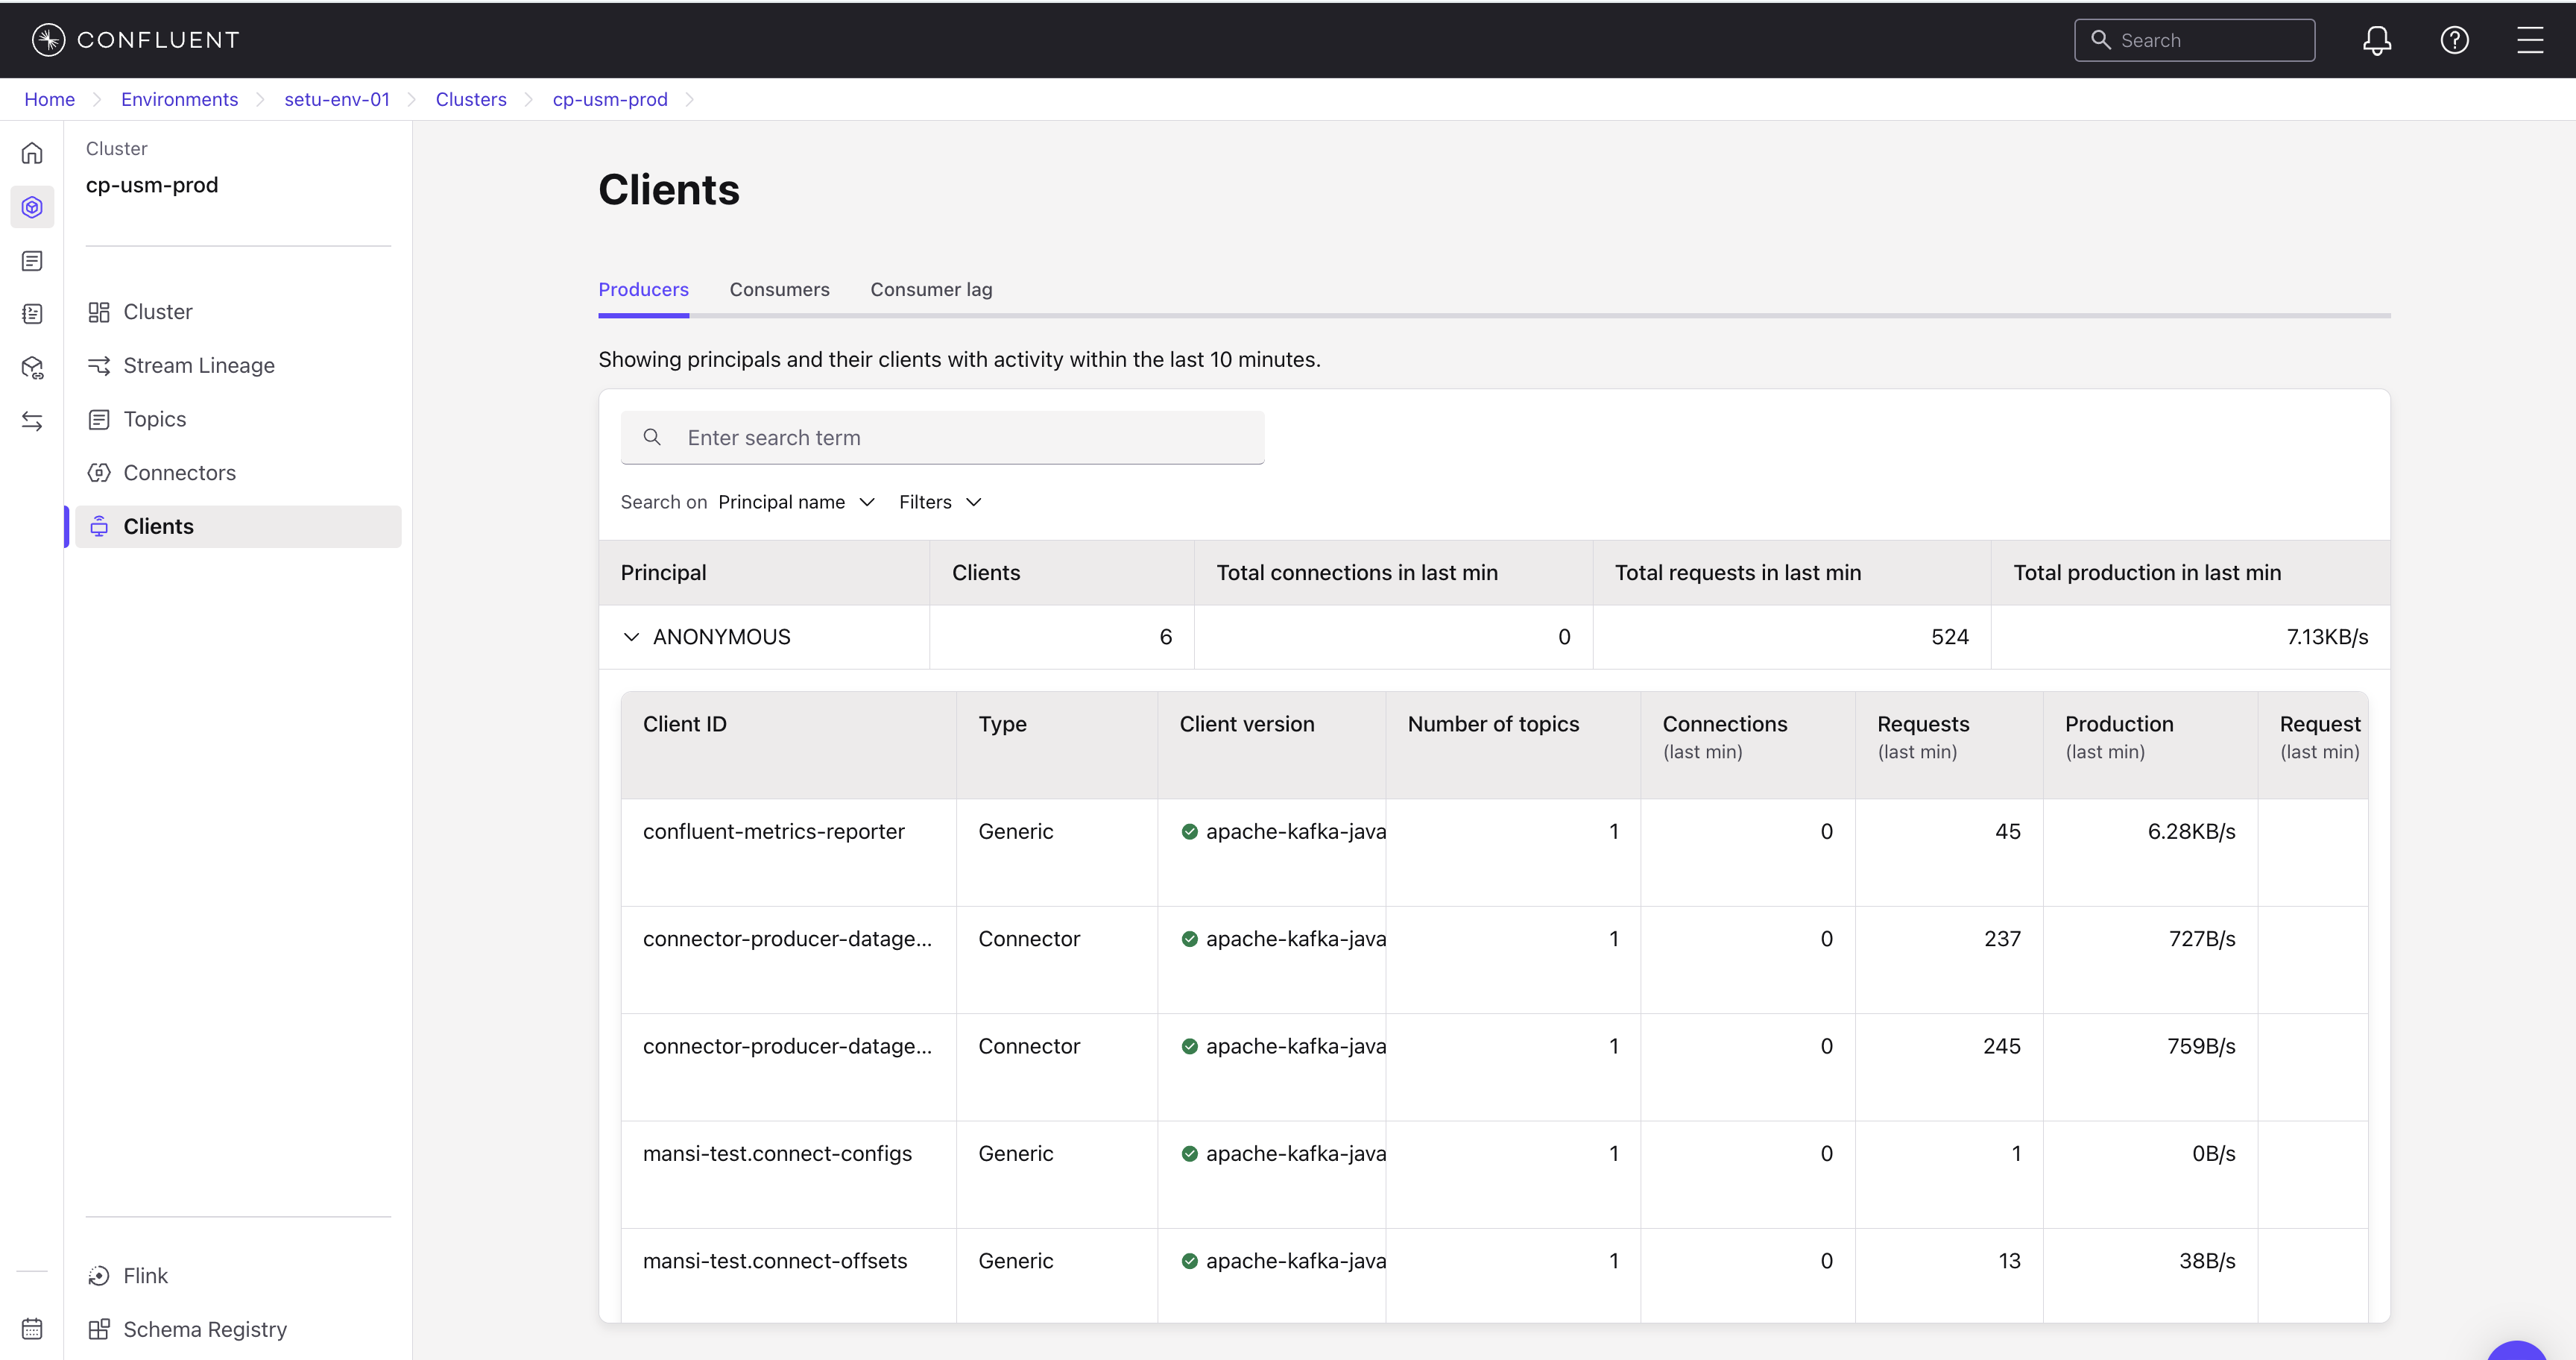
The Producers and Consumers tabs organize clients by principal. A principal is the authentication identifier a client uses to connect to the cluster. The page shows principals with activity in the last 10 minutes. Each row represents a principal with aggregated metrics across all its clients. Click a principal row to expand it and view metrics for individual clients.
Search and filter clients
Use the toolbar above the table to find specific clients:
Search: Enter a search term to find matching principals or clients.
Search on: Choose what to search by — Principal name or Client ID.
Filters: Click Filters to narrow the table by:
Unsupported clients only: Show only principals that have clients running unsupported versions.
Clients with traffic only: Show only principals whose clients have produced or consumed data.
The table loads the first page of results automatically. Scroll to the bottom to load additional results.
If a search term or filter yields no matches, the table shows a No producers found or No consumers found message. Clear the search or filters to return to the full list.
Principal-level columns
The following columns appear at the principal level on both the Producers and Consumers tabs:
Principal: The authentication identifier used by the client to connect to the cluster.
Clients: The number of active client instances under this principal.
Total connections in last min: The total number of connections established by all clients under this principal in the last minute.
Total requests in last min: The total number of requests sent by all clients under this principal in the last minute.
Total production in last min (Producers tab) or Total consumption in last min (Consumers tab): The total data produced or consumed by all clients under this principal in the last minute.
Per-client columns
Click a principal row to expand it and view the following columns for each individual client:
Client ID: The identifier of the individual client instance.
Type: The inferred client source. For example,
Generic,Connector, orStream.Client version: The version of the client library. A green dot indicates a supported version.
Number of topics: The number of topics the client is producing to or consuming from.
Connections (last min): The number of connections the client established in the last minute.
Requests (last min): The number of requests the client sent in the last minute.
Production (last min) (Producers tab) or Consumption (last min) (Consumers tab): The data produced or consumed by the client in the last minute.
Request latency (last min): The average request latency for the client in the last minute.
Note
After you enable client monitoring on the cluster, supported clients push metrics automatically. To disable metric collection on a specific client, set the client configuration enable.metrics.push to false.
Python clients do not support all standard KIP-714 metrics. Most metric columns appear blank for Python clients.
Monitor unsupported client versions
On the Clients page, you can identify principals that contain clients running unsupported or outdated versions:
A yellow warning icon marks principals that contain clients running unsupported versions.
Click the expand arrow next to a principal to view its individual clients.
In the Client version column, a green dot indicates a supported version. A yellow dot indicates an unsupported version.
Some clients report
Unknownas the version because they do not emit the ApiVersion metric.
To address unsupported versions, share the principal identifier with the relevant application team and ask them to upgrade the client.