
Monitor a Confluent Platform Cluster in Confluent Cloud
USM displays key metrics for registered Confluent Platform clusters directly in the Confluent Cloud Console. The Unified Stream Manager (USM) Agent collects telemetry data from your Confluent Platform deployment and sends it to Confluent Cloud.
Select a cluster to open a detailed dashboard with its identification, metrics, lineage, and configuration.
View the cluster page
To view the details for your Confluent Platform cluster, follow these steps:
In the Confluent Cloud Console, navigate to the Environments page and select your environment.
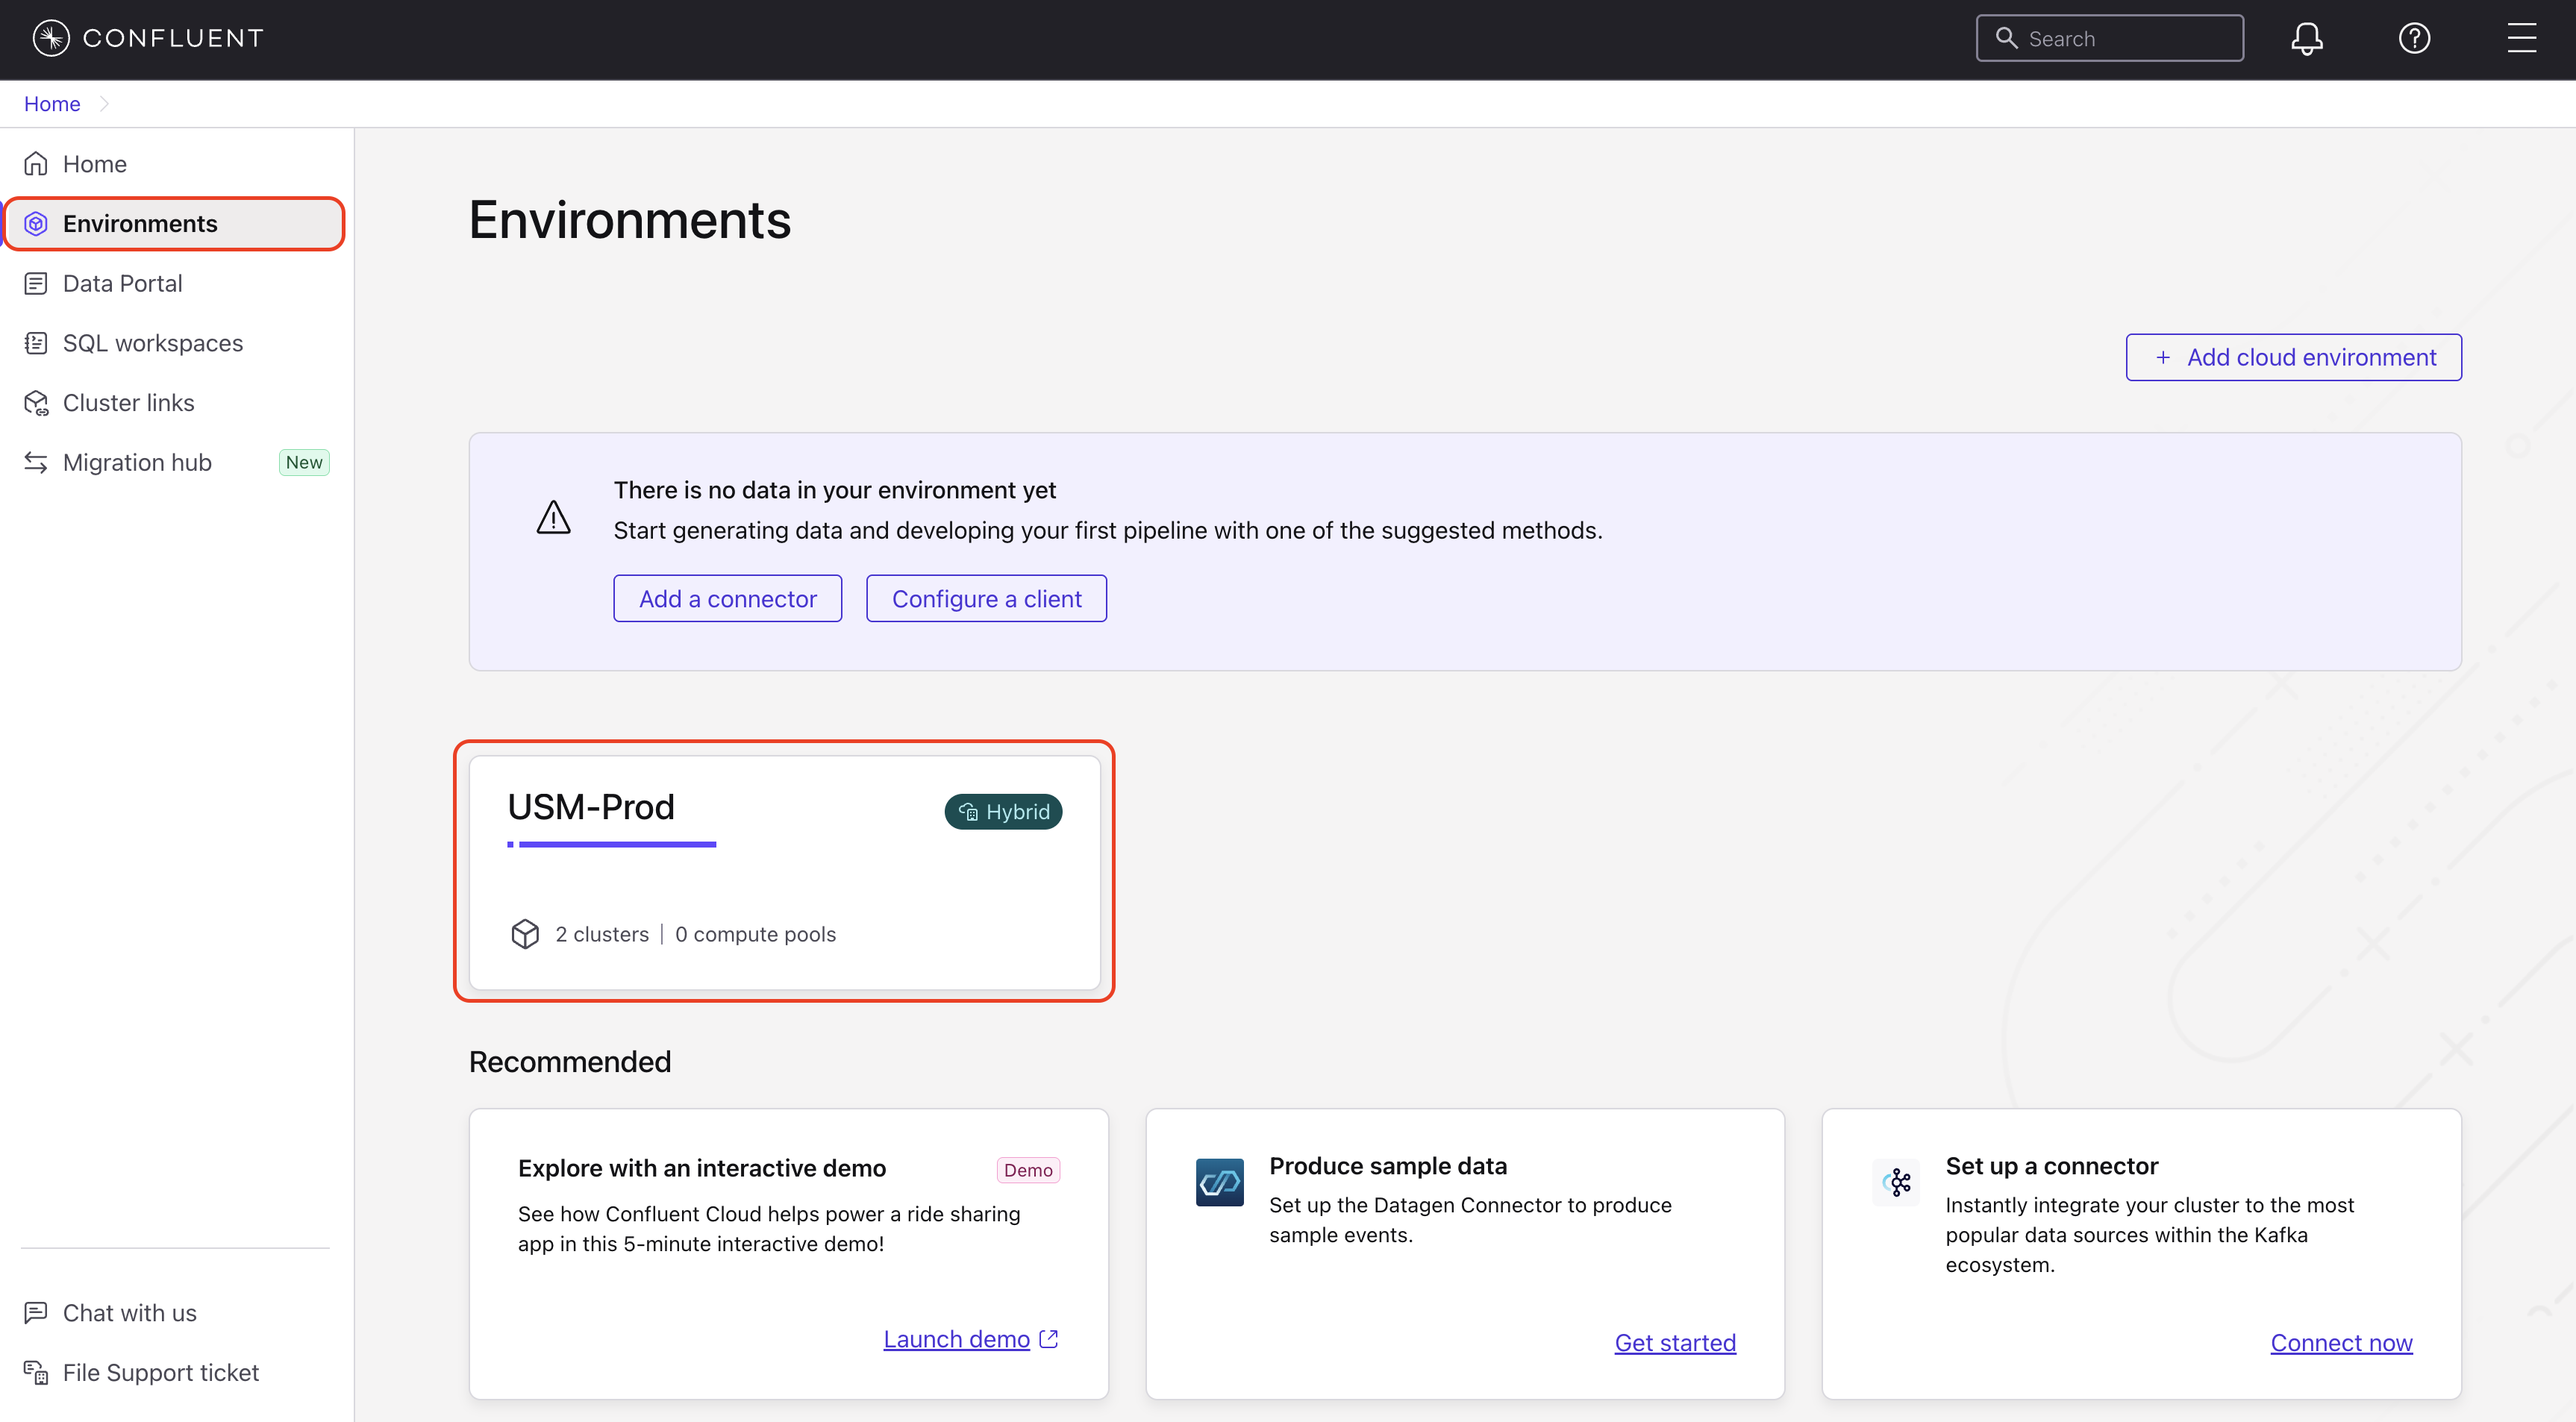
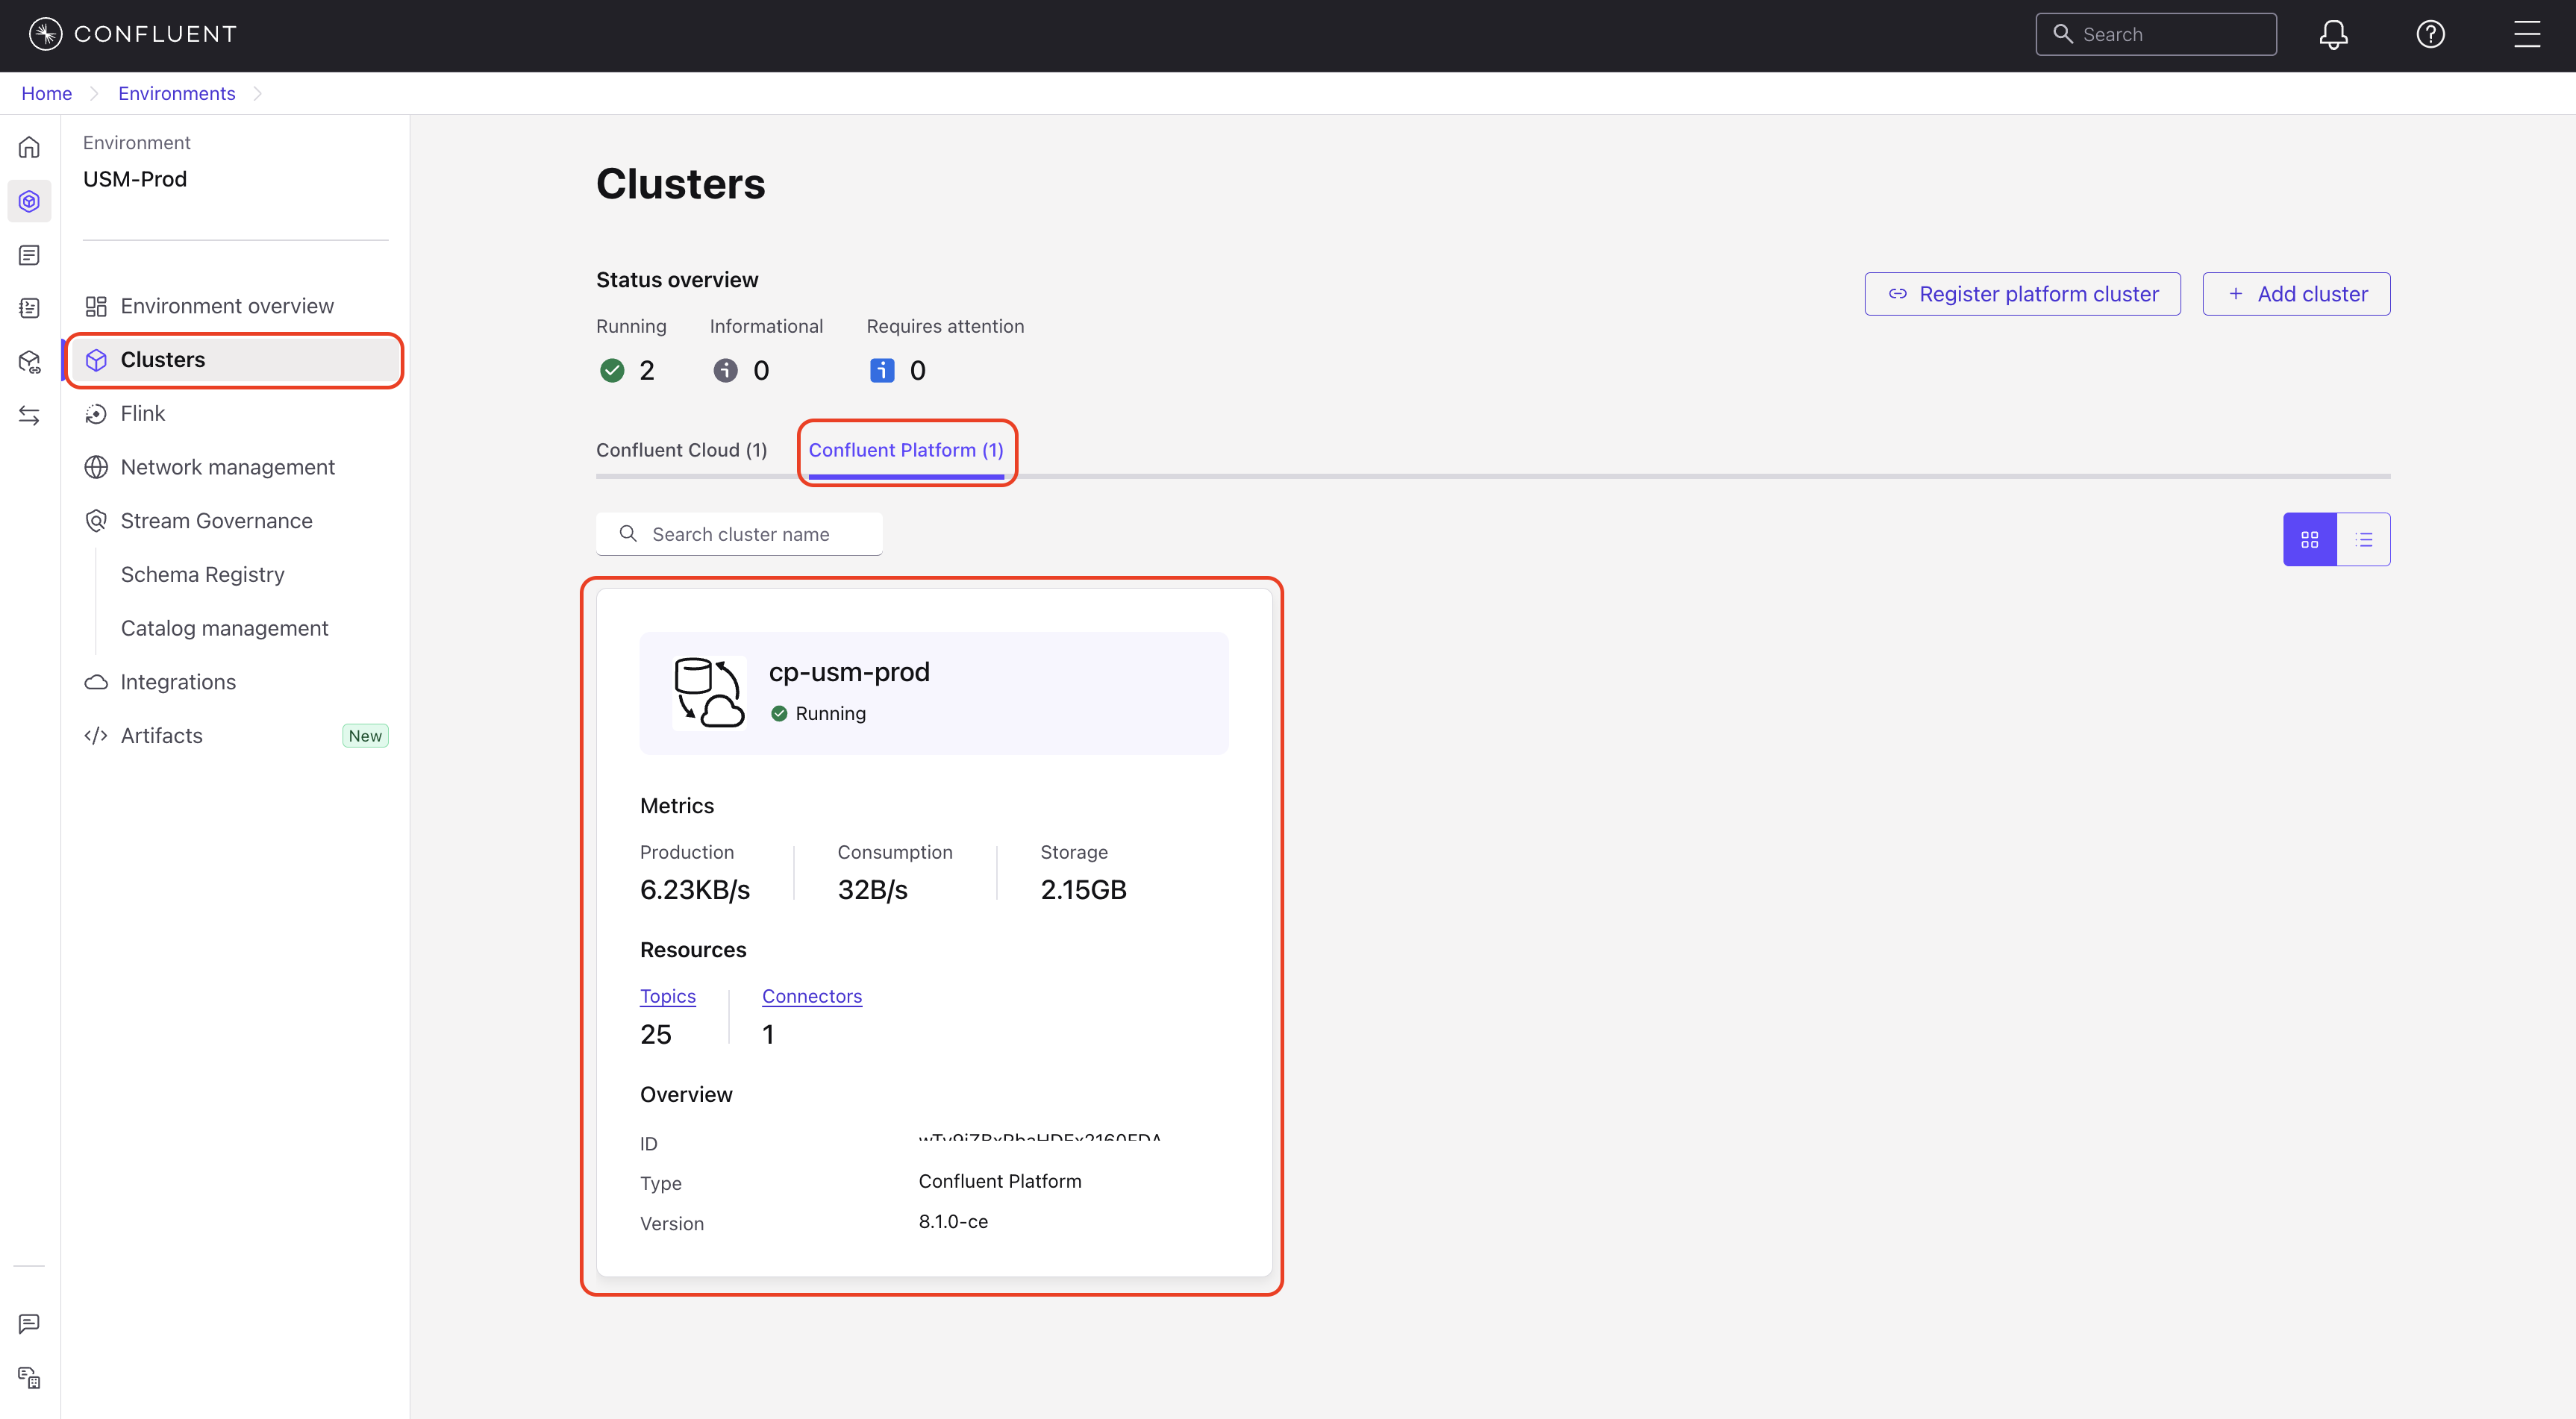
In the navigation menu, click Clusters and select your Confluent Platform cluster.
This opens a detailed view with five tabs: Overview, Monitor, Brokers, Settings, and Details. The Overview tab is displayed by default.
Overview tab
The Overview tab provides a high-level summary of the cluster’s identification, throughput, and lineage.
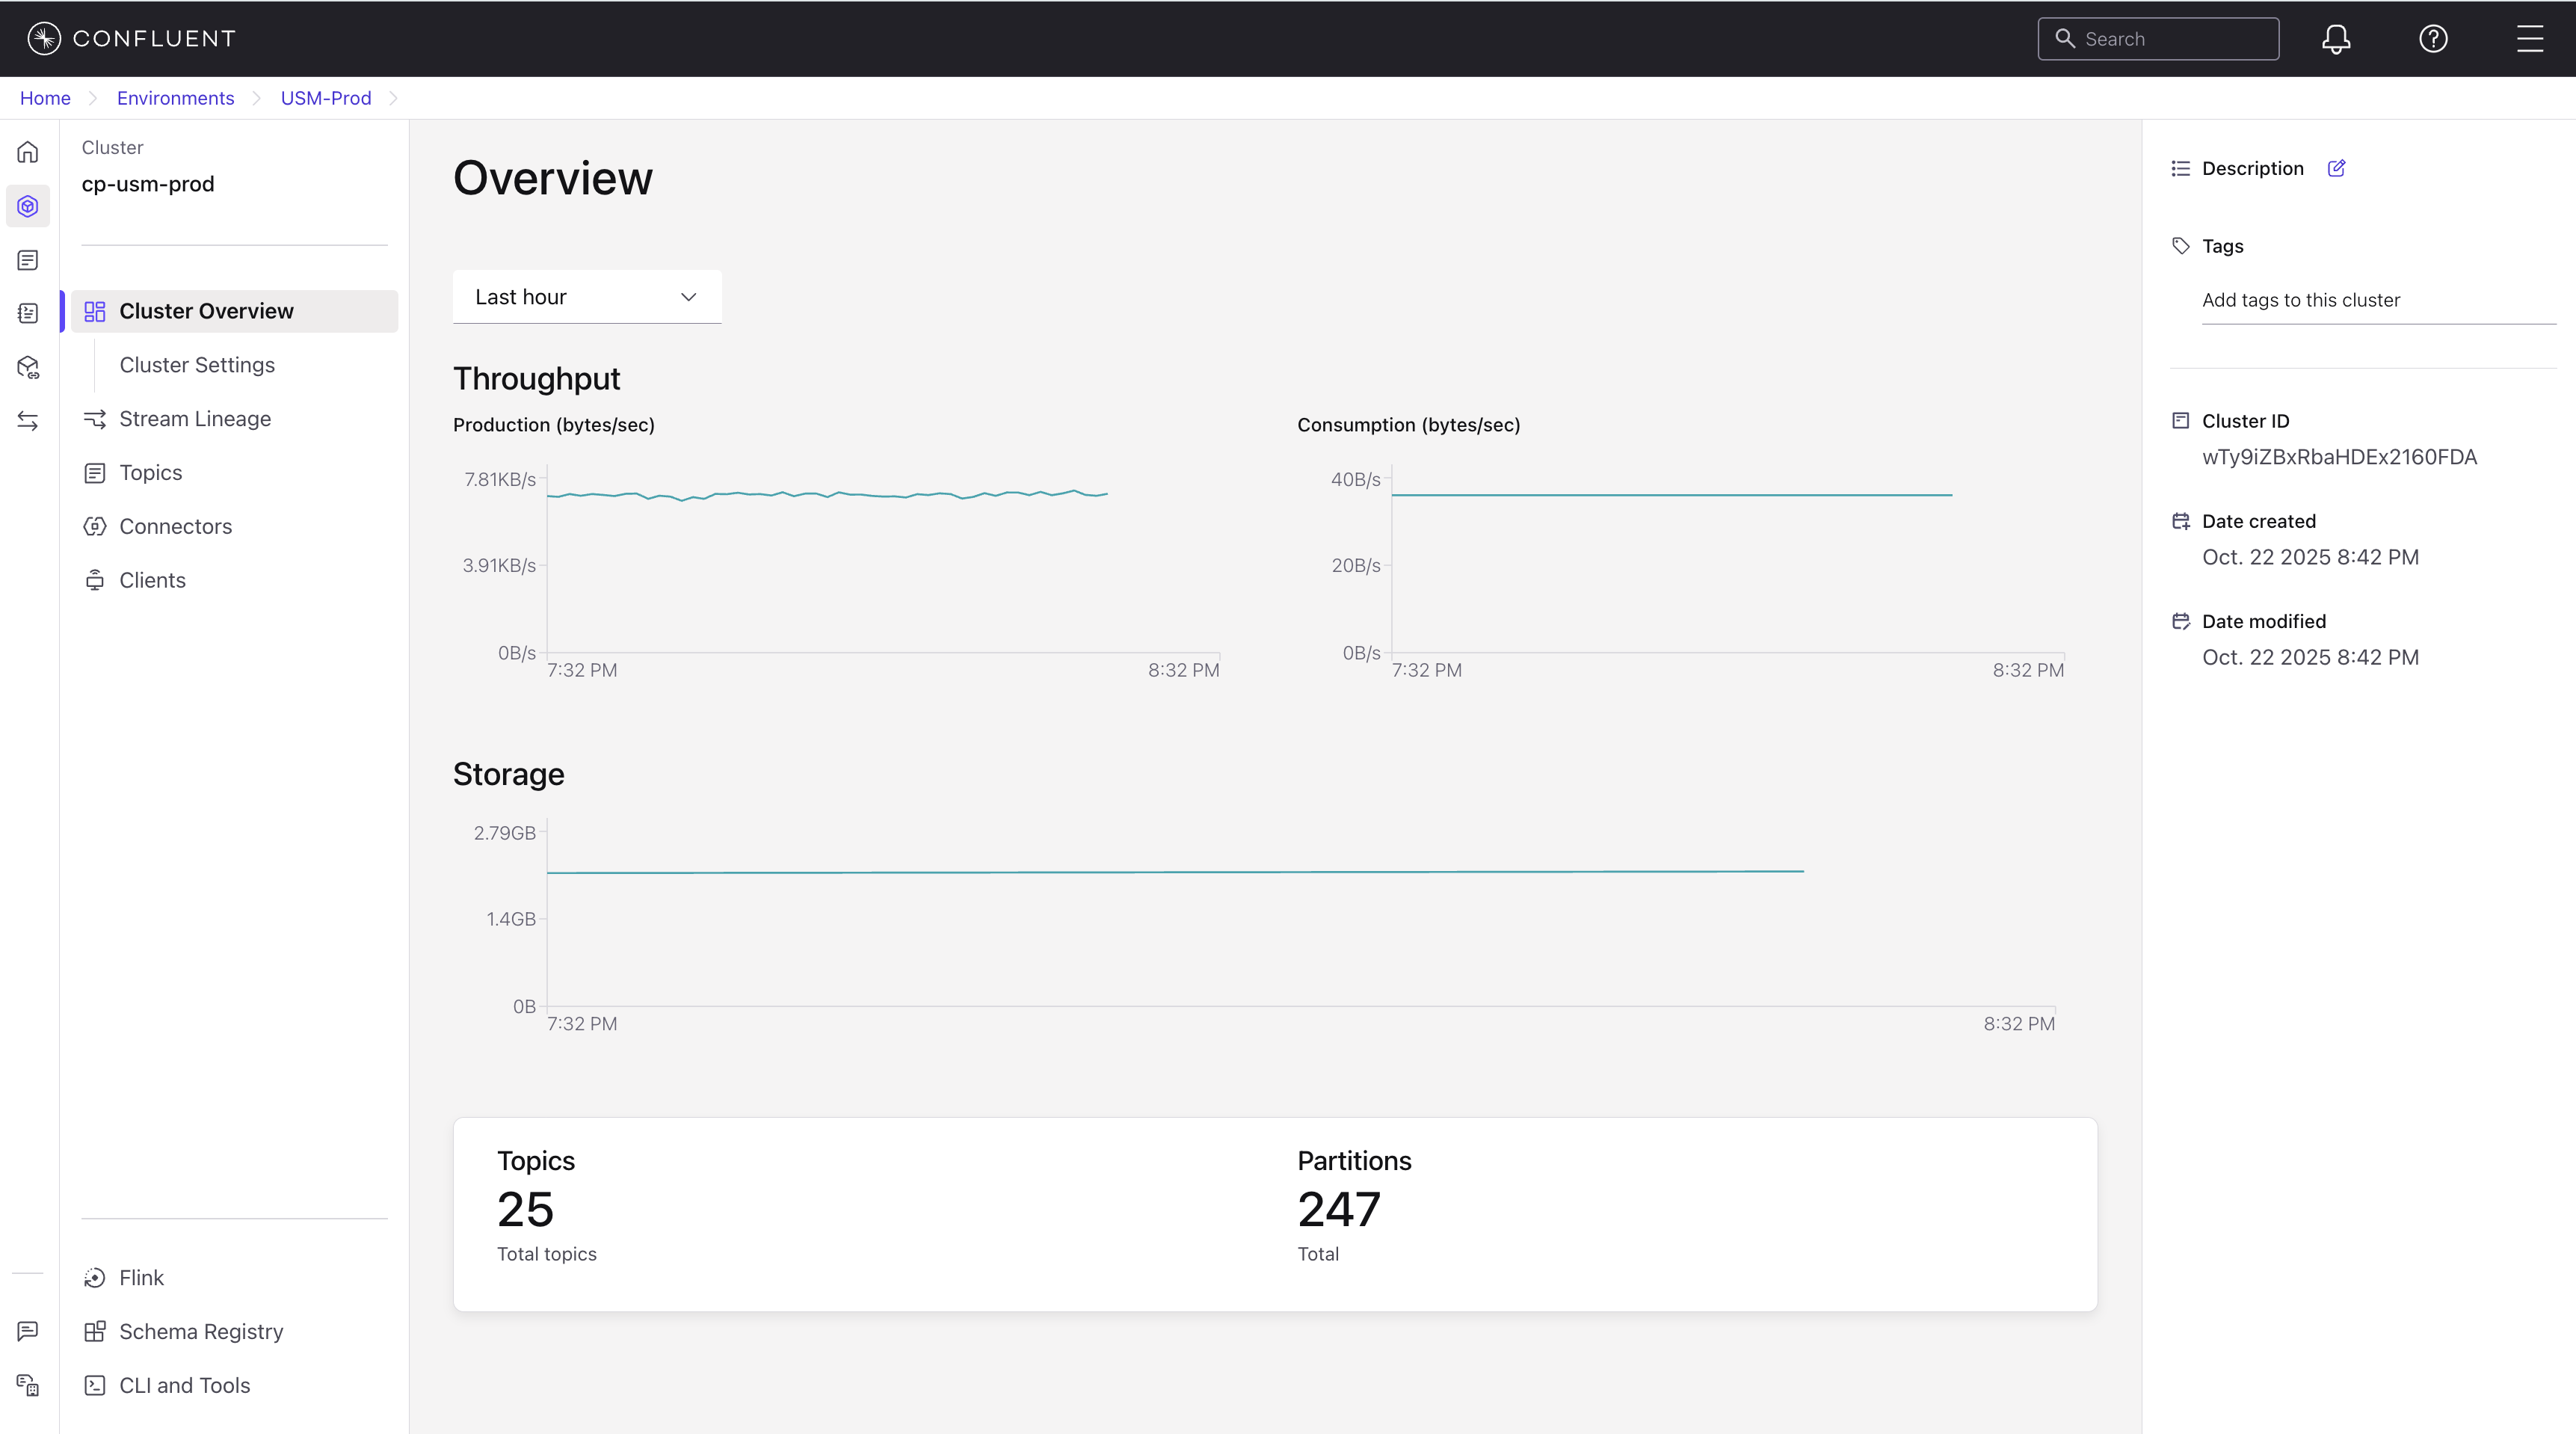
The tab displays the following information:
ID: The unique identifier for the cluster.
Environment: The Confluent Cloud environment where the cluster is registered.
ZooKeeper connected: The connectivity status between the cluster and ZooKeeper, shown only for ZooKeeper-based Confluent Platform clusters. Valid values are
Yes,No, orUnknown.Yes: No ZooKeeper disconnections occurred within the metrics window.
No: ZooKeeper disconnections occurred within the metrics window.
Unknown: Confluent Cloud cannot determine the connectivity status, such as when metrics data is unavailable or delayed.
This field doesn’t appear for clusters that run in KRaft mode. The ZooKeeper connectivity status operates independently of the health status of the cluster.
Production: The current rate of data written to the cluster (bytes/sec).
Consumption: The current rate of data read from the cluster (bytes/sec).
Storage: The total disk space used by the brokers in the cluster.
Topics: The total number of topics in the cluster.
Partitions: The total number of partitions across all topics in the cluster. The number of partitions directly impacts the parallelism and throughput capacity of your topics.
The Overview tab also includes a Stream Lineage visualization that shows the data flow through the cluster, and a preview of the cluster’s throughput over time. Click View full lineage to open the complete lineage diagram, or click View all metrics to open the Monitor tab. For more information, see Track Data with Stream Lineage on Confluent Cloud.
Monitor tab
The Monitor tab provides historical metrics for message flow and connector activity in the cluster. The data displayed corresponds to the time range that you select from the dropdown menu.
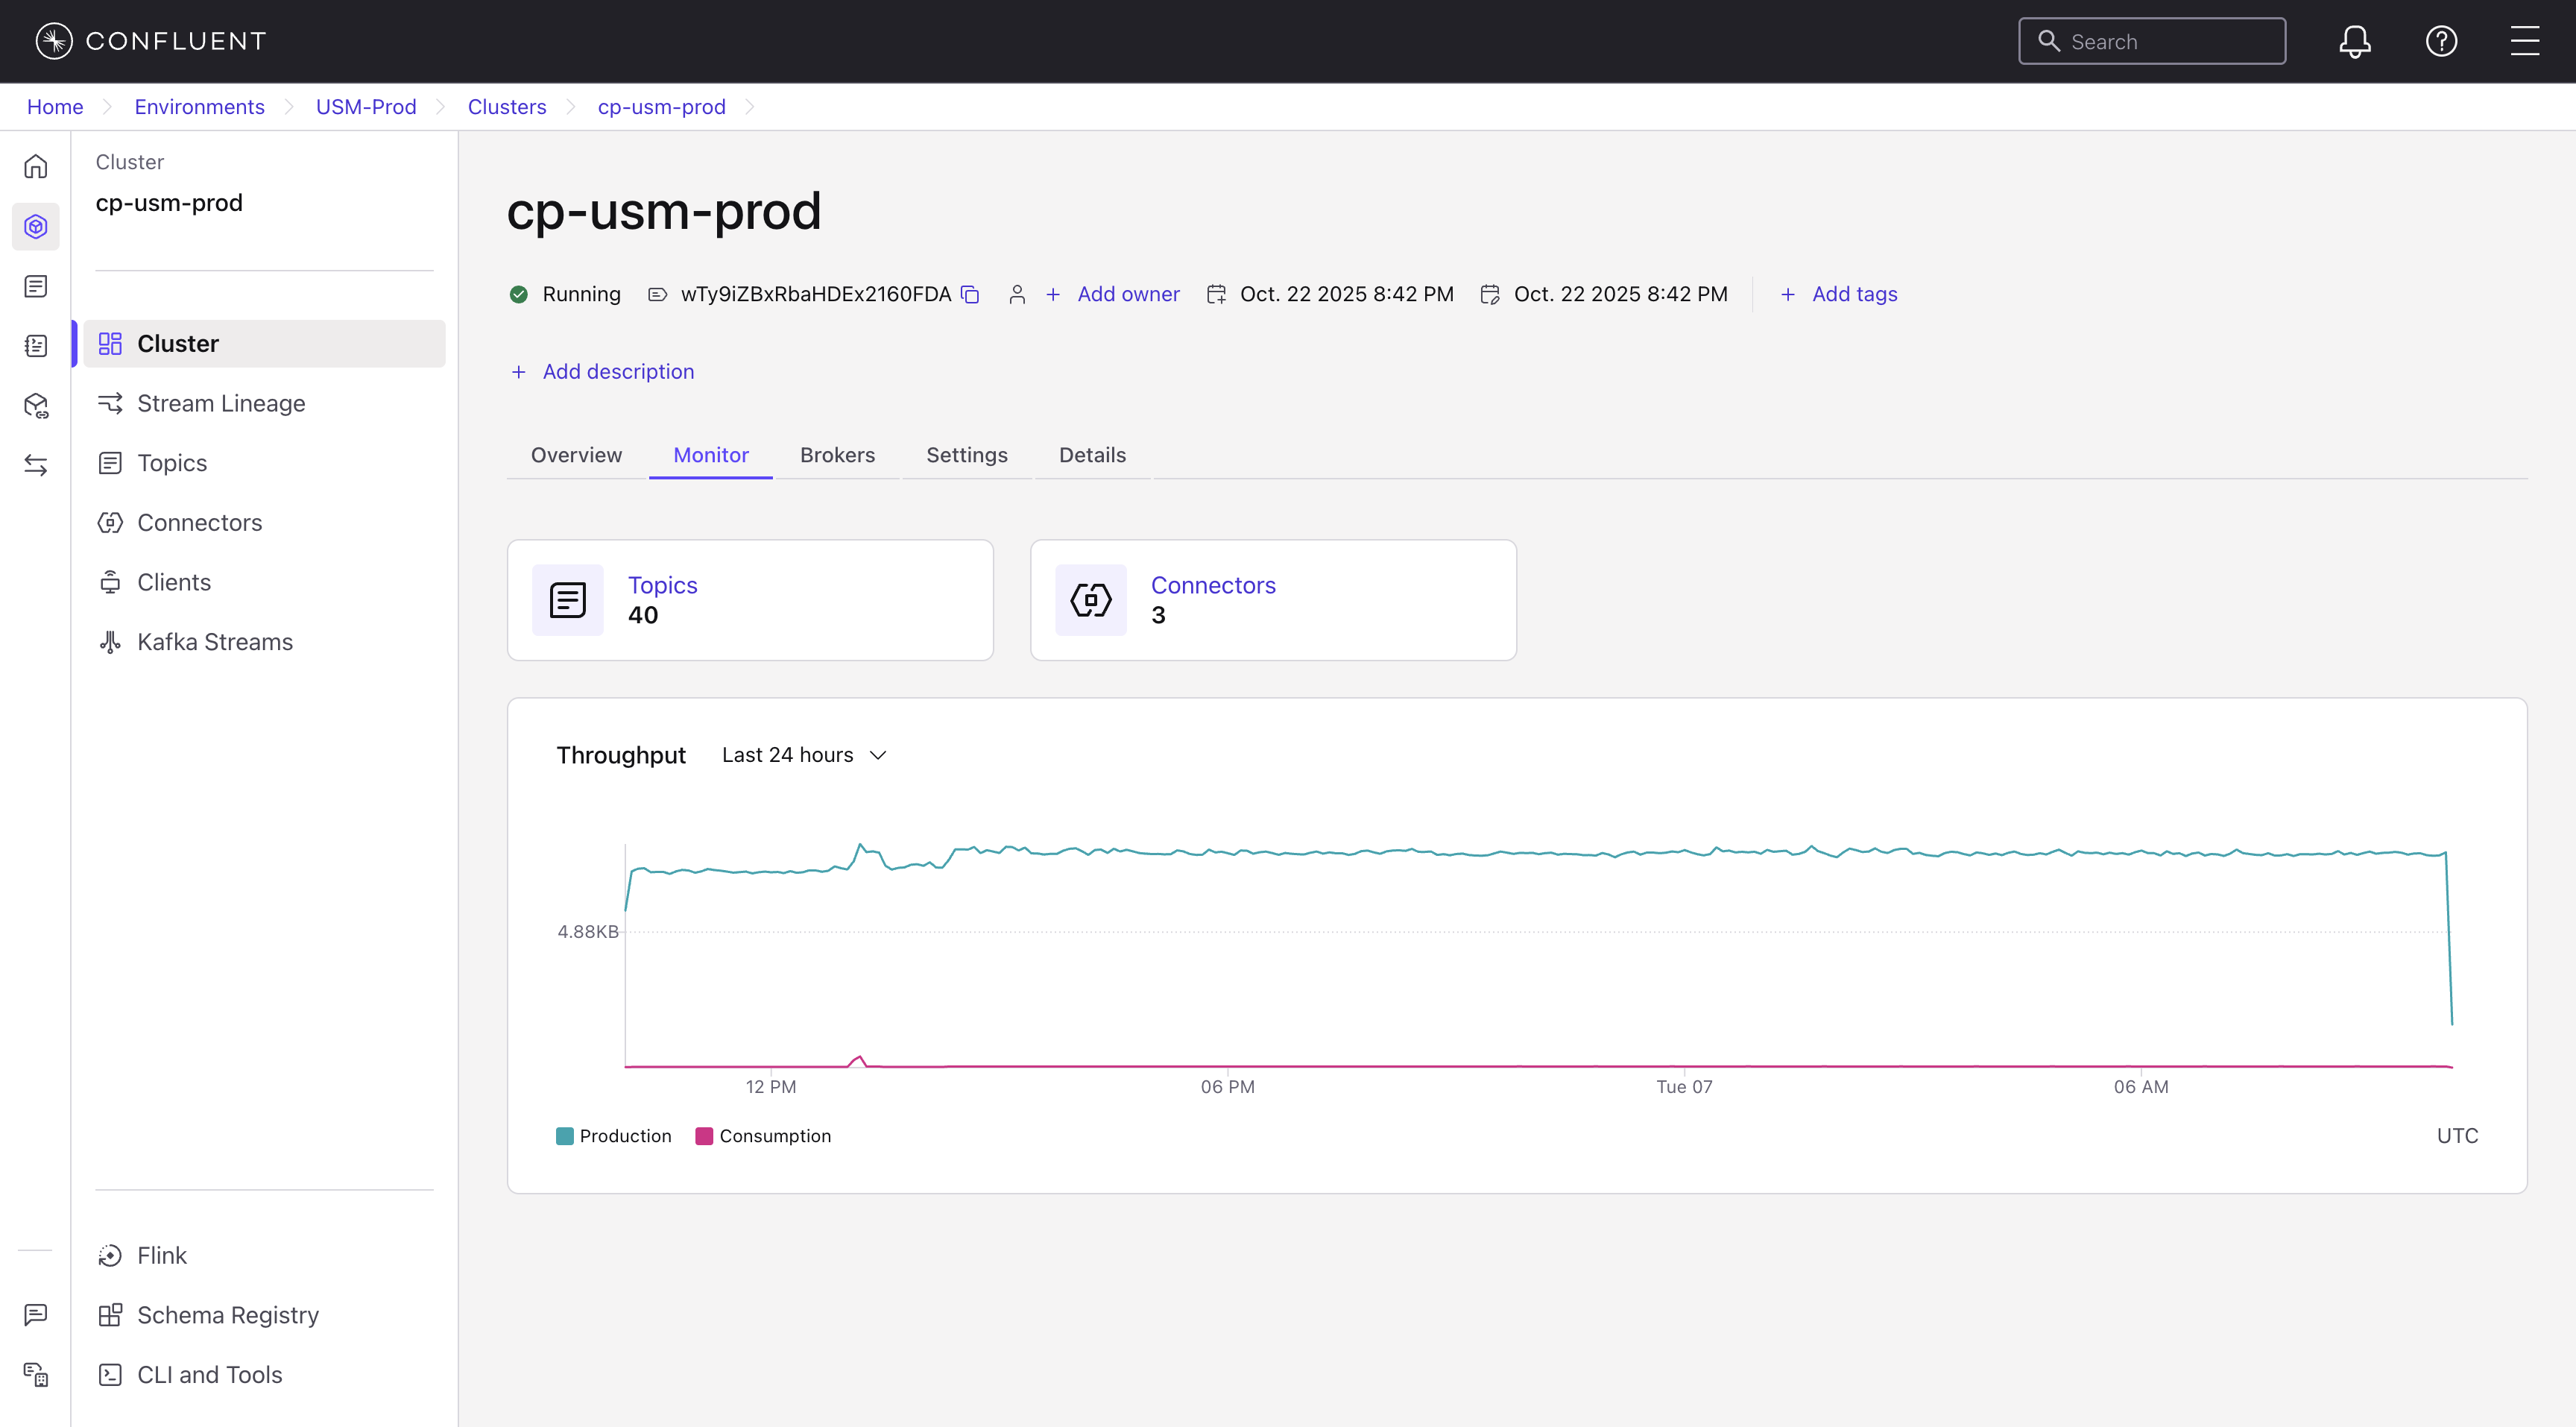
Topics: The total number of topics in the cluster.
Connectors: The total number of connectors registered to the cluster. Click the count to open the Connectors page.
Throughput: This graph shows the historical flow of data into and out of the cluster.
Production: The rate at which producers write data into the cluster’s brokers.
Consumption: The rate at which consumers read data from the cluster’s brokers.
Brokers tab
The Brokers tab provides a detailed view of the health and performance of the individual Kafka brokers in your Confluent Platform cluster. You can use these metrics to troubleshoot issues and identify performance bottlenecks.
This tab contains a cluster-wide summary and a detailed, per-broker table.
Cluster-wide broker metrics
The top of the tab displays a Broker Throughput graph and a series of panels that show aggregated metrics from across the entire cluster.
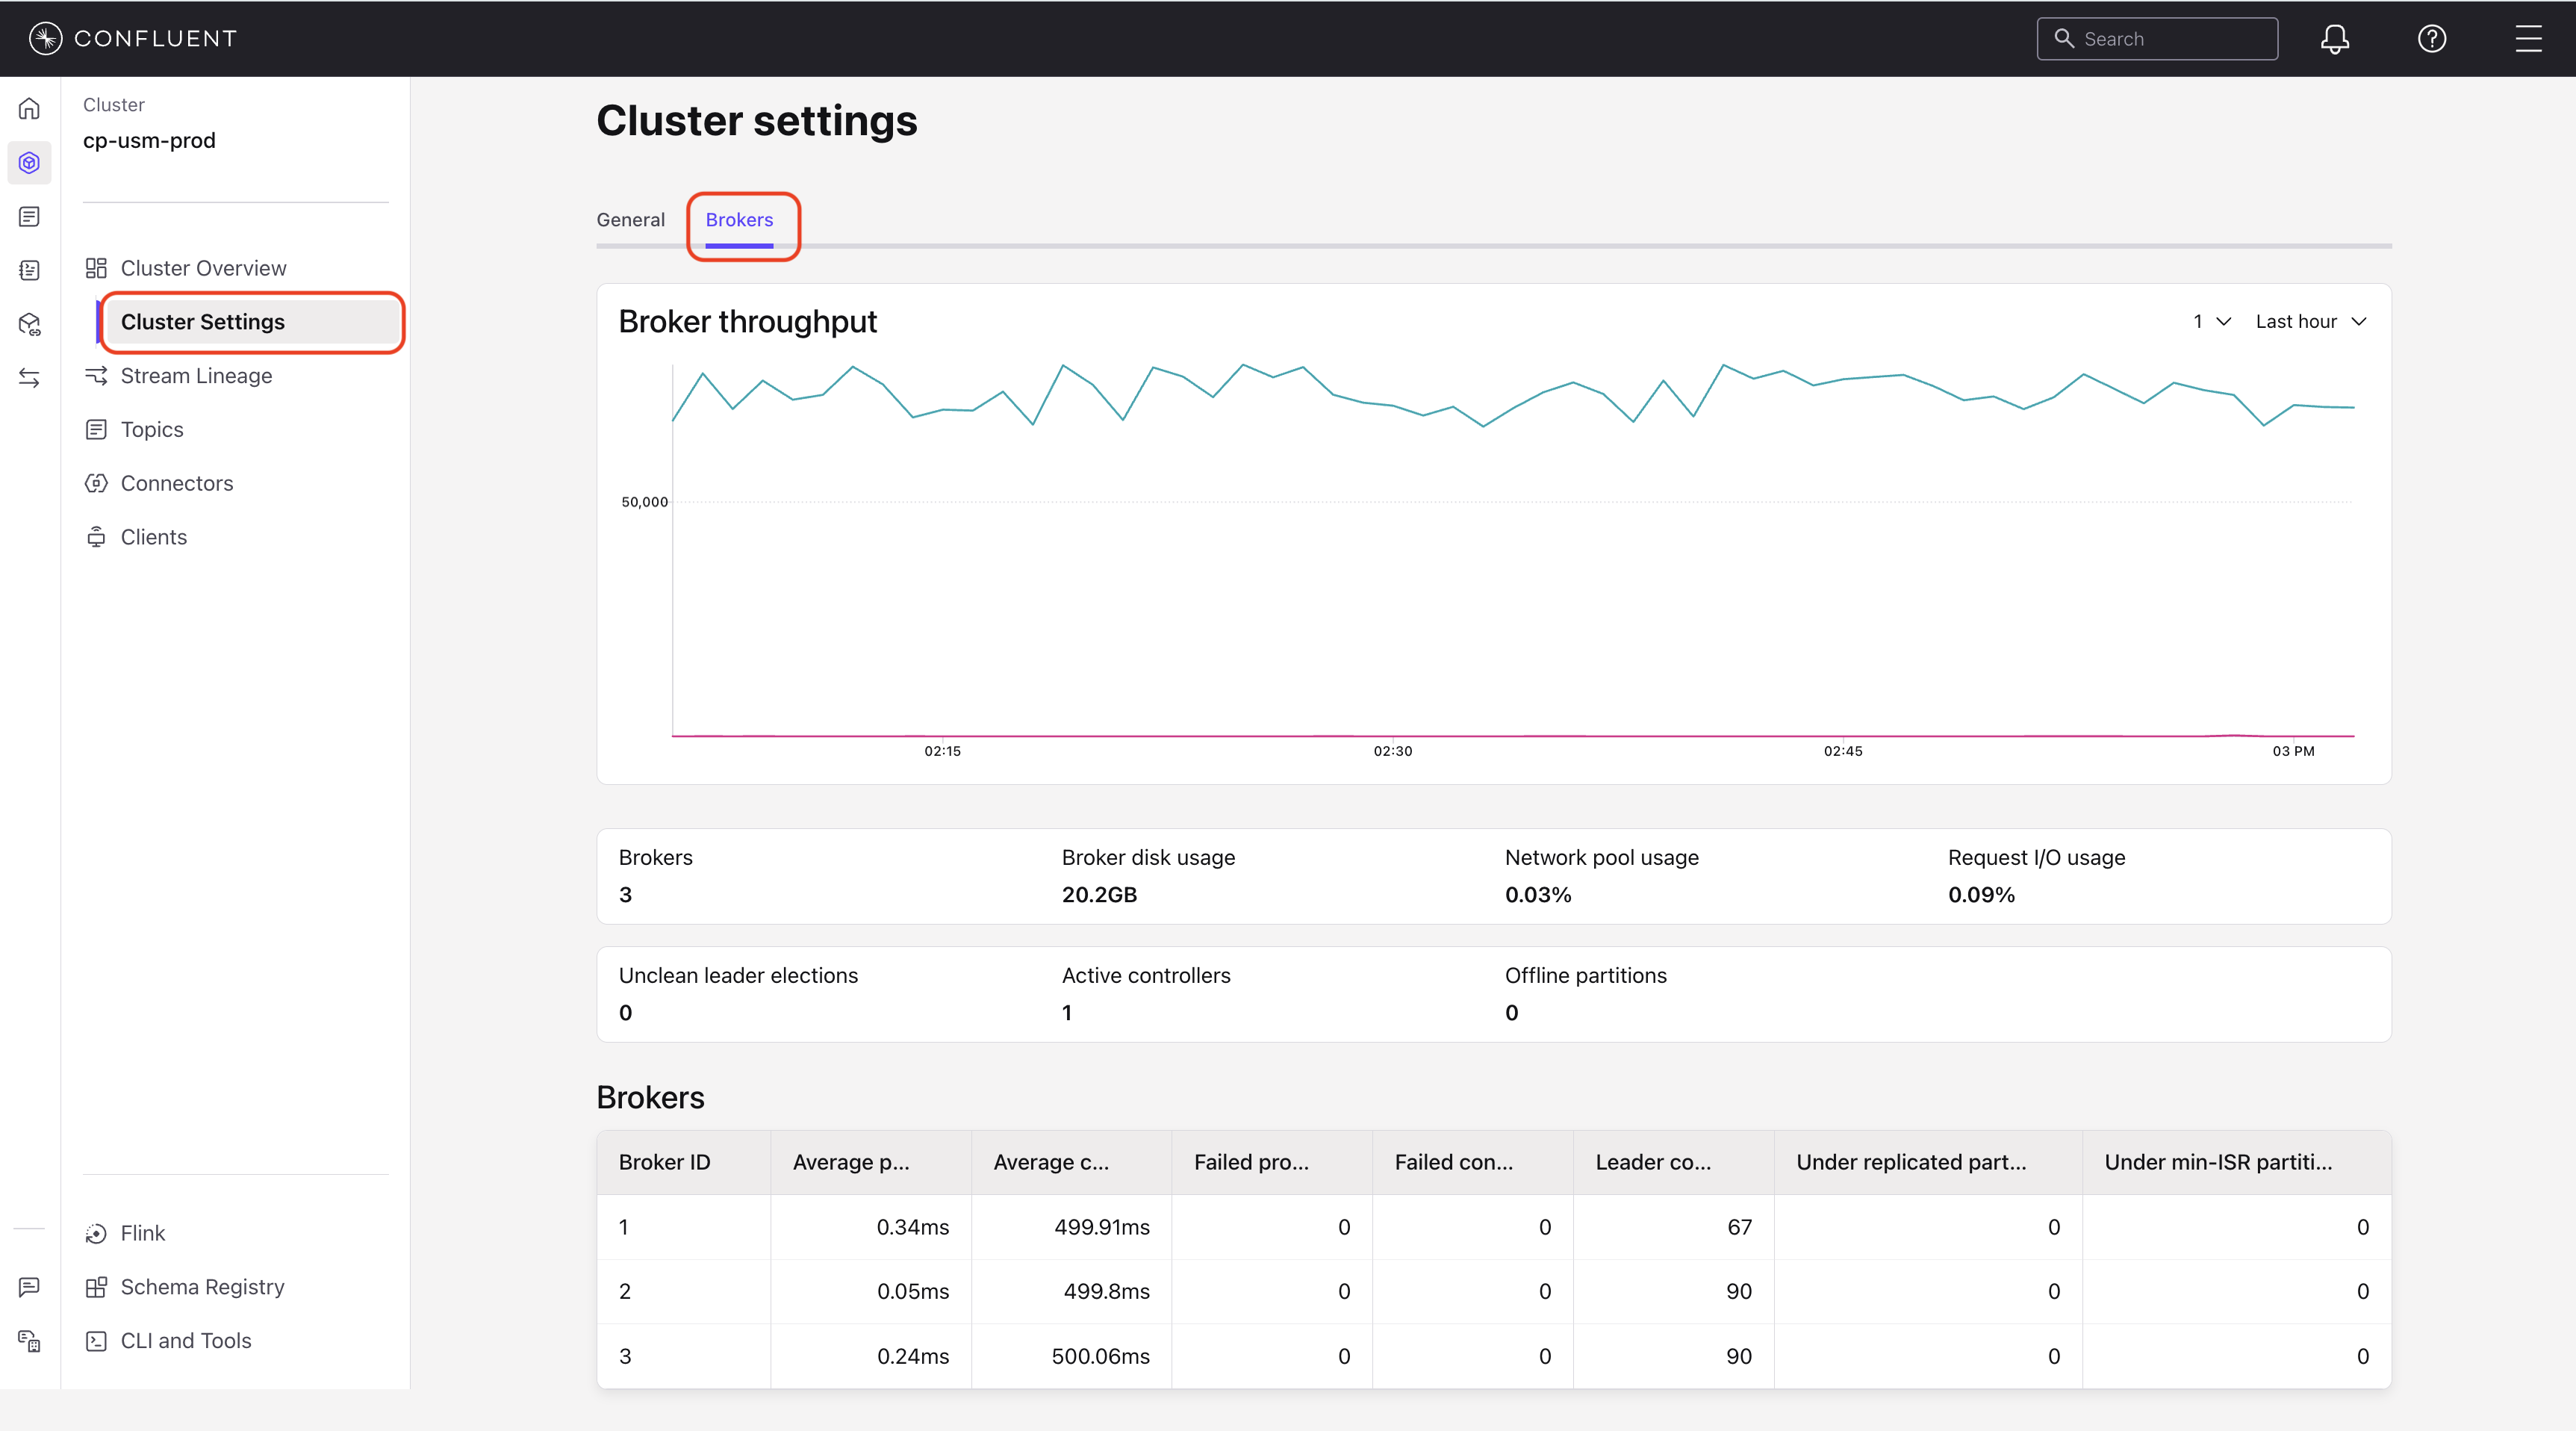
Broker Throughput: A graph that shows the combined throughput—Bytes In and Bytes Out—for all brokers.
Brokers: The total number of active brokers in your cluster.
Broker disk usage: The total disk space used by Kafka data across all brokers.
Network pool usage: The percentage of network threads used to handle client requests. High usage can indicate a network bottleneck.
Request I/O usage: The percentage of I/O threads used to process disk reads and writes. High usage can indicate a disk bottleneck.
Unclean leader elections: A count of leader elections where a replica that was not fully in-sync was elected as the new leader. This event indicates that topic availability was prioritized over data consistency and can result in data loss.
Active controllers: The number of brokers acting as the cluster controller.
Offline partitions: The total number of partitions that do not have an active leader. These partitions are unavailable for reads and writes.
Per-broker metrics table
The Brokers table provides granular metrics for each node. You can use these metrics to compare performance and diagnose issues for a specific broker.
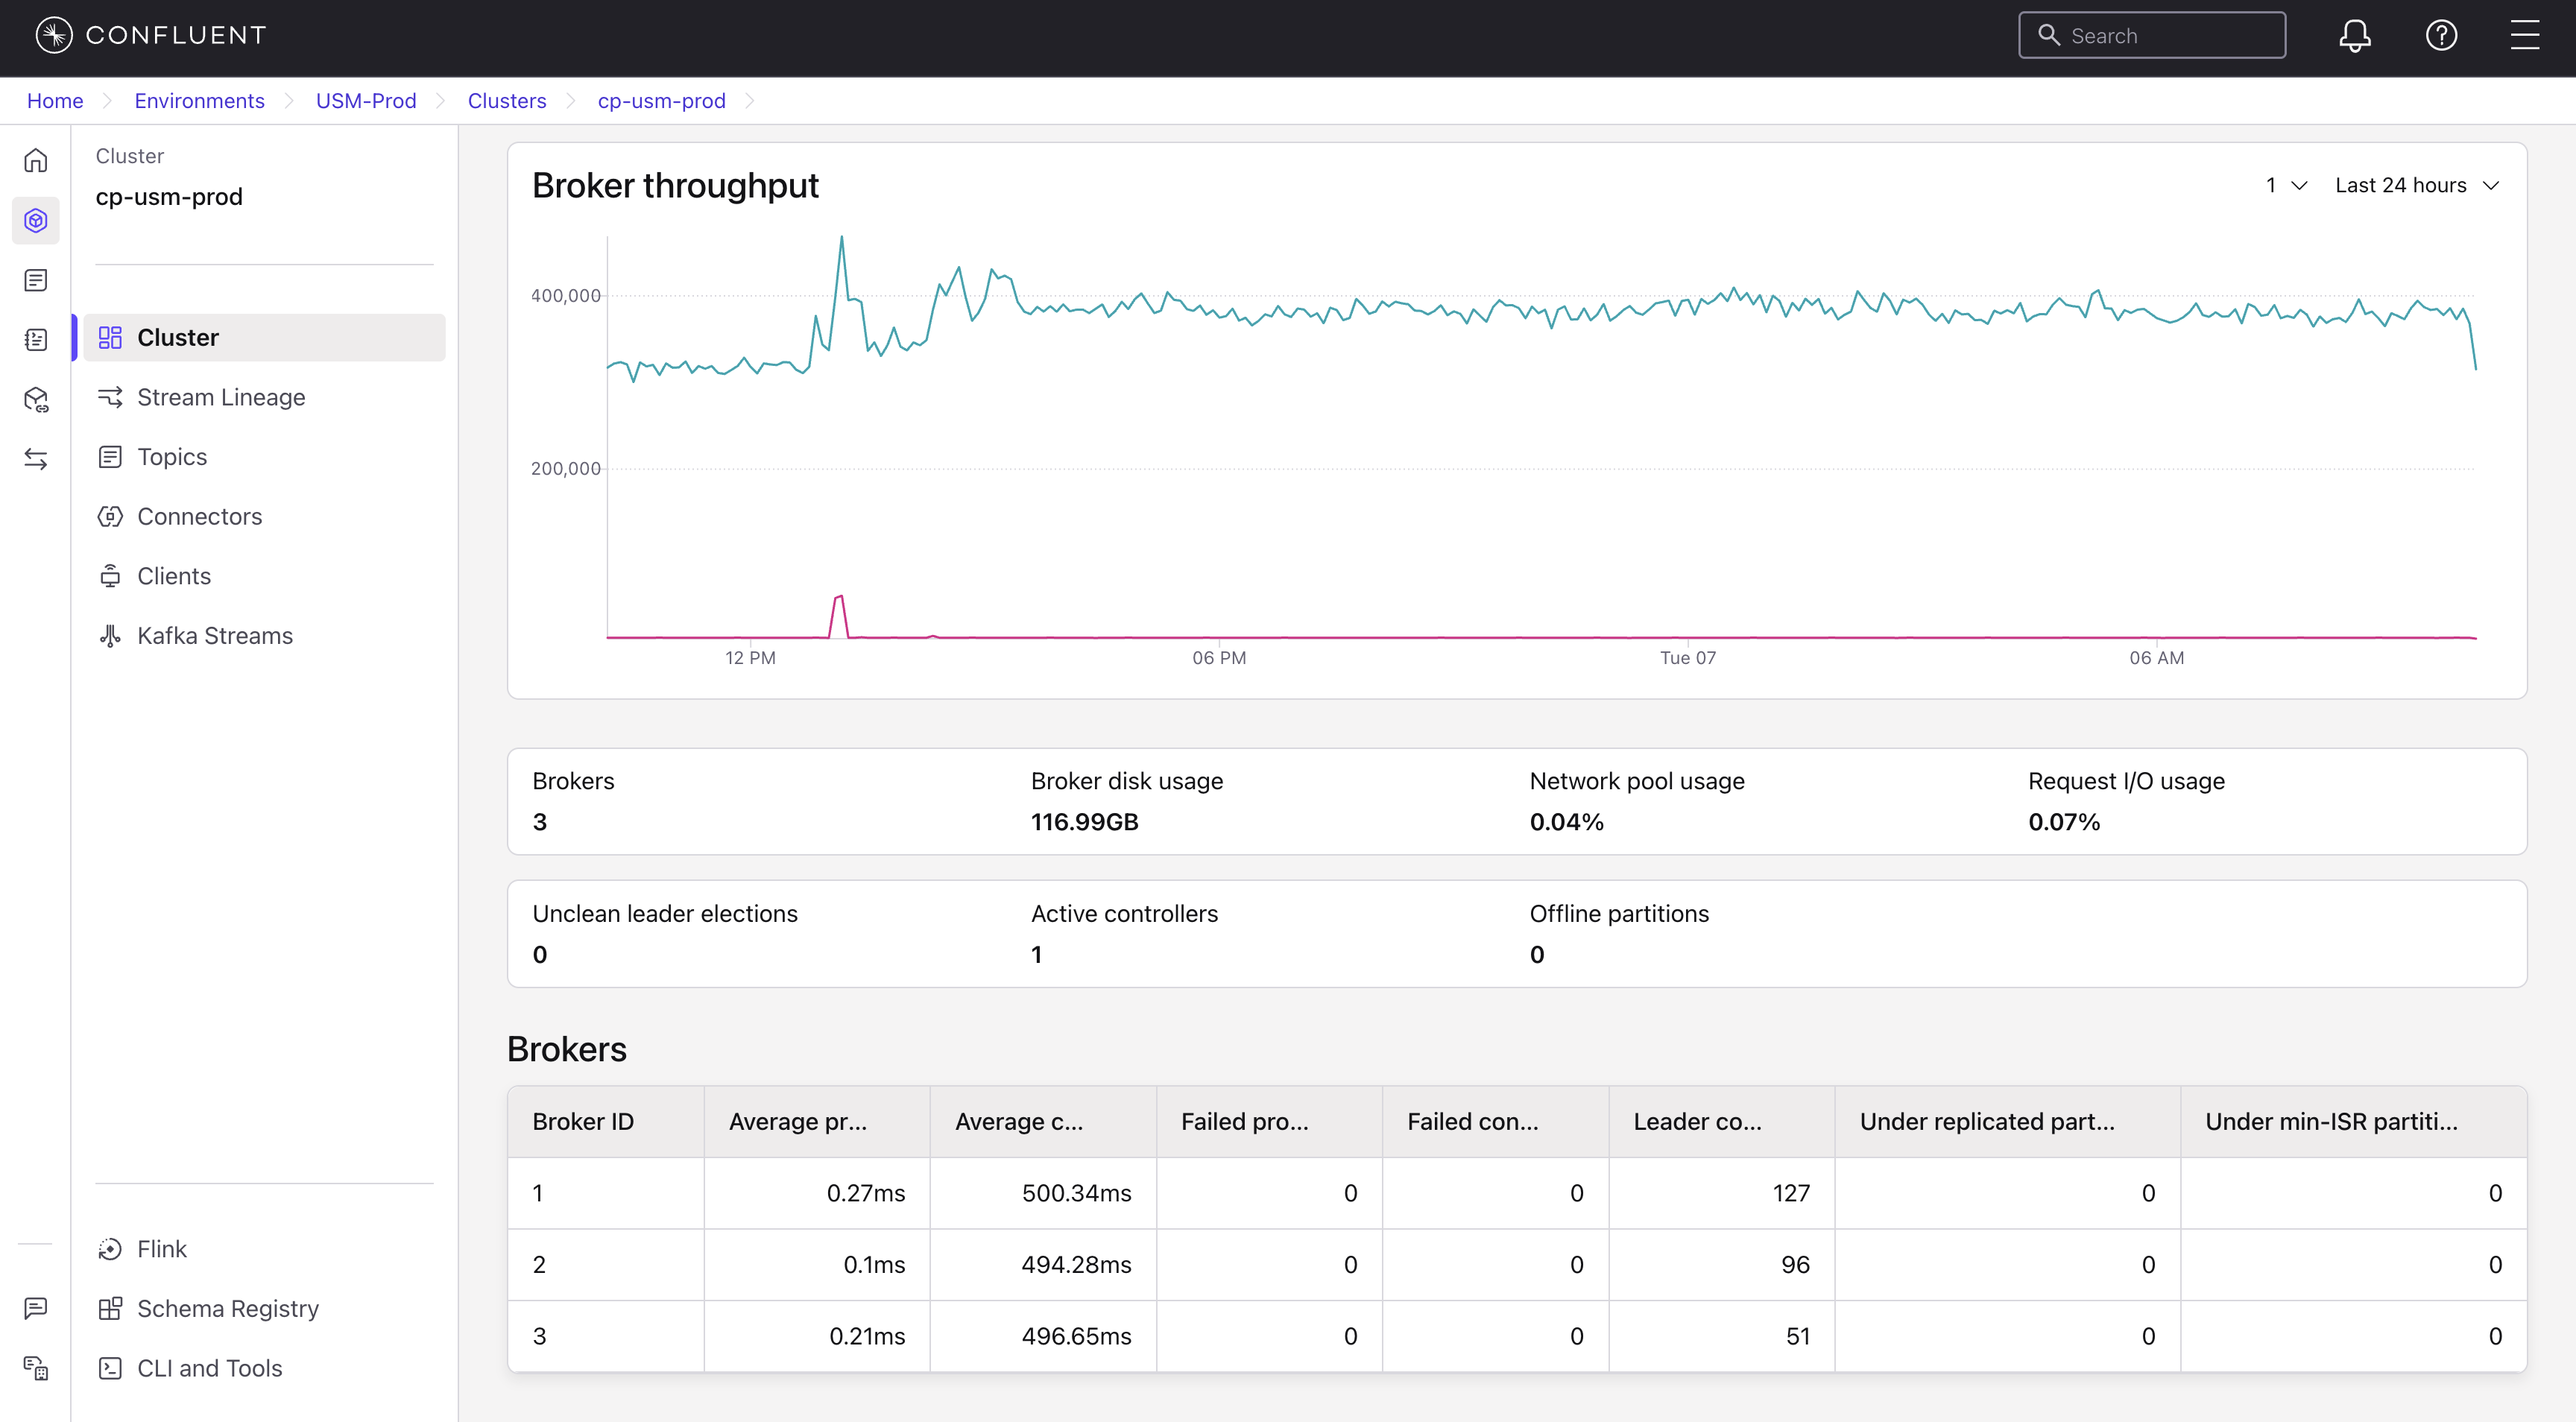
Broker ID: The unique identifier for the broker.
Average produce latency: The average time, in milliseconds, for the broker to process a produce request.
Average consume latency: The average time, in milliseconds, for the broker to process a consume request.
Failed produce/consume requests: The number of failed requests from producers or consumers.
Leader count: The number of partitions for which this broker is the current leader.
Under replicated partitions: The number of partitions on this broker that are missing replicas. This indicates a problem with data durability.
Under min-ISR partitions: The number of partitions where the current number of in-sync replicas is below the configured minimum.
Settings tab
The Settings tab displays read-only identification details for your connected Confluent Platform cluster. This information is synchronized from your self-managed environment and can’t be modified from the Confluent Cloud Console.
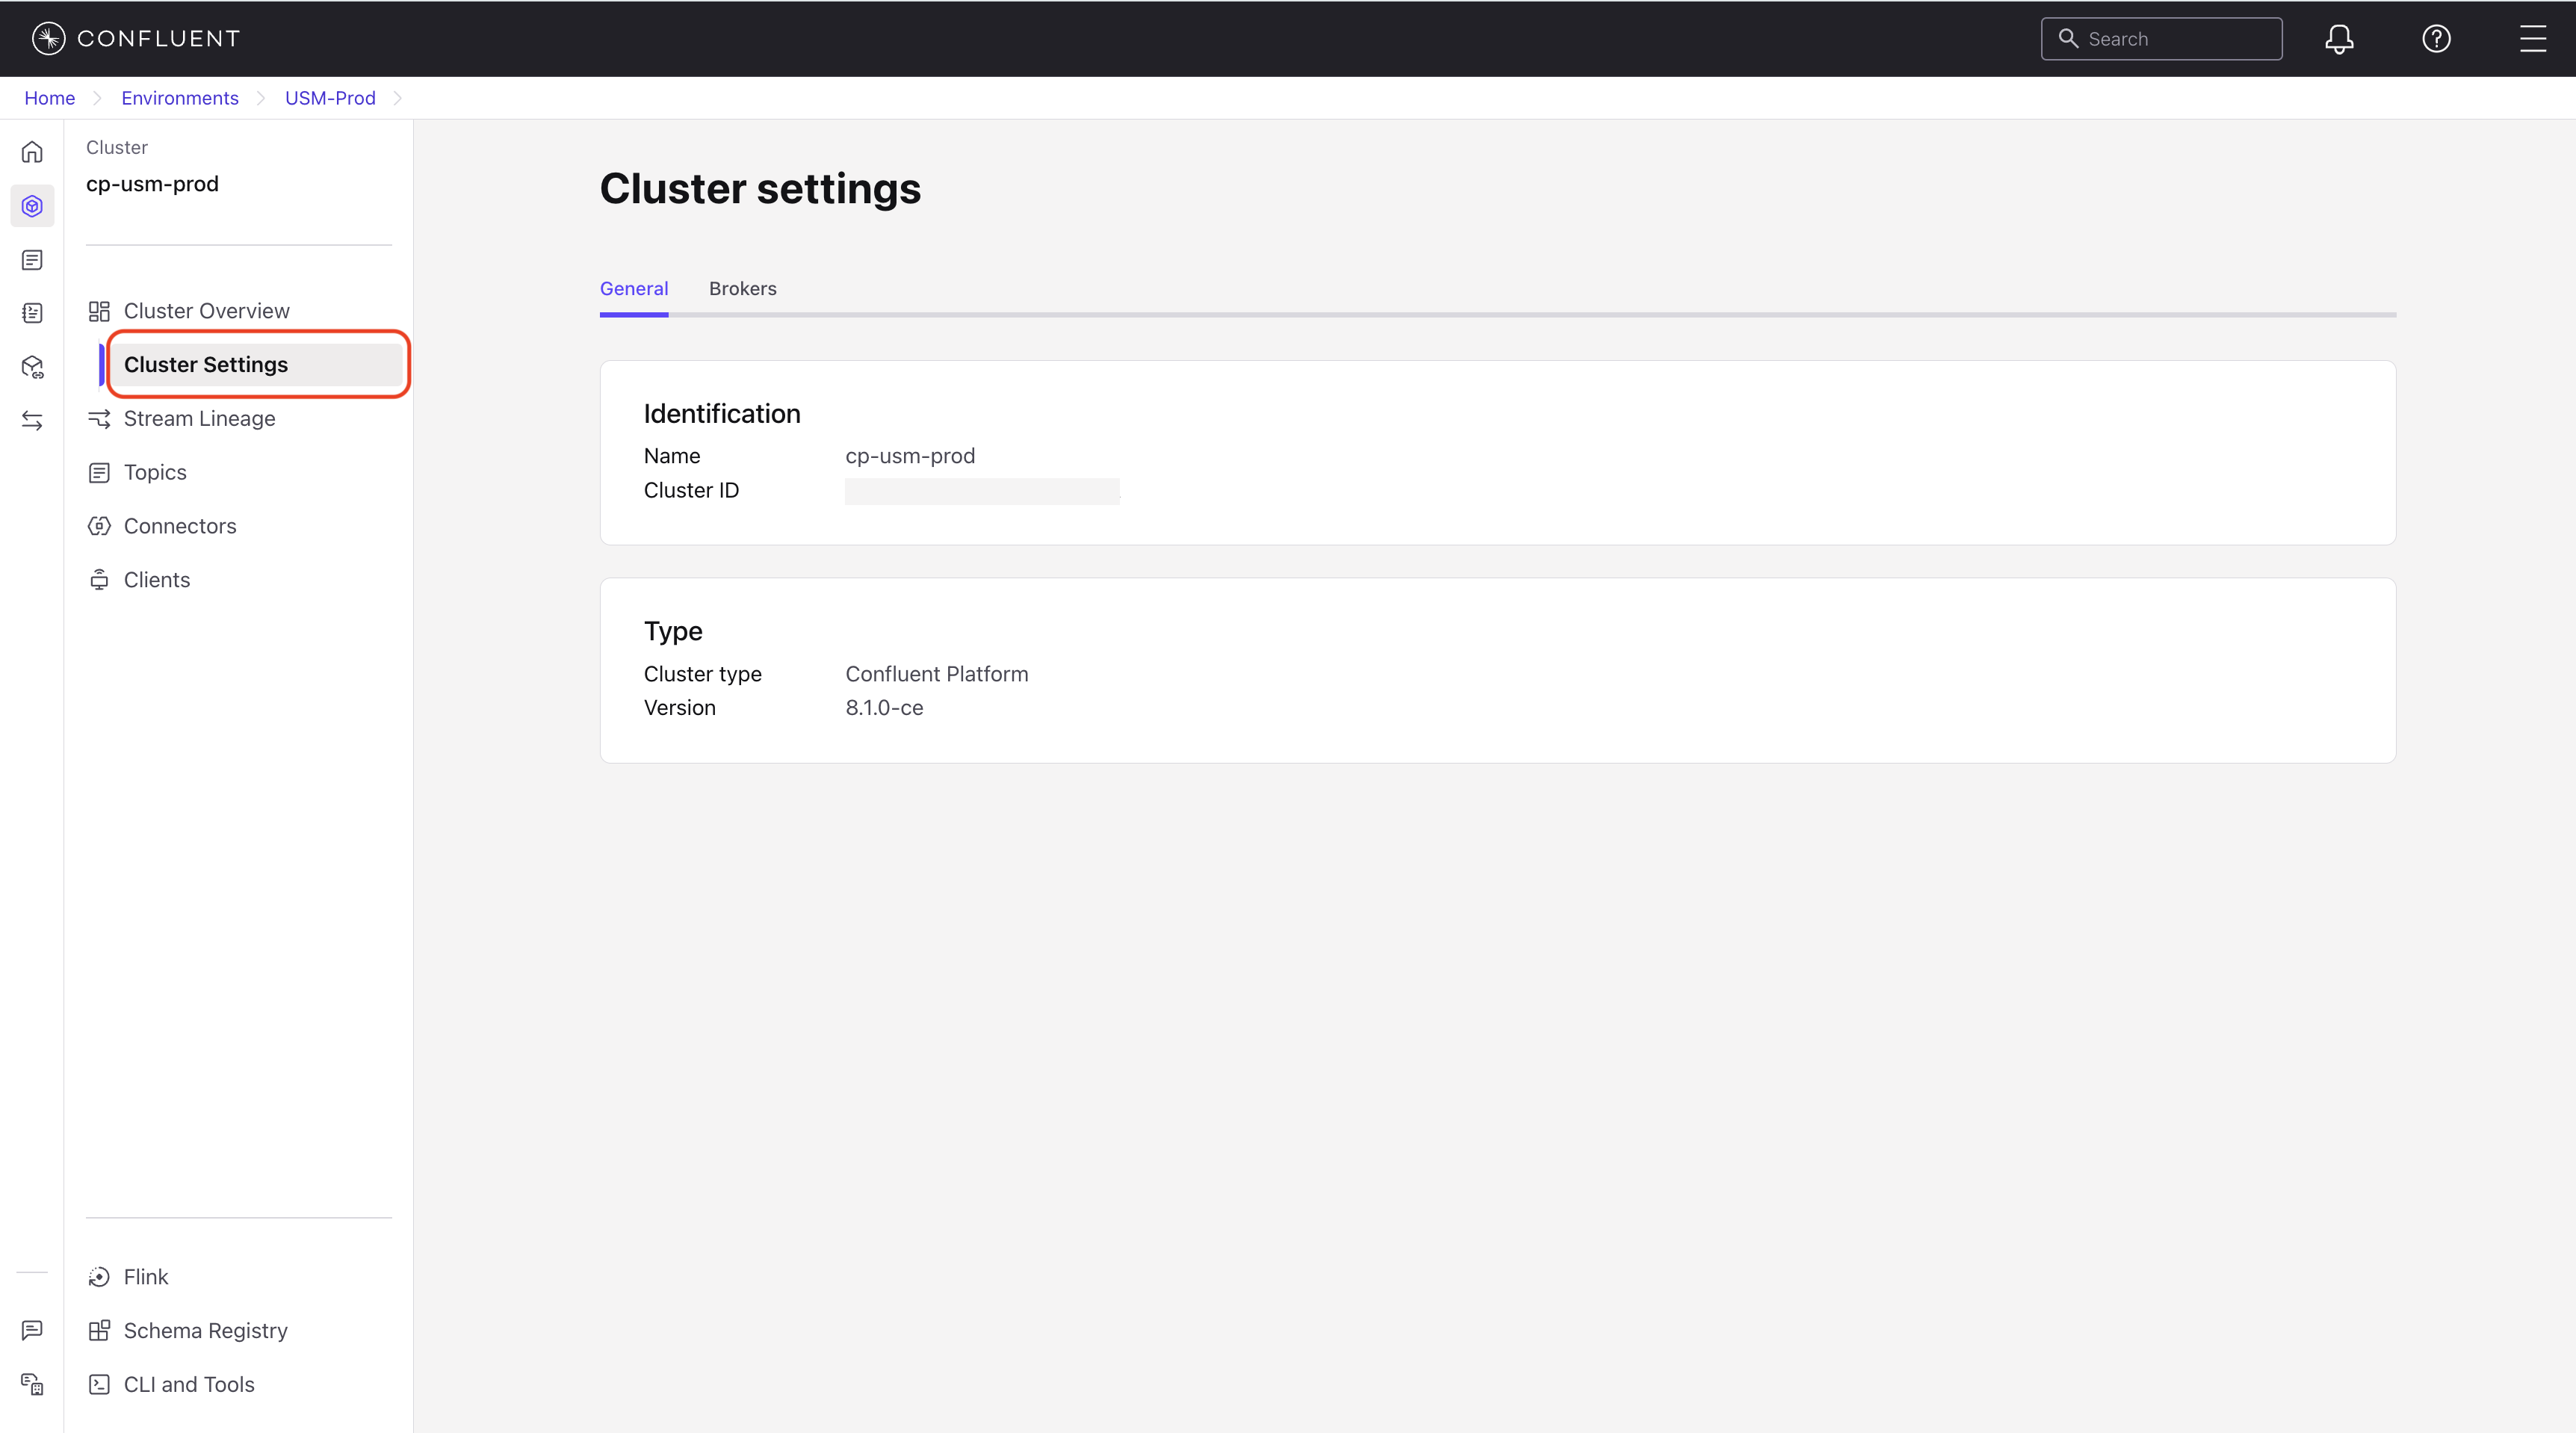
The tab includes the following sections:
Identification
Name: The name of the cluster.
Cluster ID: The unique identifier for the cluster.
Type
Cluster type: The cluster type, for example Confluent Platform.
Version: The Confluent Platform version running on the cluster.
Details tab
The Details tab provides metadata and organizational information about the cluster.
The tab includes the following sections:
About
ID: The unique identifier for the cluster.
Owner: User or team responsible for this cluster.
Timeline
Date created: Shows the date and time the resource was created.
Last modified: Shows the date and time the resource was last modified.
Location
Environment: Confluent Cloud environment where the cluster is registered.