
Monitor Confluent Platform Connectors with USM
You can use the Connectors page in the Confluent Cloud Console to monitor the status and performance of Confluent Platform connectors. The connectors run within the Confluent Platform Connect cluster.
Note
You can use the Connectors page to monitor connectors only. To perform management operations, such as creating, updating, or deleting connectors, use Confluent Control Center in the Confluent Platform environment.
View the connectors page
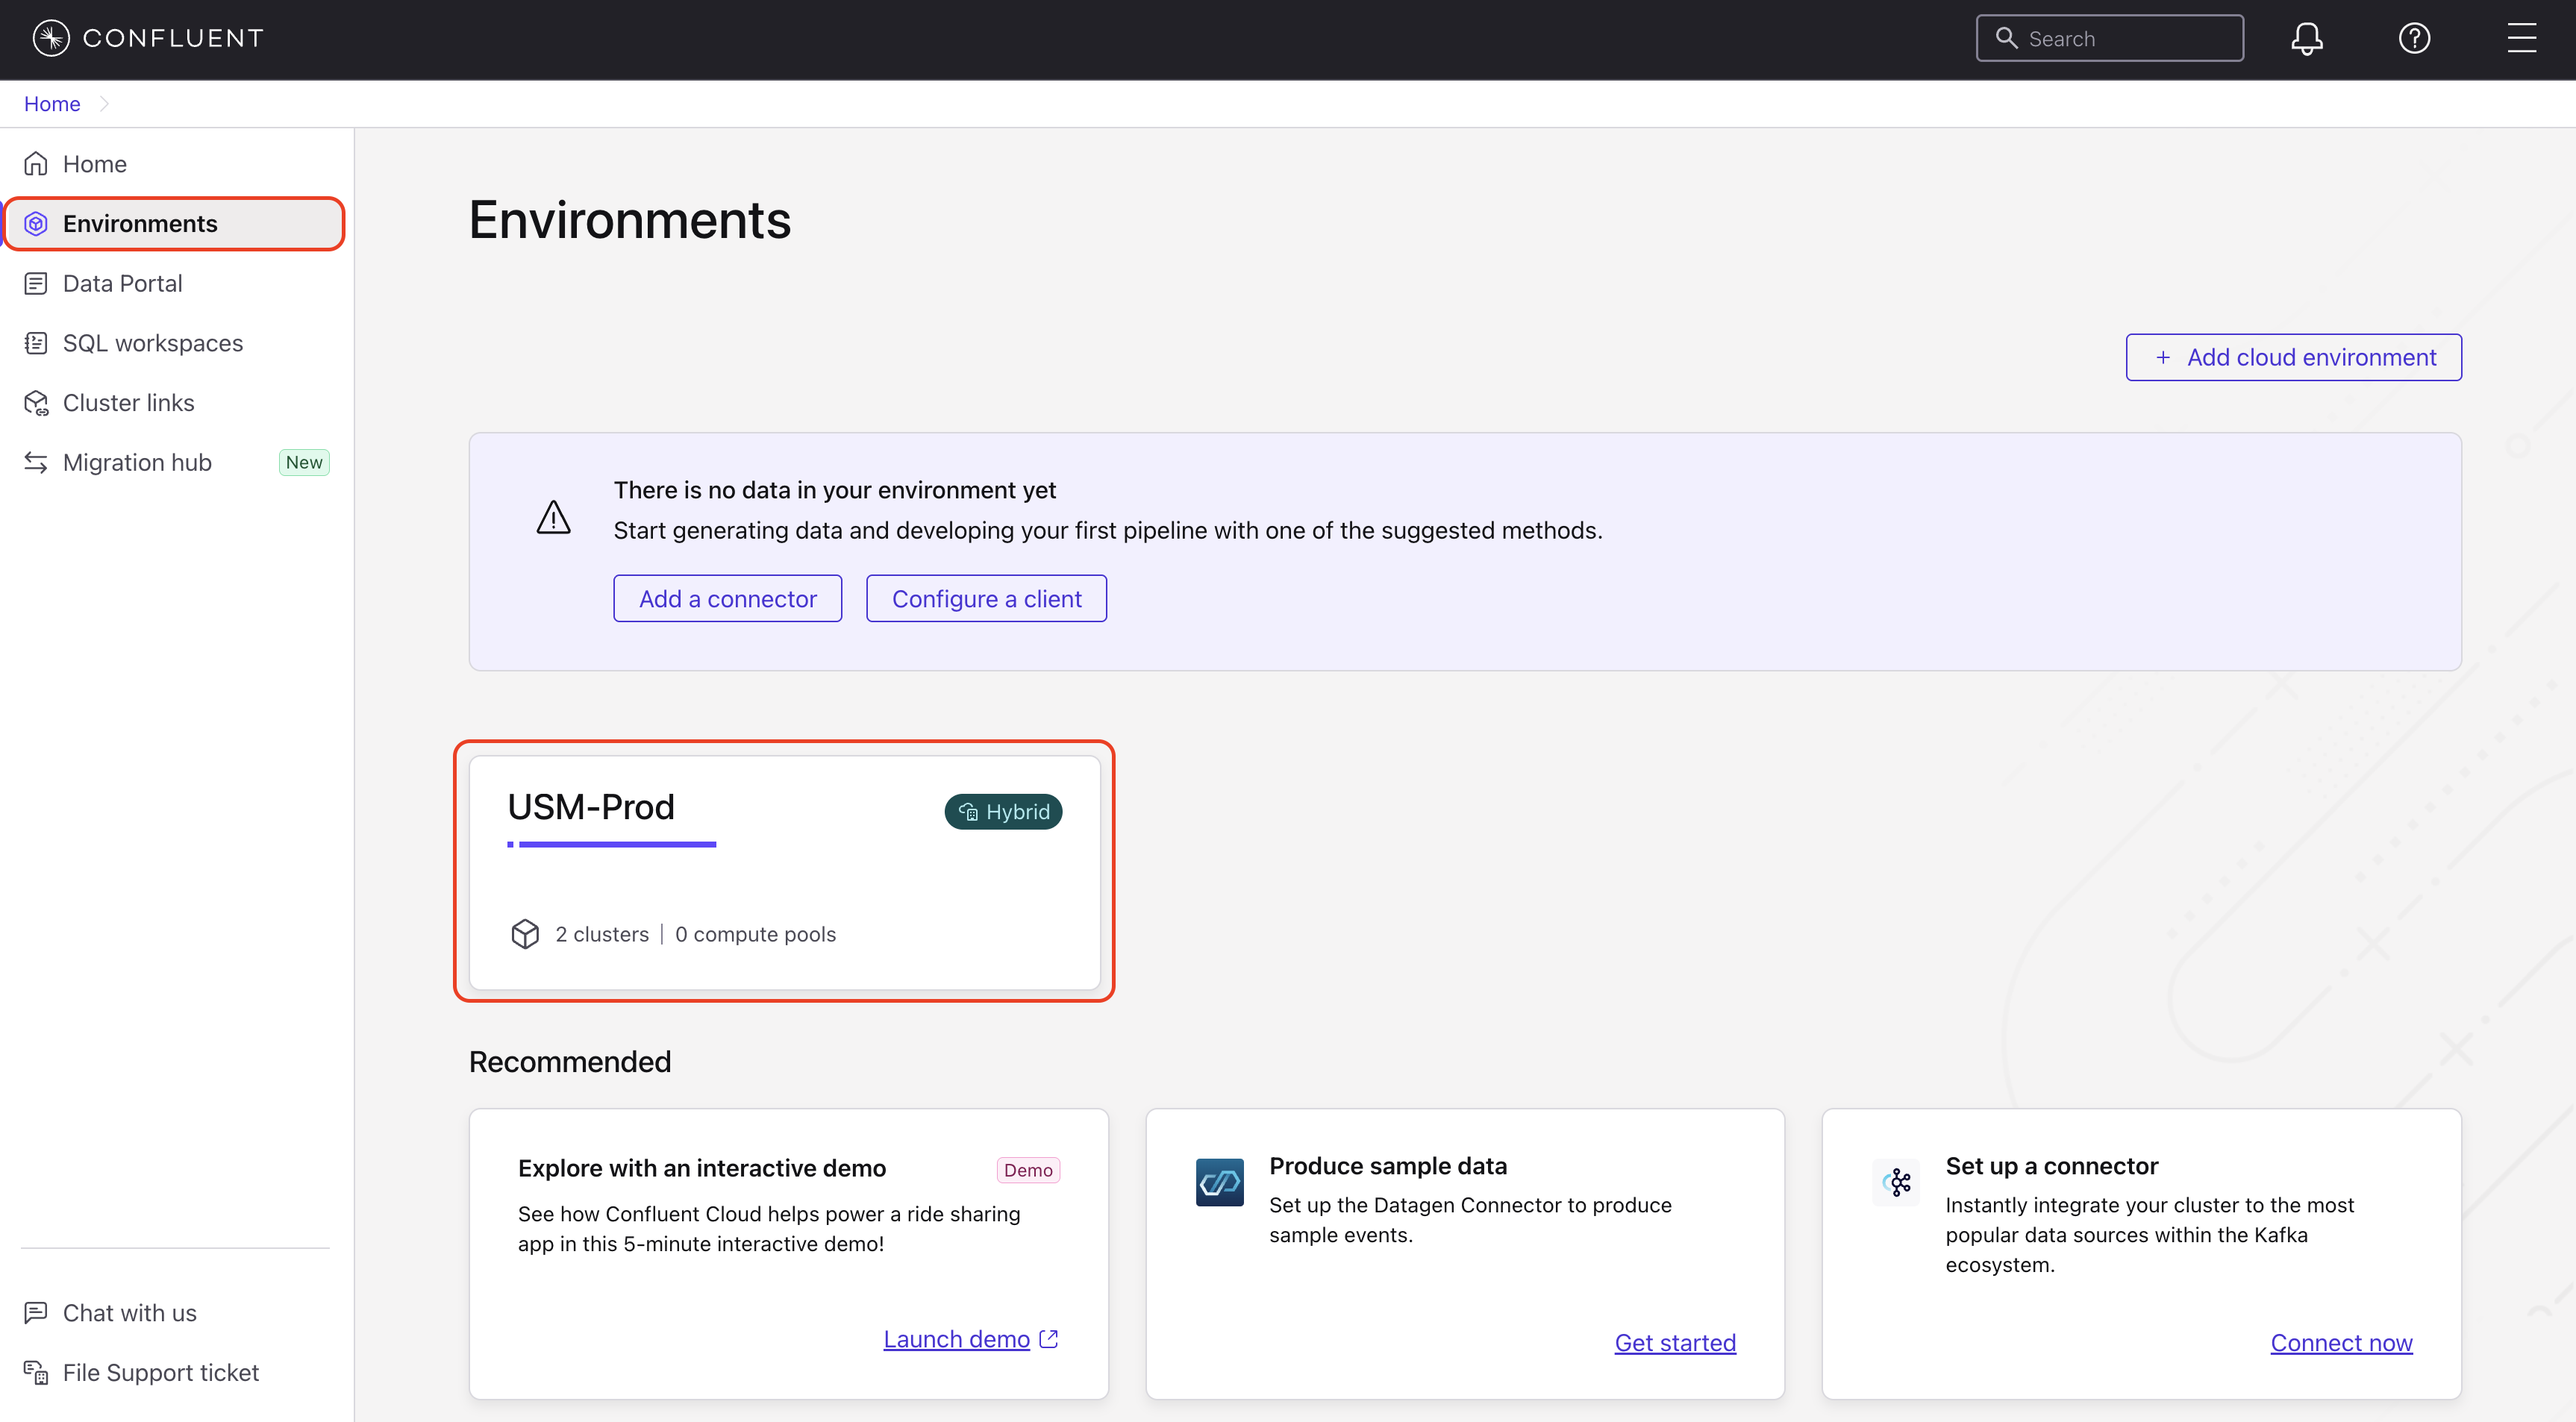
In the Confluent Cloud Console, navigate to Environments and select your environment.
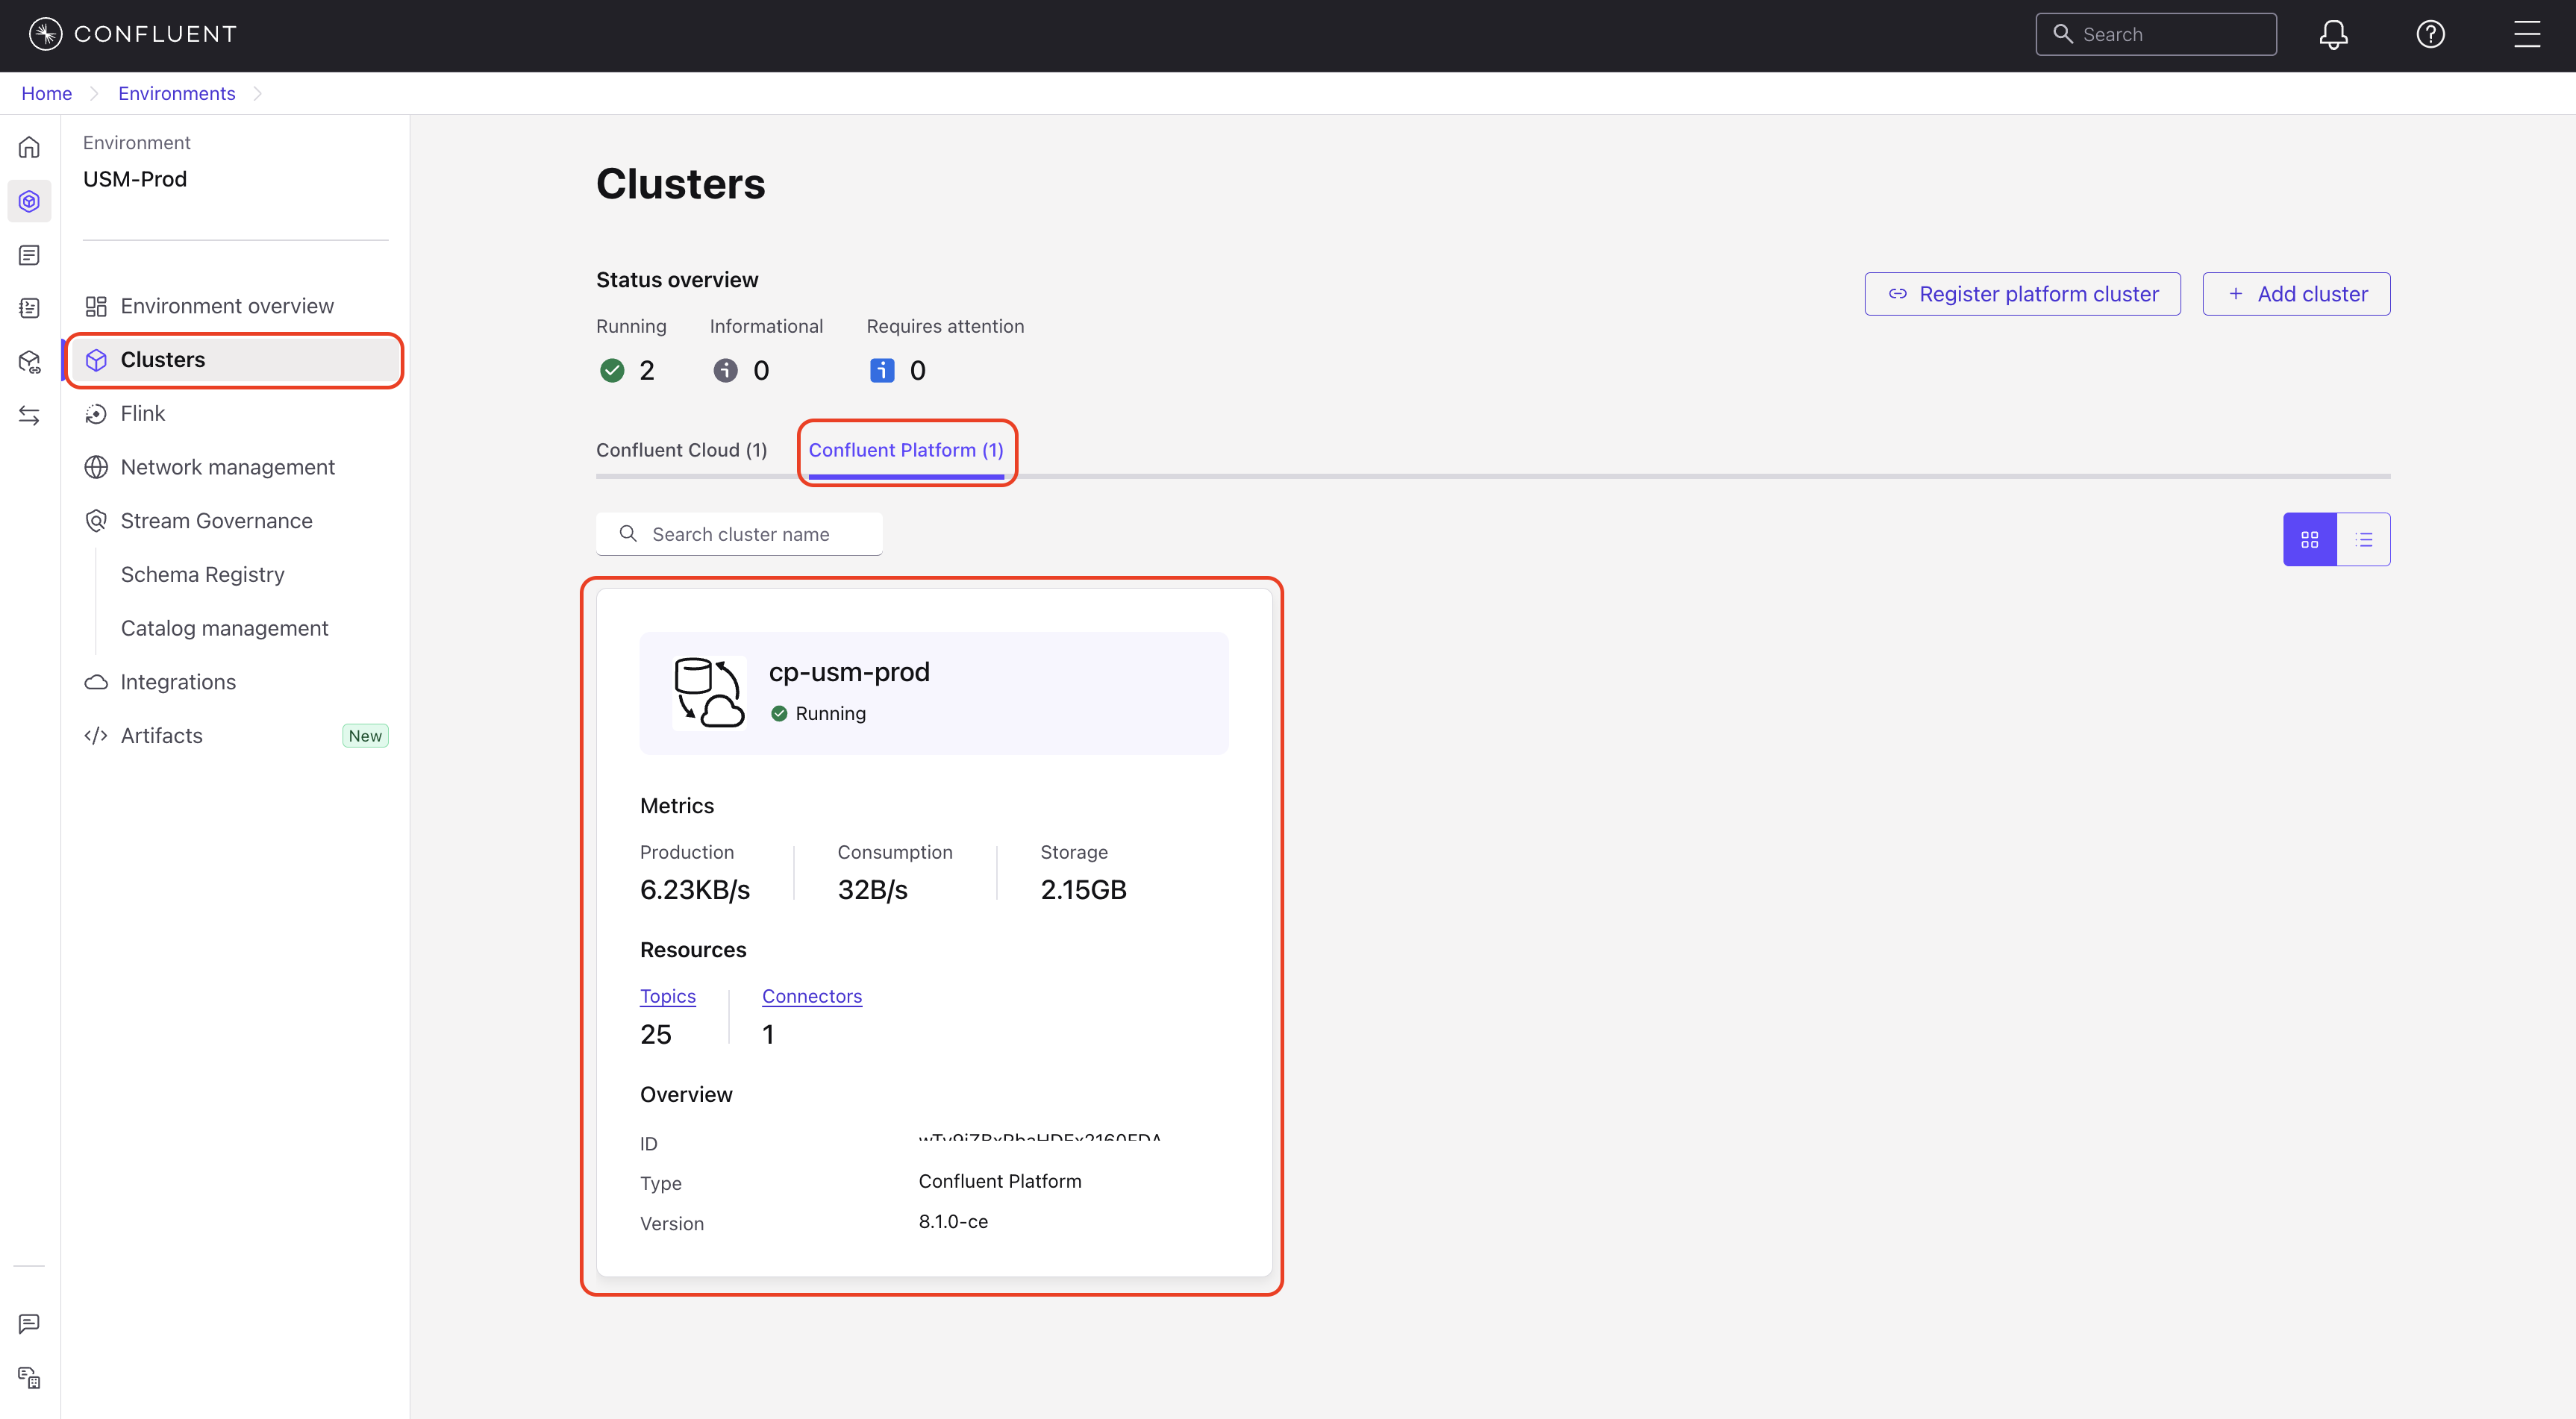
In the navigation menu, click Clusters and select a Confluent Platform cluster.
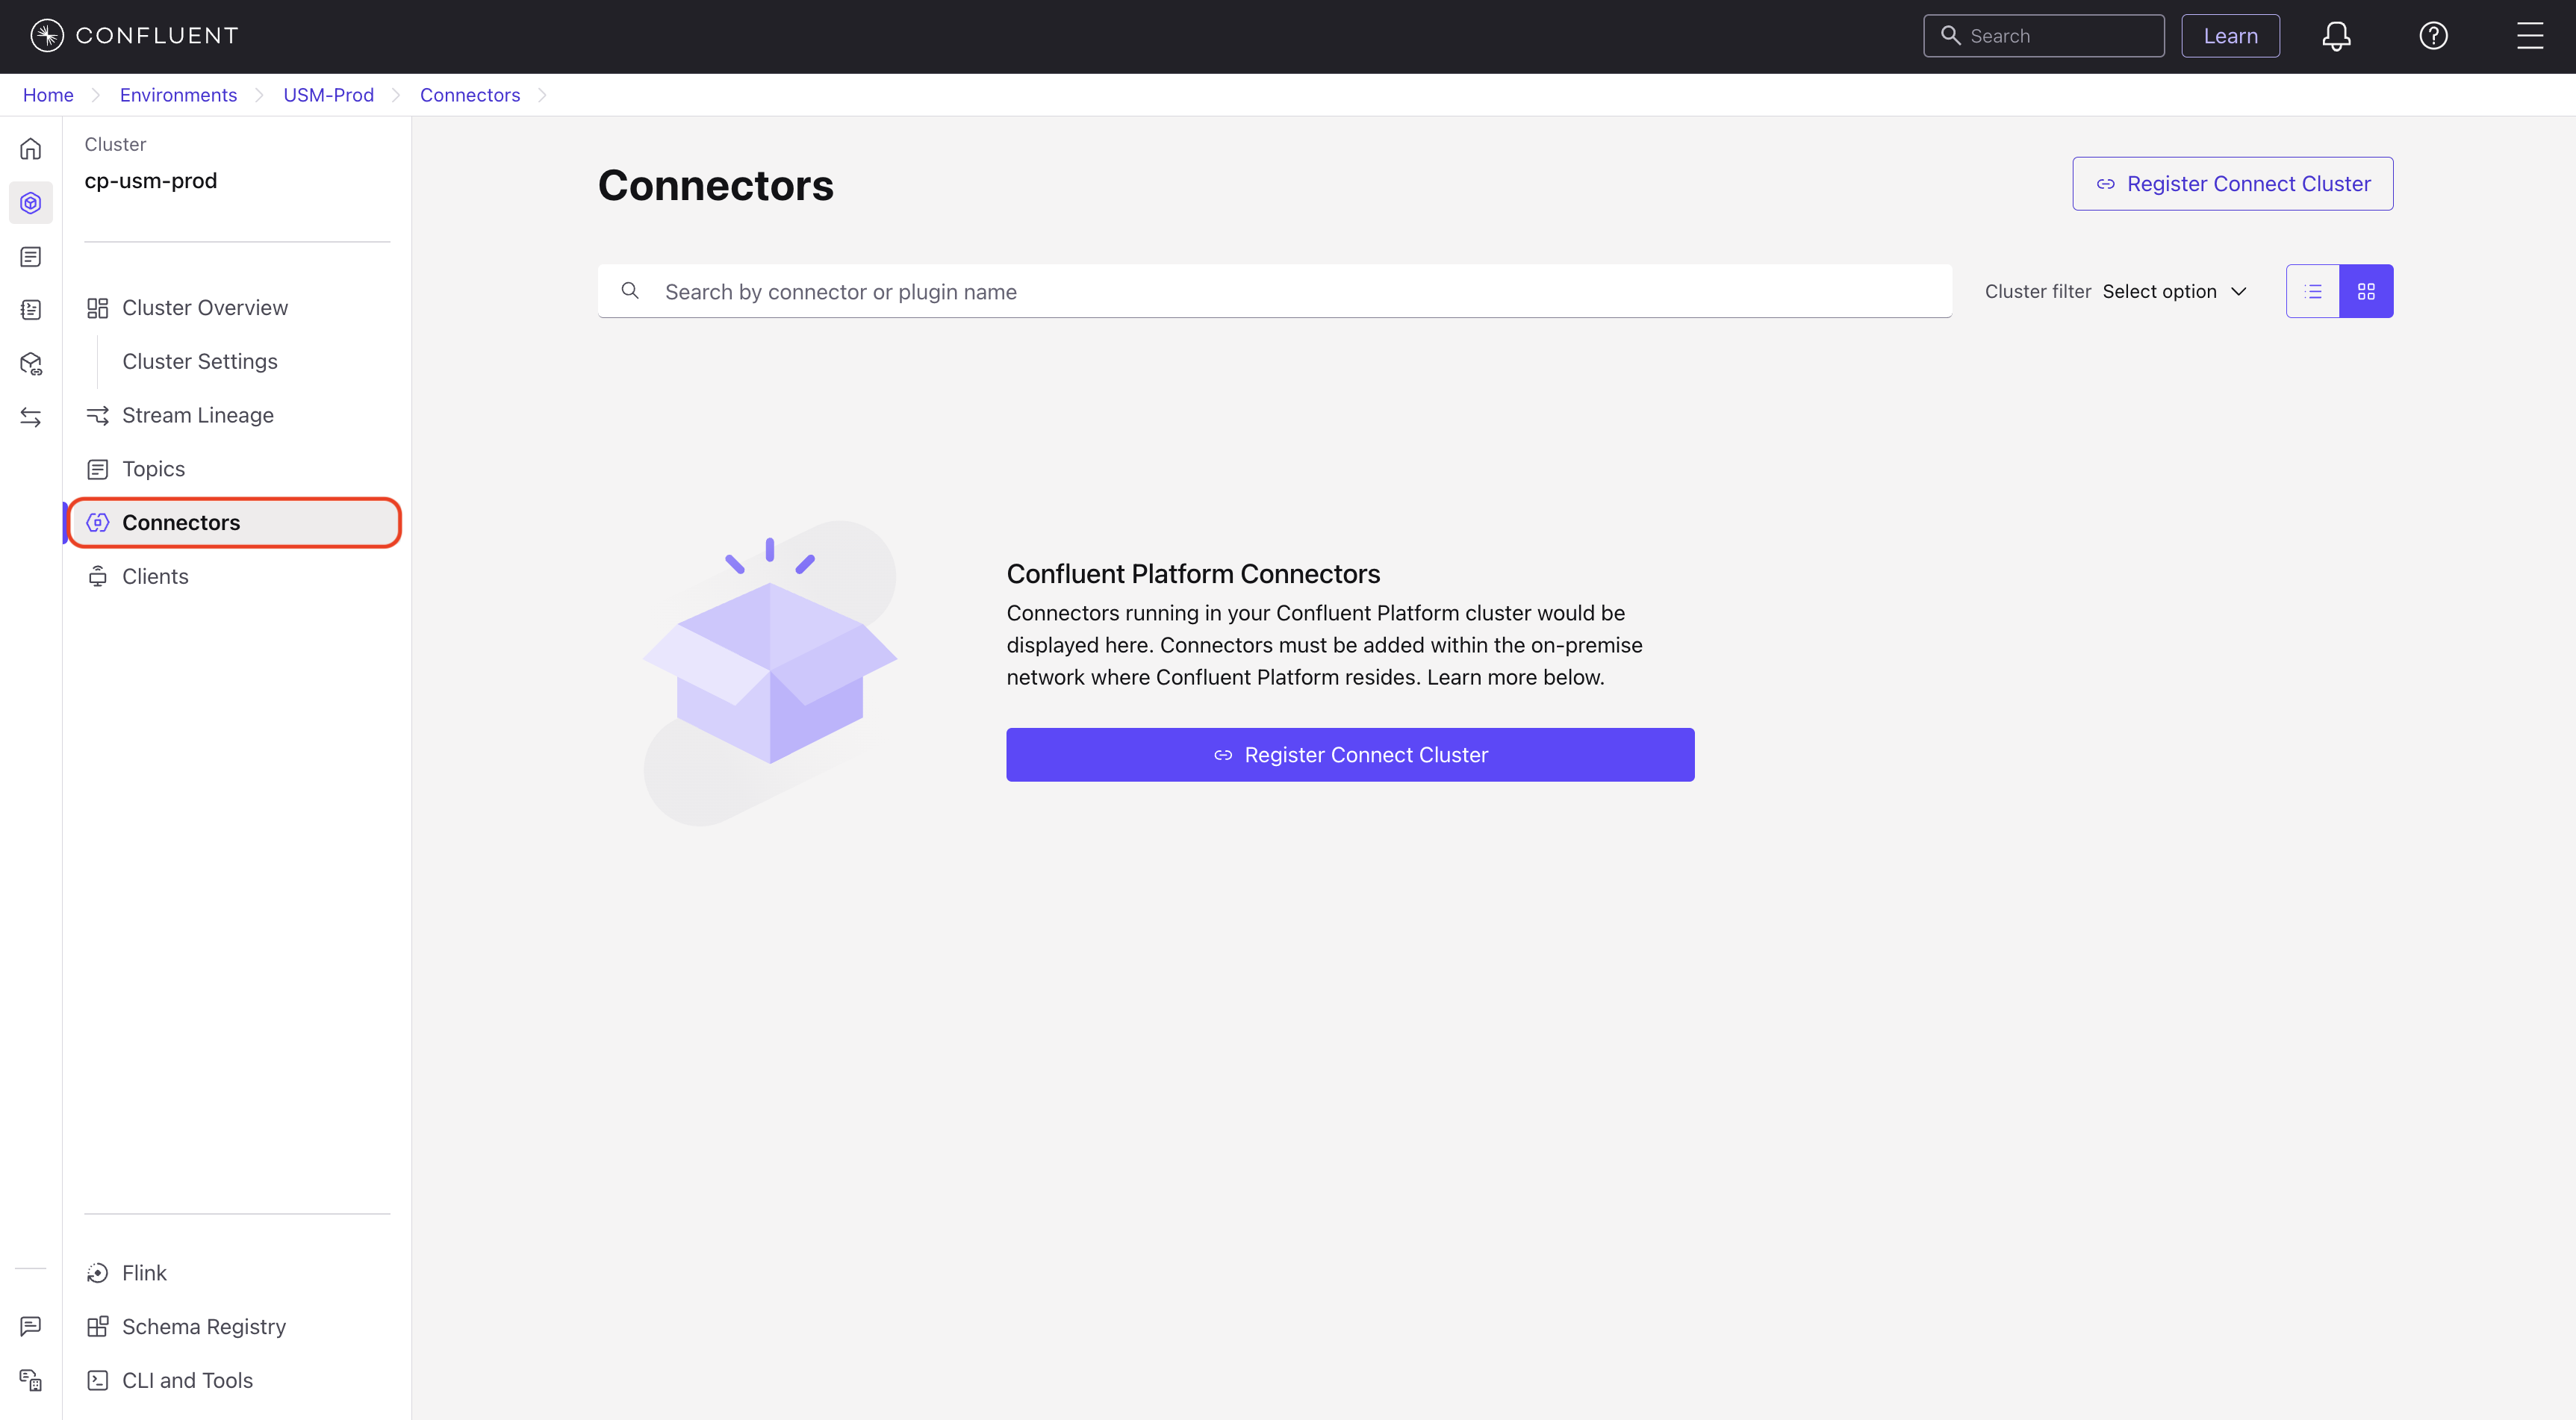
In the navigation menu, click Connectors.
Understand the connectors list
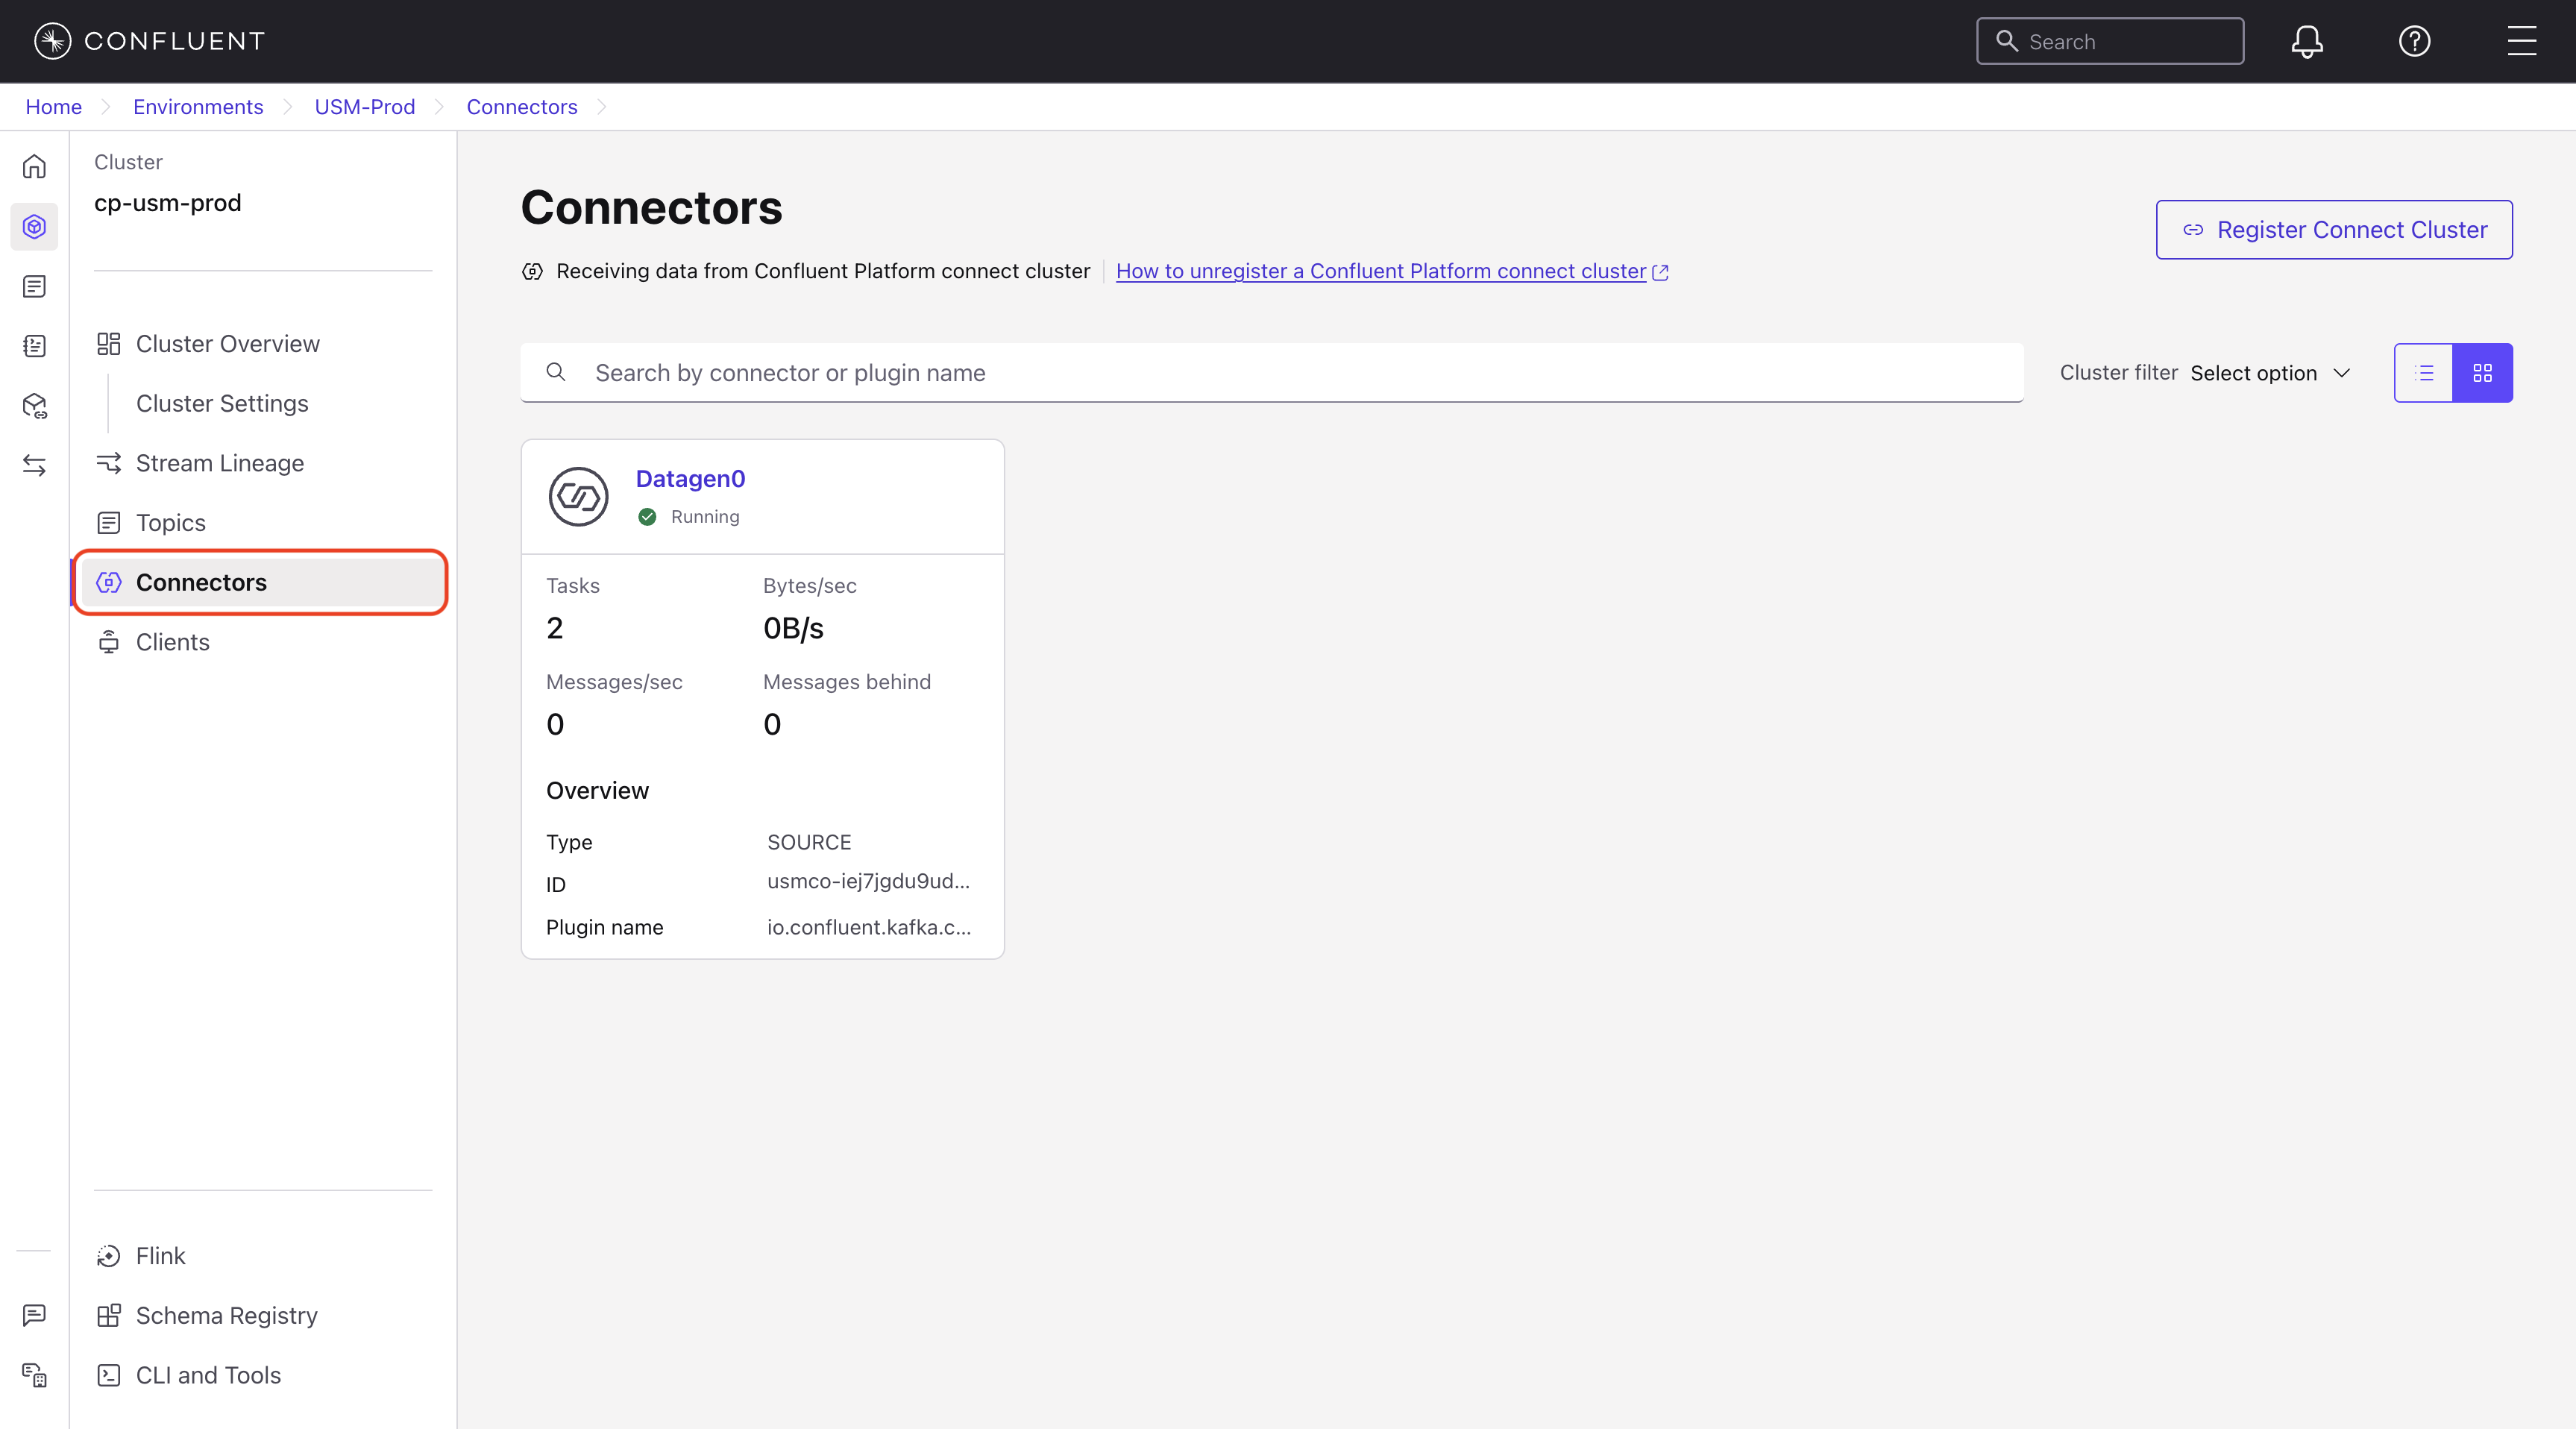
The Connectors page displays a card for each connector. To find a specific connector by name or plugin name, use the search box. If multiple Connect clusters are registered, use the Connect cluster filter dropdown menu to narrow the list to a specific cluster.
Each connector card provides an overview of the connector status, including the following fields:
Status: The state of the connector. Valid states are
Running,Paused, orFailed.Tasks: The total number of tasks for the connector.
Bytes / sec: The data throughput rate, in bytes per second.
Messages / sec: The data throughput rate, in messages per second.
Messages behind: The lag for a source connector, which indicates the number of messages remaining to be processed.
Overview: The identification info for the connector, including the type (Source or Sink), unique ID, and plugin name.
If no connectors run in the Confluent Platform cluster, the page displays a message.
View the Connect cluster list
The Connect cluster list panel displays all Confluent Platform Connect clusters registered in the Confluent Cloud Console.
To open the panel, click Connect cluster list.
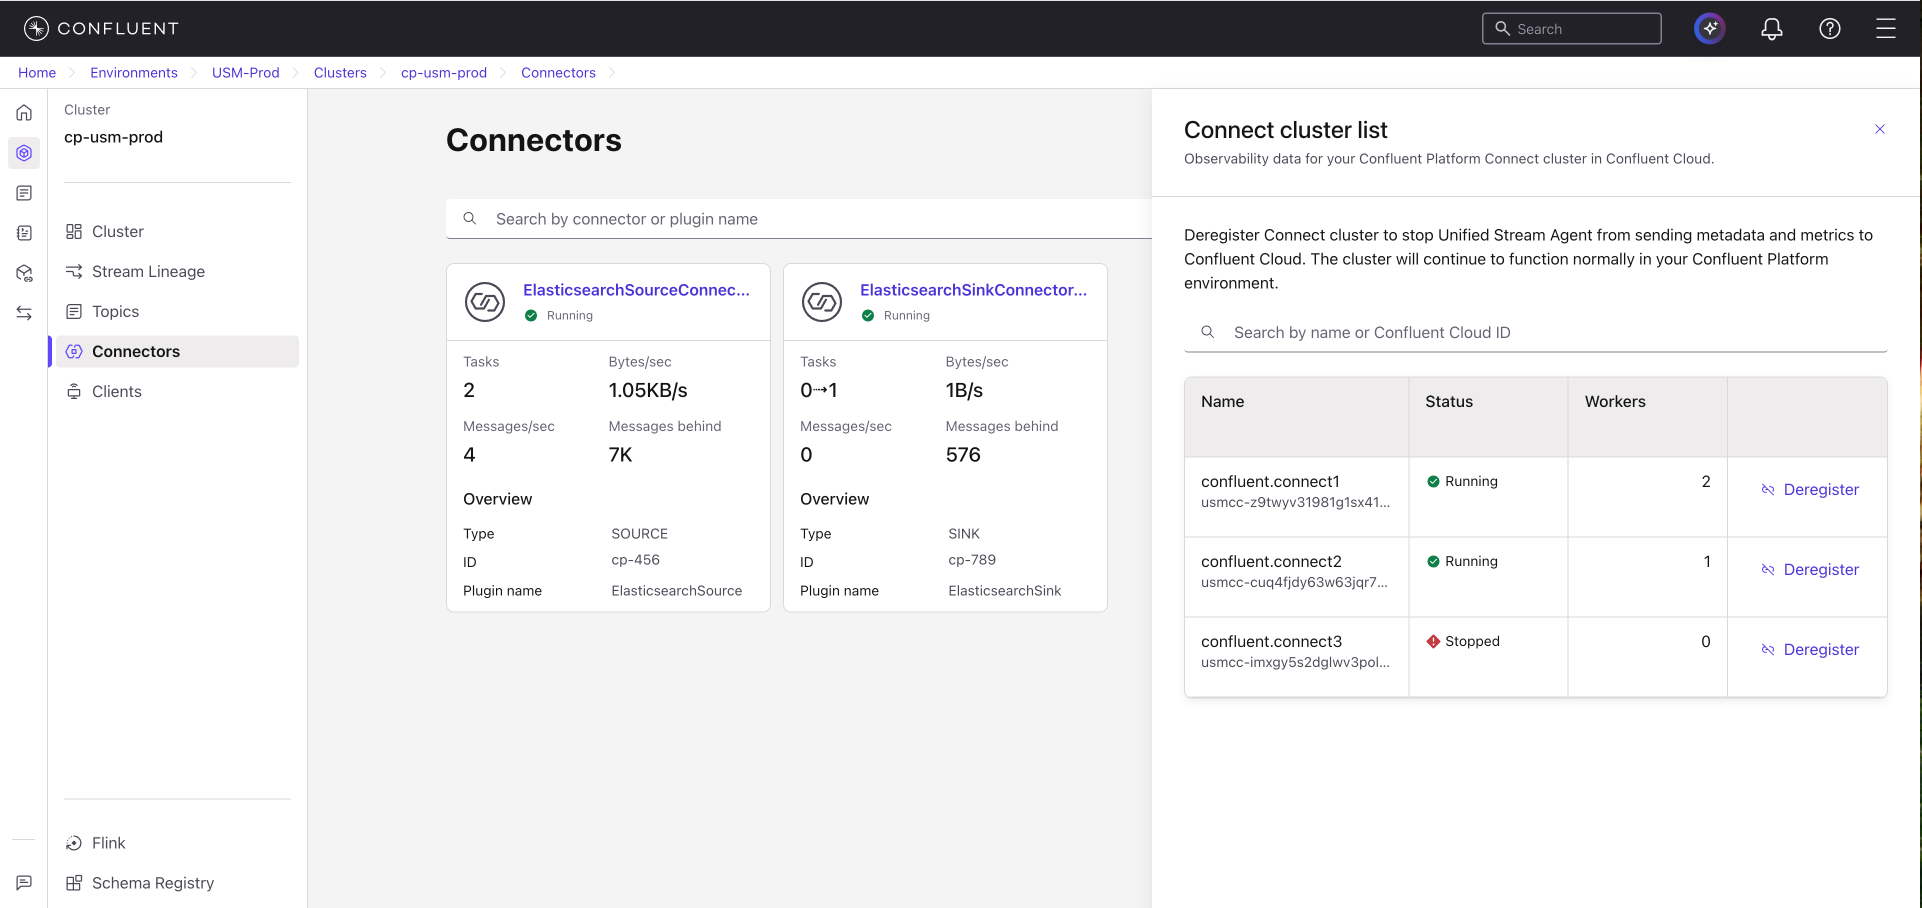
The panel displays the following information for each registered cluster:
Name: The name and Confluent Cloud ID of the Connect cluster.
Status: The state of the cluster. Valid states are
RunningorStopped.Workers: The number of active workers in the cluster.
To deregister a Connect cluster, click Deregister next to the cluster in this panel. Deregistering stops the USM Agent from sending metadata and metrics to Confluent Cloud. The cluster continues to function normally in the Confluent Platform environment. For more information, see Deregister a Connect cluster.
View individual connector details
The connector details page provides identification, health, and performance information for a specific connector.
To view the details of a specific connector, follow these steps:
In the Confluent Cloud Console, navigate to Environments and select your environment.
In the navigation menu, click Clusters and select a Confluent Platform cluster.
In the navigation menu, click Connectors.
On the Connectors page, click the card for the connector that you want to inspect.
This opens a detailed view with five tabs: Overview, Monitor, Logs, Settings, and Details. The Overview tab is displayed by default.
Overview tab
The Overview tab provides a summary of the identification, health, and recent performance of the connector.
The tab displays the following information:
ID: The unique identifier for the connector.
Environment: The Confluent Cloud environment where the connector is registered.
Cluster: The Confluent Platform cluster where the Connect cluster for the connector is registered.
The Connector health section shows the number of tasks in each state:
Running: The number of running tasks.
Unassigned: The number of tasks that are not assigned to a worker.
Failed: The number of failed tasks.
Stopped: The number of stopped tasks.
The Performance metrics section summarizes connector activity over the last seven days:
Messages processed: The total number of messages that the connector processed.
Message rate: The rate of processed messages, in messages per second.
Throughput: The data throughput rate, in bytes per second.
Message size: The average size of messages that the connector processed, in bytes.
To open the Monitor tab, click View details next to any metric.
Monitor tab
The Monitor tab provides historical performance metrics for the connector. The displayed data corresponds to the time range that you select from the dropdown menu.
The Performance metrics section helps you track the efficiency of the connector with key processing and resource indicators:
Messages processed: A graph that shows the rate of messages that the connector successfully handled, in messages per second.
Throughput: A graph that shows the resource usage for the connector, in bytes per second.
The Message characteristics section helps you understand the size and batching of data that flows through the connector:
Message size: The average and maximum size of messages, in bytes.
Message batch size: The average and maximum number of messages grouped for processing in each batch operation.
Logs tab
The Logs tab explains how to access connector logs. Logs for on-premises connectors do not stream to the Confluent Cloud Console. To access the logs directly from the Confluent Platform environment, use the Confluent Platform command-line tool.
Settings tab
The Settings tab displays the connector configuration as a list of key-value properties. The settings are read-only and reflect the configuration applied in the Confluent Platform environment.
Details tab
The Details tab provides metadata and organizational information about the connector.
The tab includes the following sections:
About
ID: The unique identifier for the connector.
Owner: The user or team responsible for the connector.
Category: The type of connector, such as
SourceorSink.Type: The full plugin name, such as
io.confluent.kafka.connect.datagen.DatagenConnector.
Timeline
Date created: The creation date and time for the connector.
Last modified: The date and time of the most recent modification to the connector.
Location
Environment: The Confluent Cloud environment where the connector is registered.
Cluster: The Confluent Platform cluster where the Connect cluster for the connector is registered.