
Monitor Consumer Lag for Confluent Platform Clusters
You can monitor Apache Kafka® consumer lag for your Confluent Platform clusters registered with Unified Stream Manager (USM) in the Confluent Cloud Console. Consumer lag is the number of consumer offsets between the latest message produced in a partition and the last message consumed by a consumer. A large or quickly growing consumer lag indicates that consumers cannot read from a partition as fast as messages are produced. Common causes include a slow consumer, slow network, or slow broker.
Upgrade to Confluent Platform version 8.3 or later to access new features and richer observability.
View consumer lag for a Confluent Platform cluster
To monitor consumer lag in the Confluent Cloud Console:
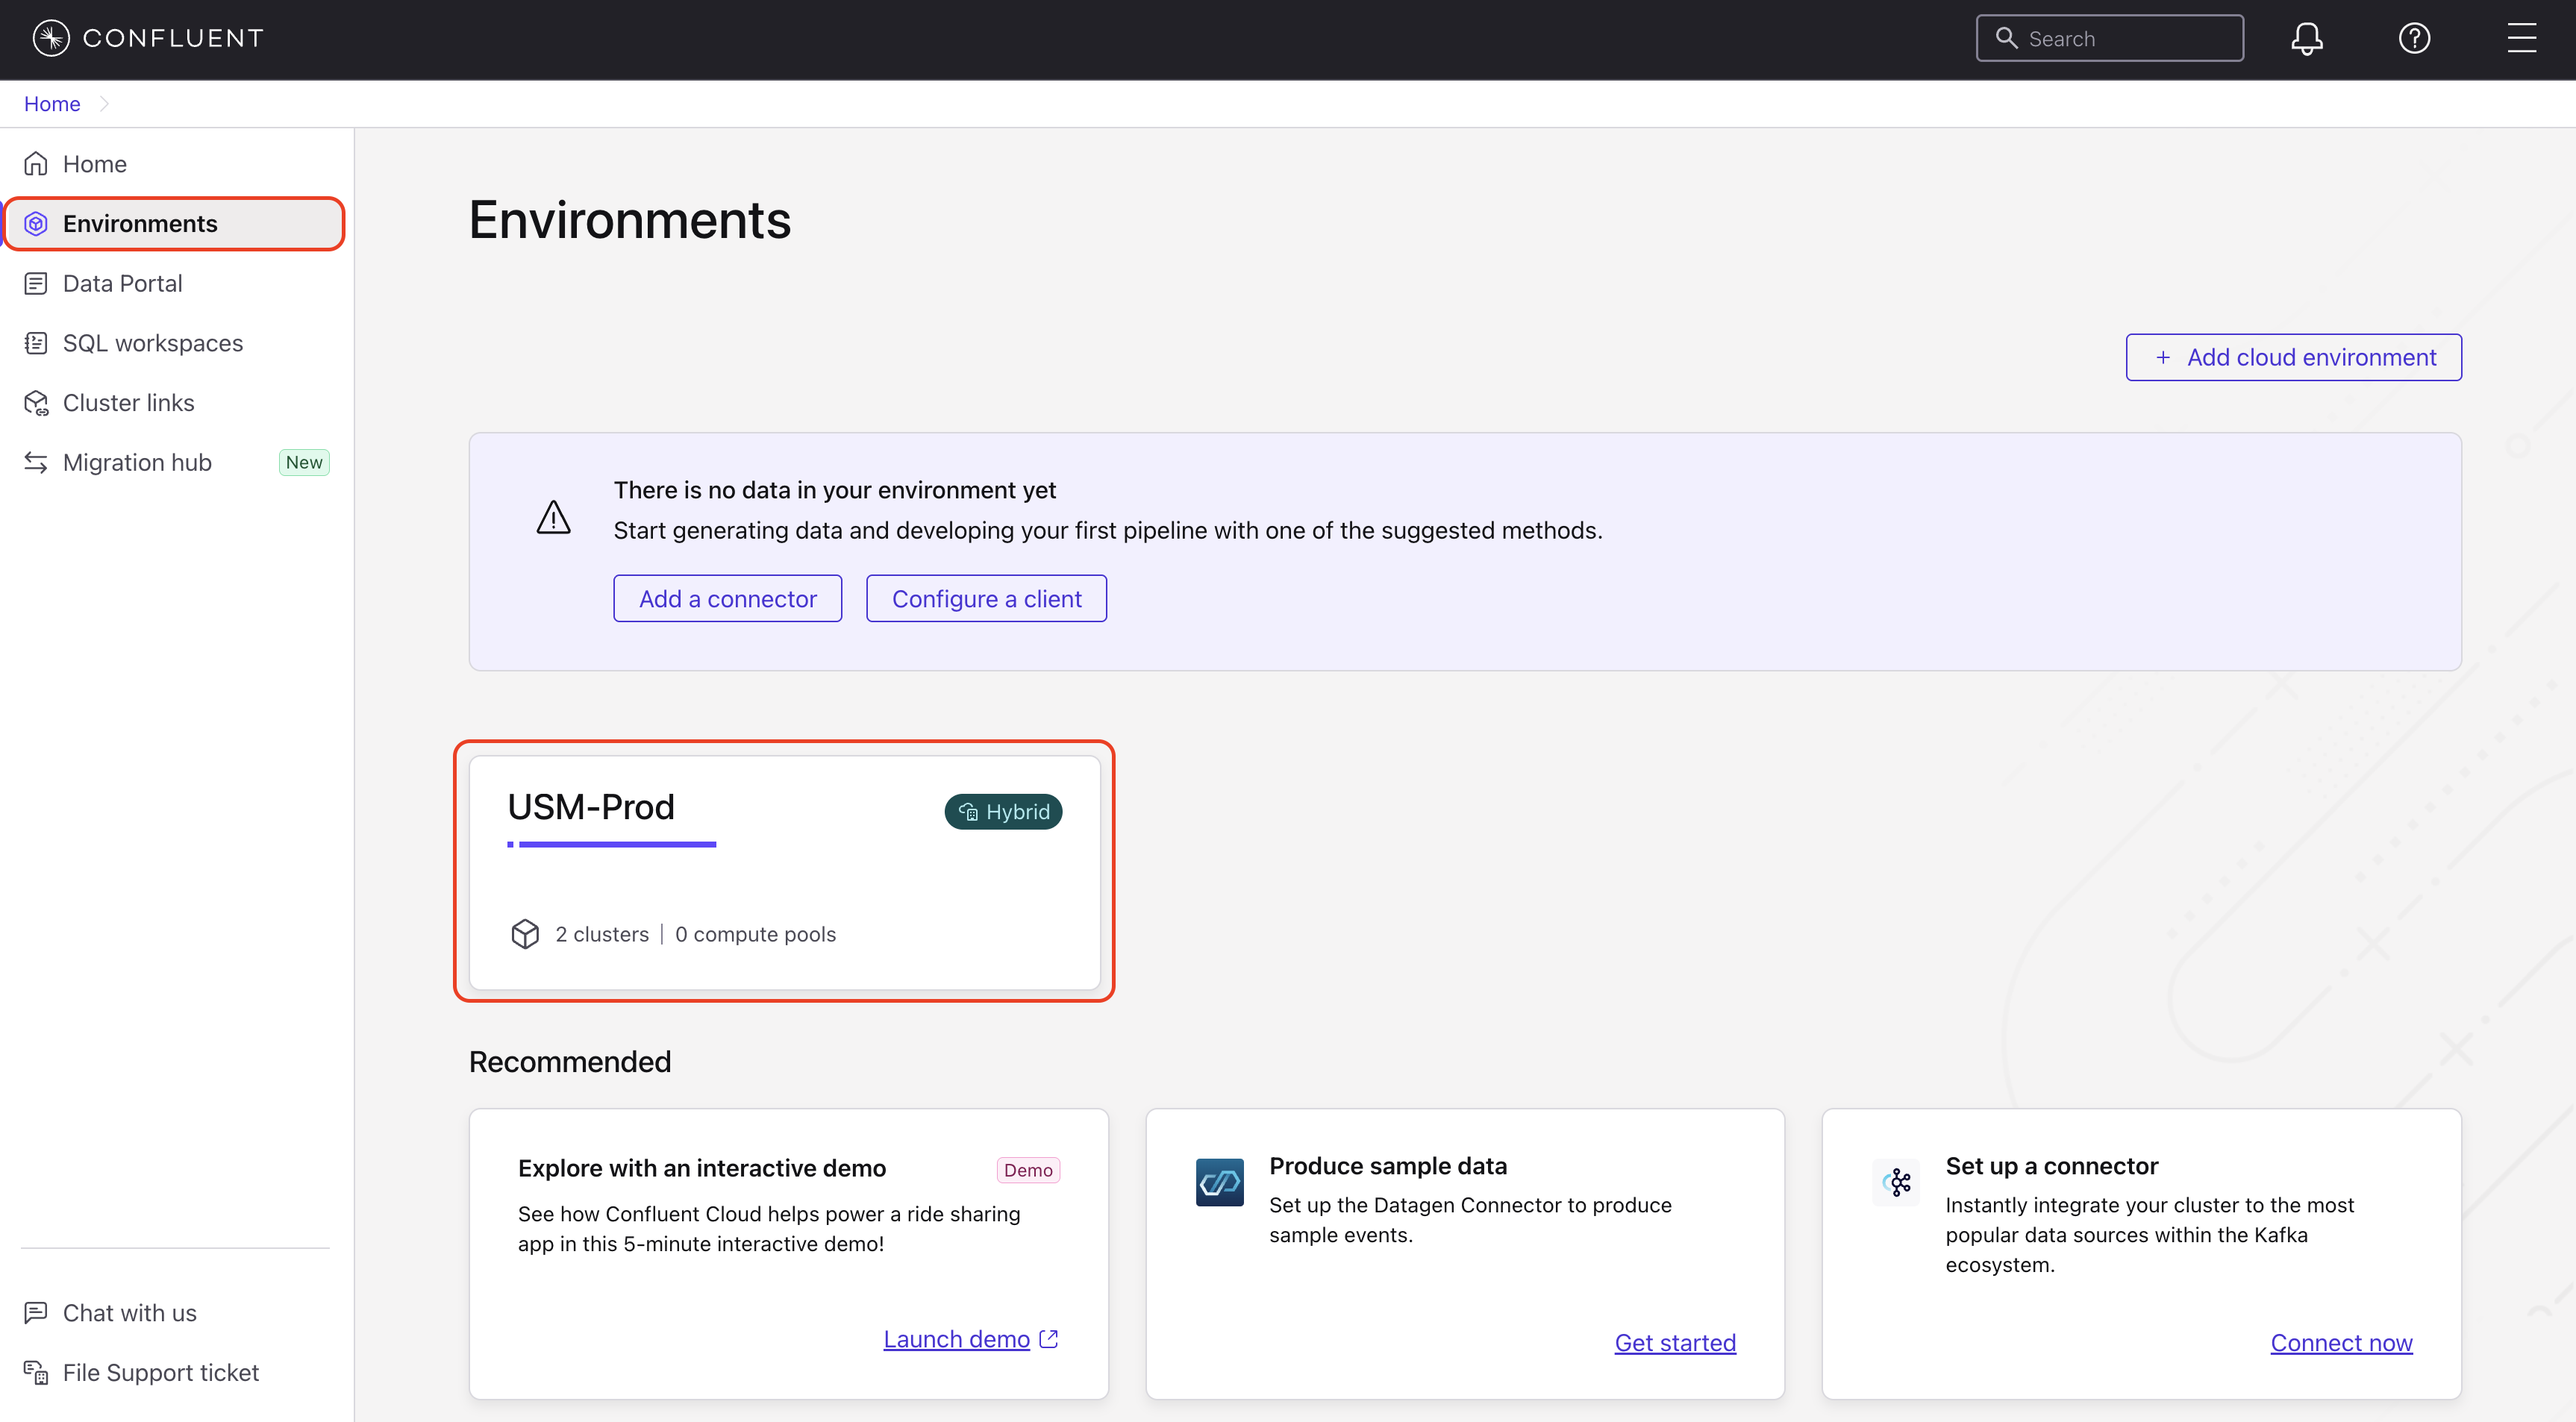
In the Confluent Cloud Console, navigate to the Environments page and select your environment.
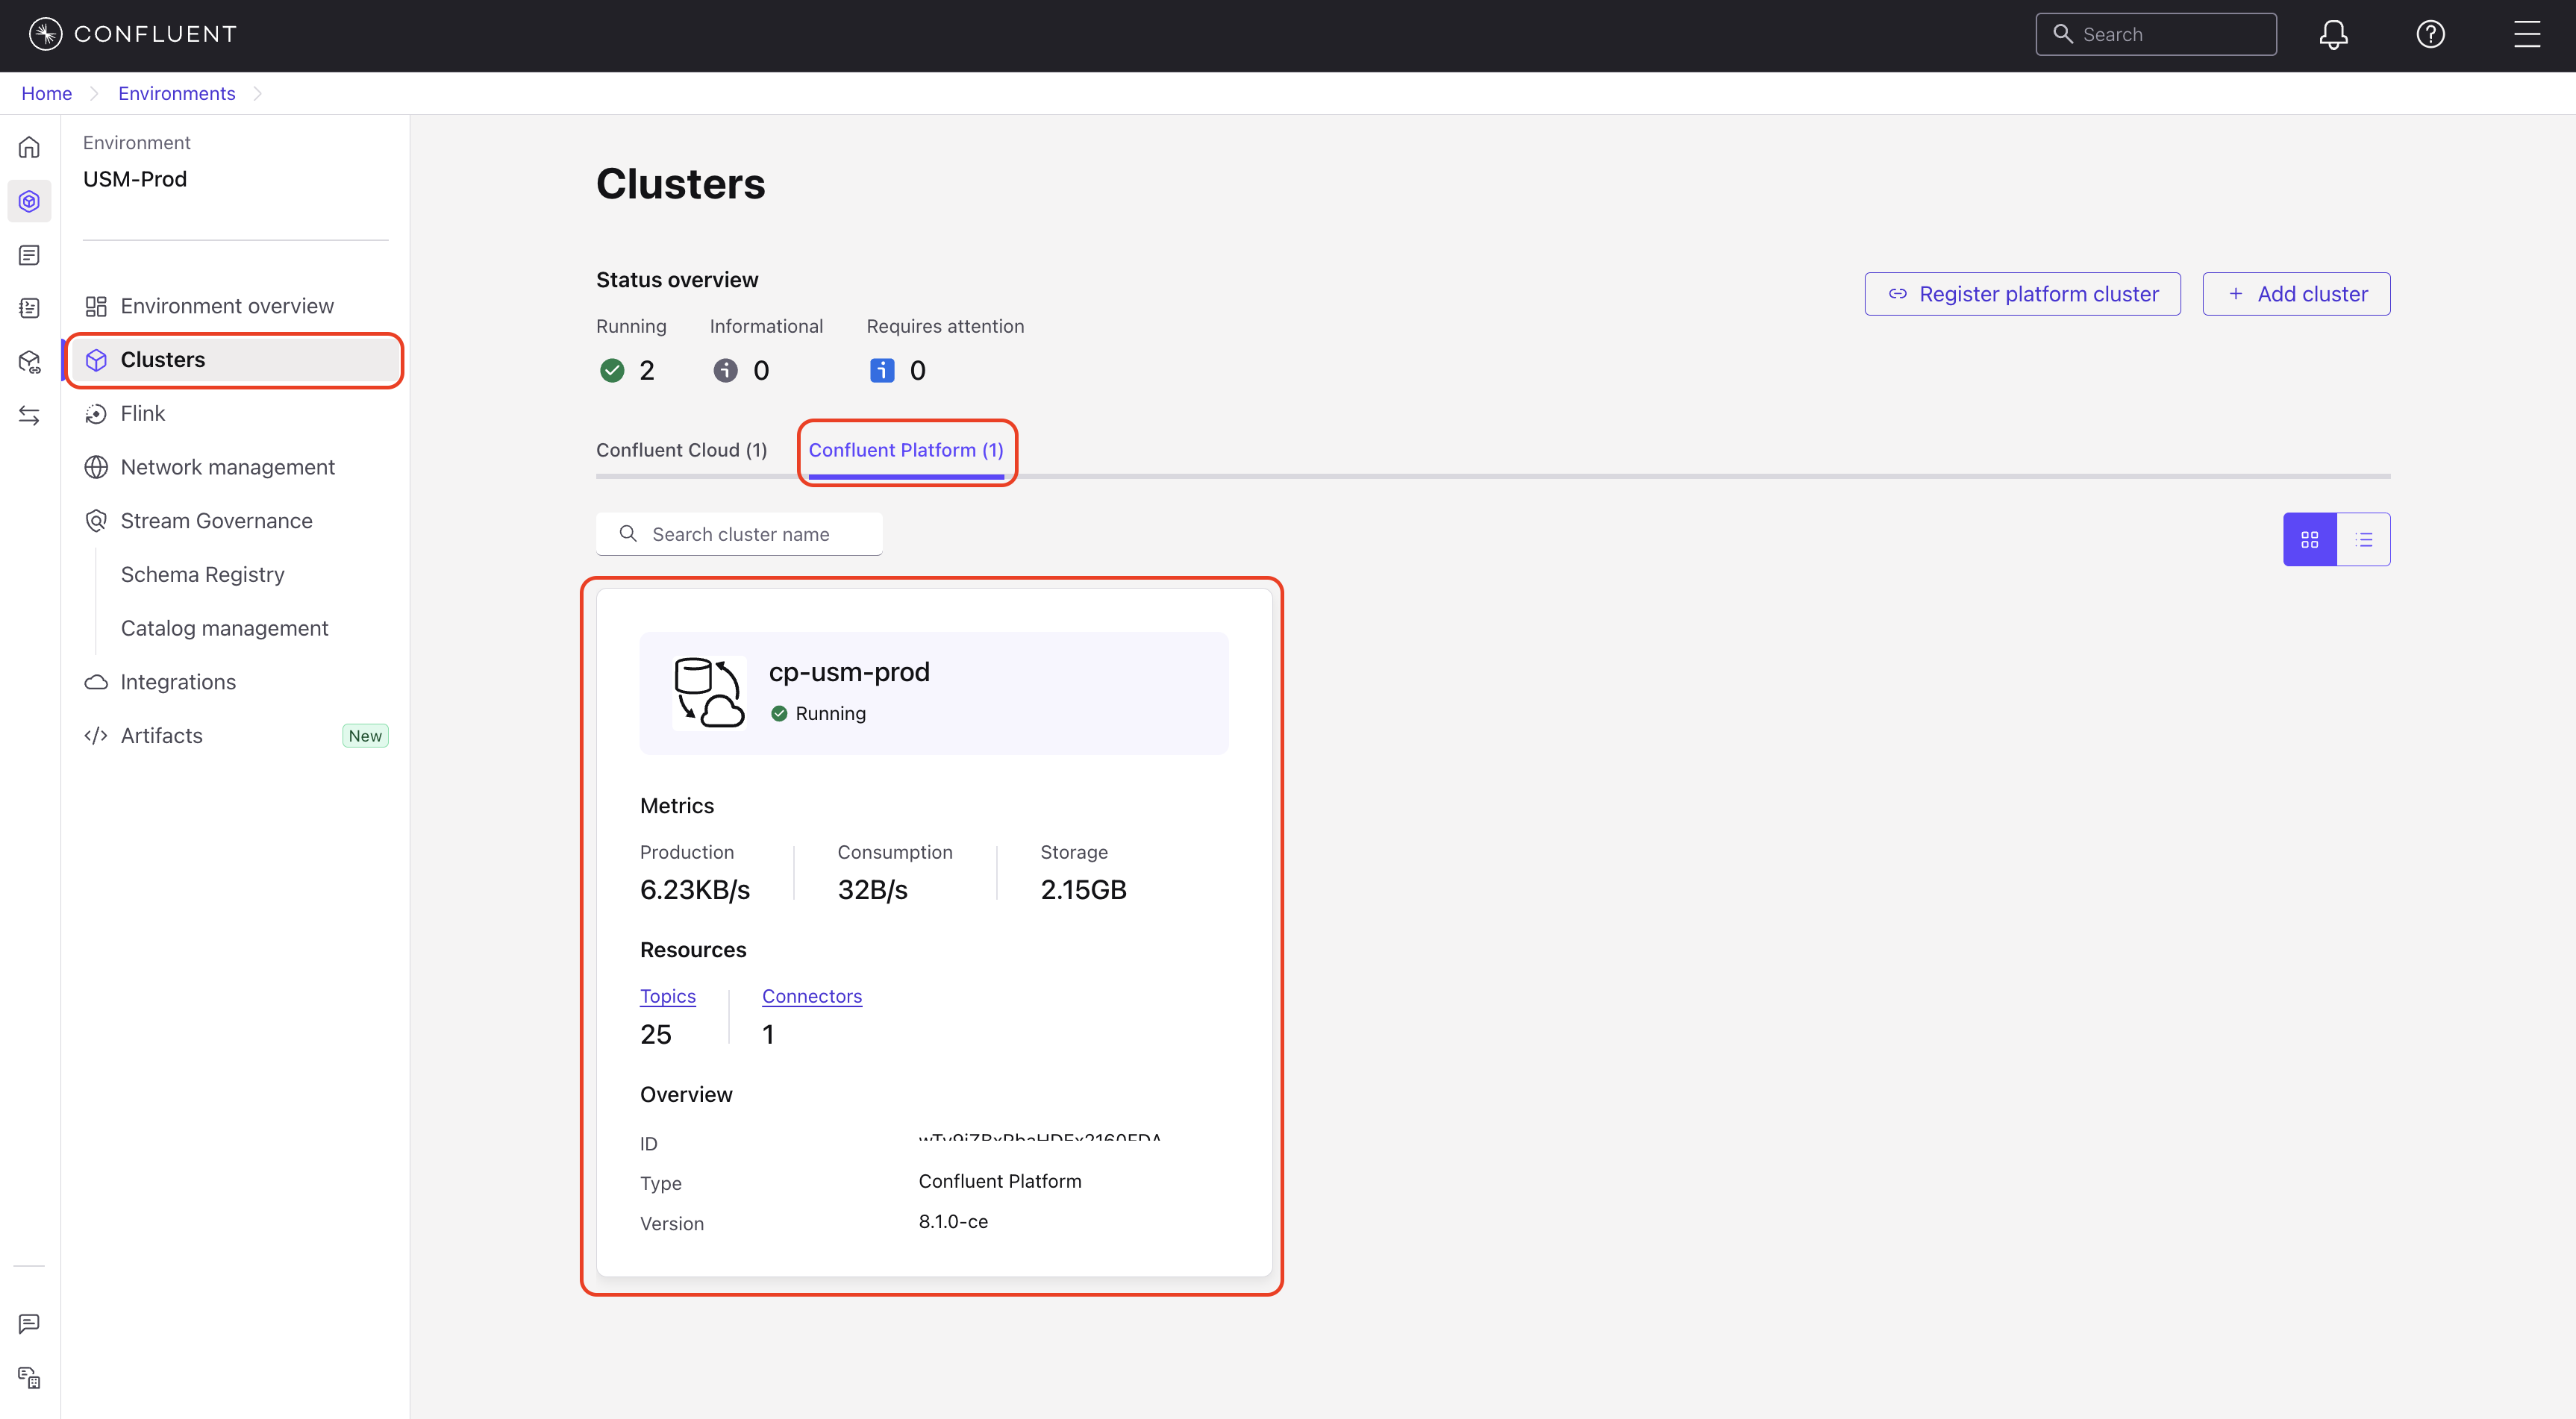
In the navigation menu, select Clusters, and then select your Confluent Platform cluster.
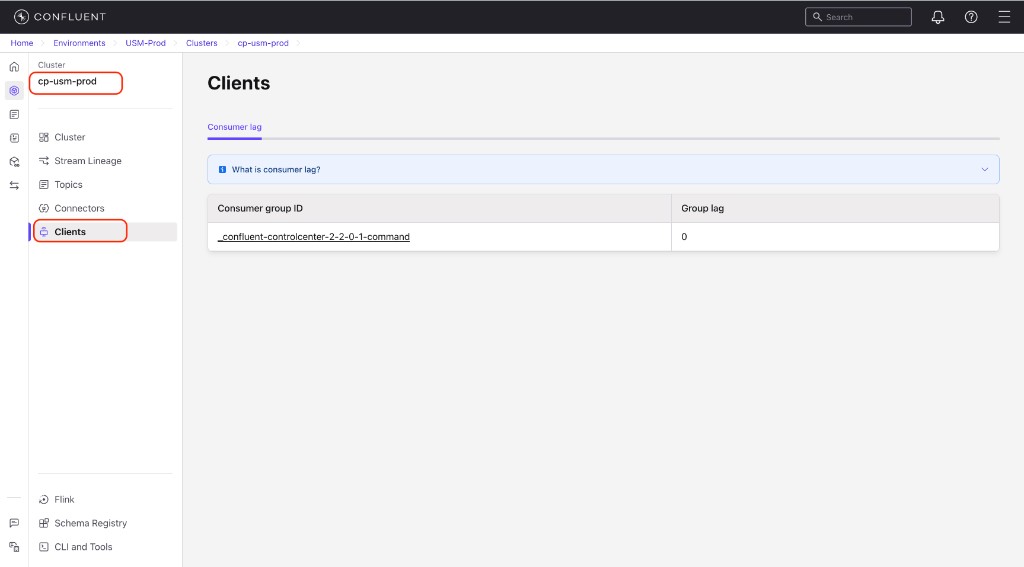
In the cluster’s navigation menu, select Clients. The Consumer lag tab appears by default.
The page shows a searchable and sortable list of up to 10,000 consumer groups. If your cluster has more than 10,000 consumer groups, a message prompts you to use the Confluent CLI to view additional groups. Some columns are only available on newer Confluent Platform versions, as noted in the following list. The list includes the following columns:
Consumer group ID: The unique identifier for the consumer group.
Status: The current state of the consumer group, such as
Stable,Empty, orDead. This column is only available for clusters running Confluent Platform version 8.2.2 or later.Protocol: The consumer group protocol, such as
ClassicorConsumer. This column is not available for clusters running Confluent Platform version 7.9.Group lag: The total number of messages the consumer group is behind.
Consumers: The number of active consumer instances in the group.
Topics: The number of topics the consumer group is consuming from.
Partitions: The number of partitions the consumer group is consuming from. This column is only available for clusters running Confluent Platform version 8.2.2 or later.
Use the search box to filter consumer groups by name. To sort the list, select a column header. You can also export the consumer group data to a CSV file.
Select a consumer group to view its specific lag details.
View consumer group lag details
After you select a consumer group, the detail view shows the following sections.
Summary metrics
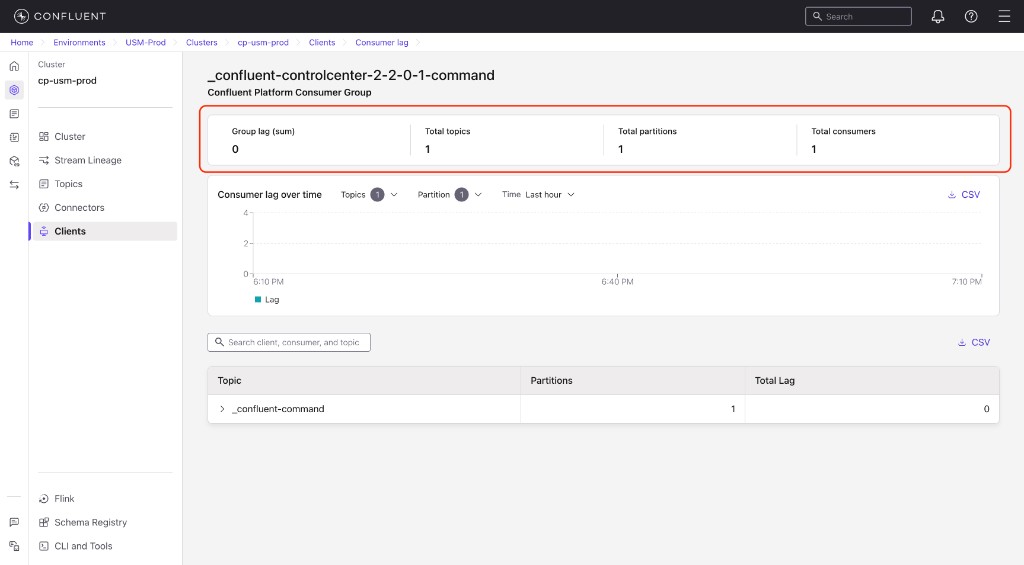
Group lag (sum): The total number of messages the consumer group is behind across all partitions.
Total topics: The number of topics the consumer group is consuming from.
Total partitions: The number of partitions across all topics the consumer group is consuming from.
Total consumers: The number of active consumer instances in the consumer group.
Consumer lag over time chart
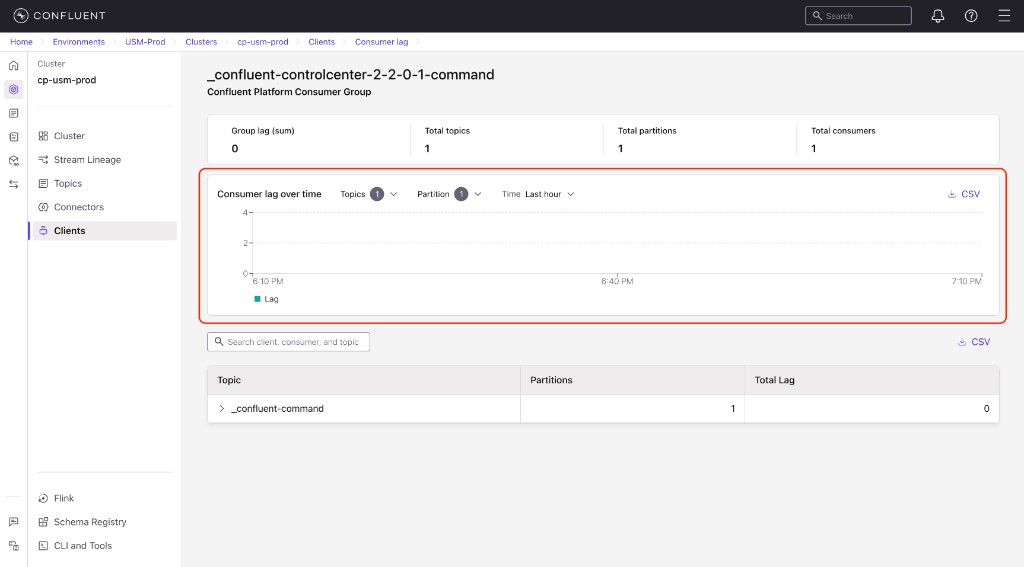
The Consumer lag over time chart shows how consumer lag changes for the selected group over time. The badge on each dropdown shows the number of items currently selected.
You can use these controls to filter the chart:
Topics: Select one or more topics to display in the chart. Each topic has a checkbox so you can compare lag across multiple topics.
Partition: Select one or more partitions to display in the chart. Each partition has a checkbox so you can isolate lag for specific partitions.
Time: Select a time range for the chart. Options include Last 10 minutes, Last hour, and Last 6 hours.
CSV: Export the chart data to a CSV file for offline analysis.
Topic and partition details
The details table provides a per-topic breakdown of consumer lag.
Topic: The name of the Kafka topic.
Partitions: The number of partitions for that topic.
Total Lag: The total consumer lag across all partitions for that topic.
To view per-partition details, click the expand arrow on a topic row.
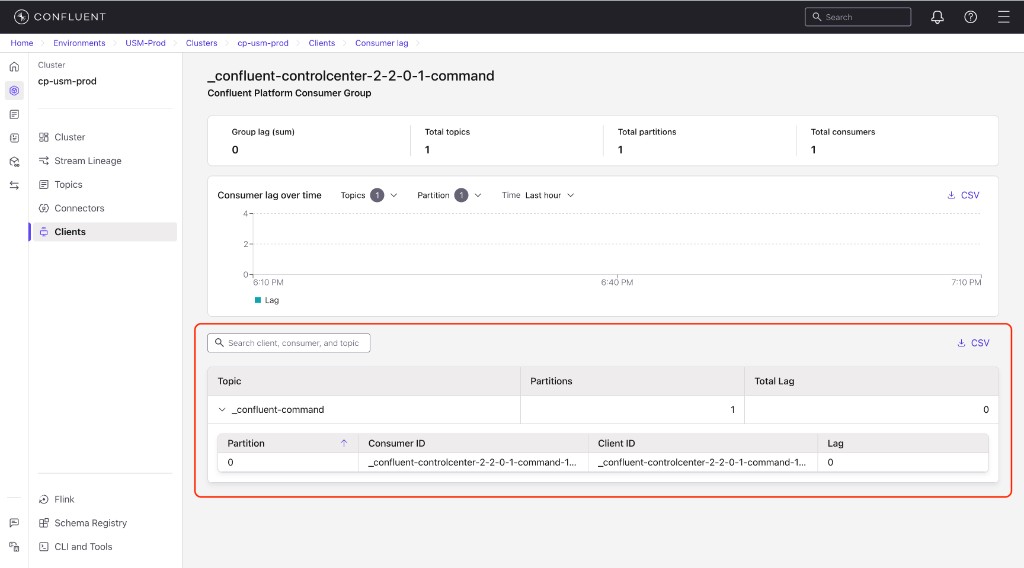
The expanded row shows the following columns:
Partition: The partition number within the topic.
Consumer ID: The identifier of the consumer assigned to this partition.
Client ID: The client identifier for the consumer instance.
Lag: The consumer lag for this specific partition.