
Monitor Confluent Platform Topics with USM
You can use USM to view Kafka topics and monitor throughput, consumer groups, data contracts, and configurations for registered Confluent Platform clusters in the Confluent Cloud Console. To discover and search for topics, see Stream Catalog on Confluent Cloud: User Guide to Manage Tags and Metadata and Data Portal on Confluent Cloud.
You can use the Topics page to monitor the activity and details of all topics in the selected Confluent Platform cluster.
Configure topic reporting for large clusters
If a Confluent Platform cluster contains a large number of topics, the default packet size used to send the topic list to Confluent Cloud might be insufficient. An insufficient packet size can cause the total topic count in the Confluent Cloud Console to appear inaccurate or fluctuate.
To prevent inaccurate topic counts, increase the maximum snapshot size on the Confluent Platform controllers:
The
confluent.catalog.collector.max.bytes.per.snapshotproperty increases the maximum packet size to 2 MB to allow a larger topic list to be sent in a single snapshot.The
confluent.telemetry.exporter._usm.events.request.timeout.msproperty increases the event exporter request timeout to 180,000 ms (3 minutes) to prevent failures when exporting telemetry data from large clusters.
Apply these settings using the method that matches your cluster management.
For Confluent for Kubernetes deployments
In the Confluent Platform cluster resource YAML file, add the following
configOverridesproperties to thespecsection:spec: configOverrides: server: - confluent.catalog.collector.max.bytes.per.snapshot: 2000000 - confluent.telemetry.exporter._usm.events.request.timeout.ms: 180000
Apply the configuration change to trigger a rolling restart of the controllers:
kubectl apply -f <your-confluent-platform.yaml>
For Ansible Playbooks for Confluent Platform deployments
In the Confluent Ansible variables file, such as
hosts.yml, add the following properties under theall.vars.kafka_controller_custom_properties:all: vars: kafka_controller_custom_properties: confluent.catalog.collector.max.bytes.per.snapshot: 2000000 confluent.telemetry.exporter._usm.events.request.timeout.ms: 180000
Run your Confluent Ansible playbook to apply the changes.
For manual installations
On each Confluent Platform controller host, open the
server.propertiesfile for editing.Add the following properties and set their values:
confluent.catalog.collector.max.bytes.per.snapshot=2000000
confluent.telemetry.exporter._usm.events.request.timeout.ms=180000
Restart your controllers for the configuration change to take effect.
After the controllers restart, the topic count in the Confluent Cloud Console stabilizes and accurately reflects the number of topics in the cluster.
Note
You can use the Confluent Cloud Console to monitor Confluent Platform topics only. To create, delete, or manage these topics, use Confluent Control Center for the self-managed cluster.
View the topics list
In the Confluent Cloud Console, navigate to Environments and select your environment.
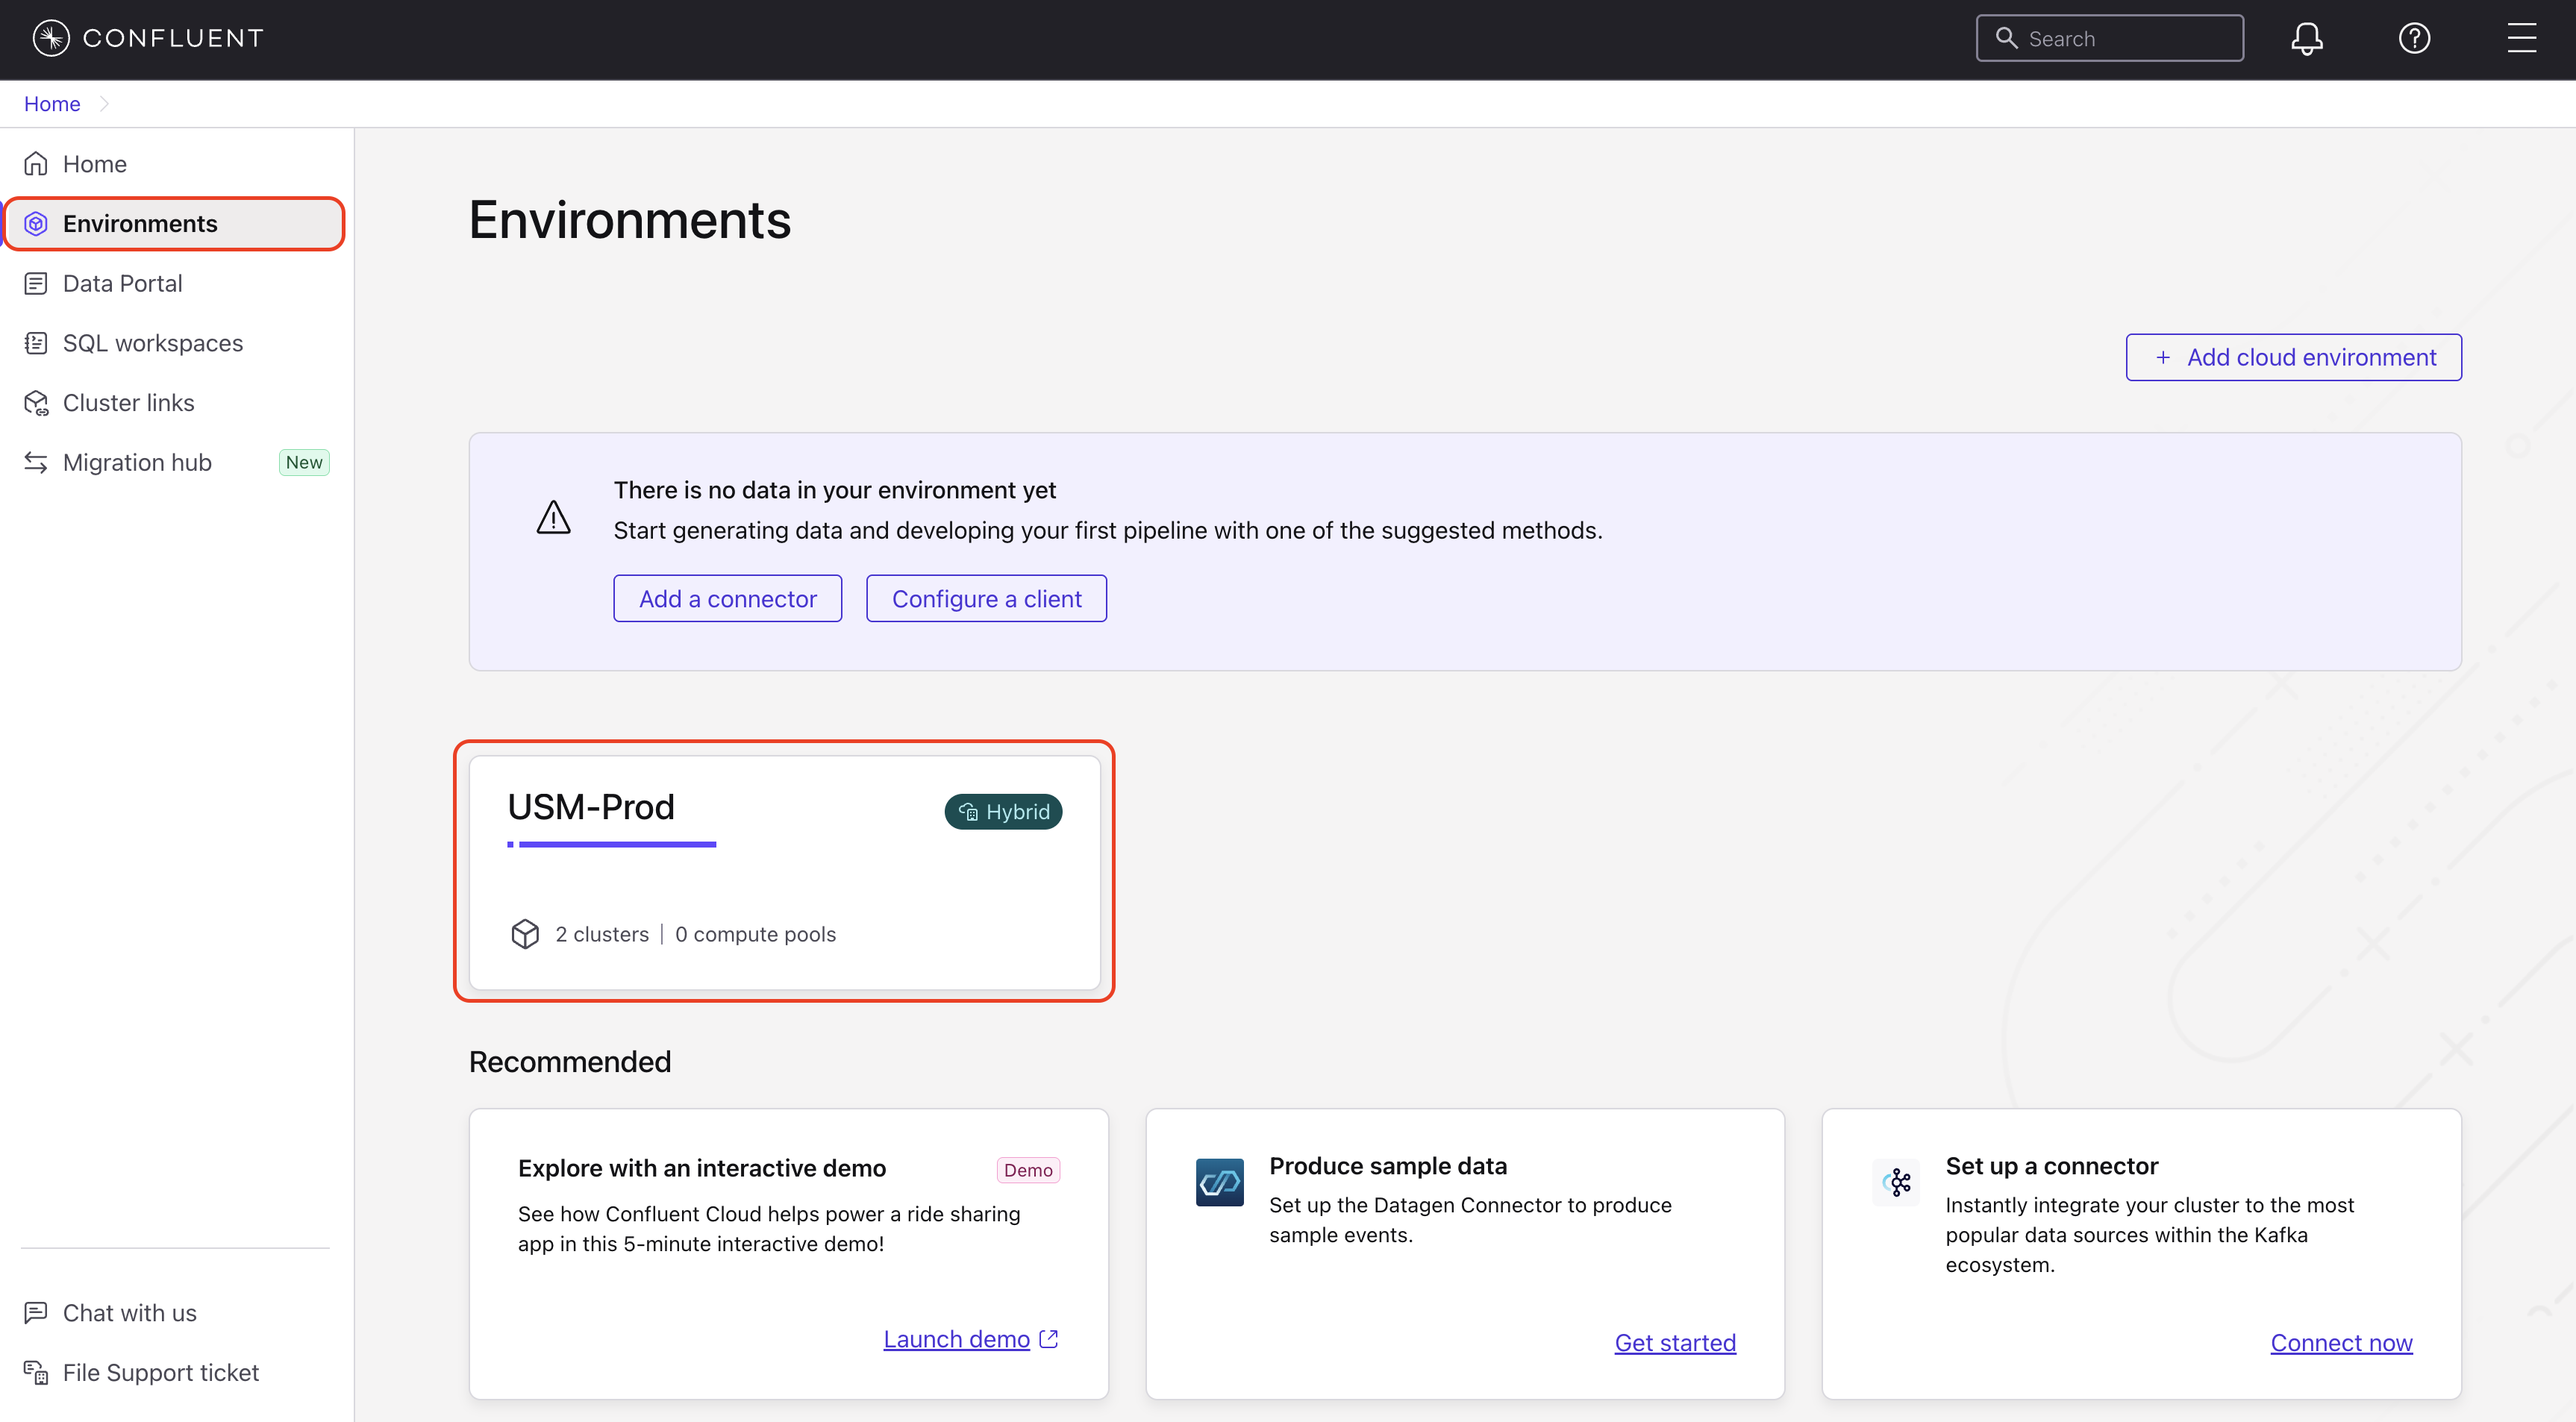
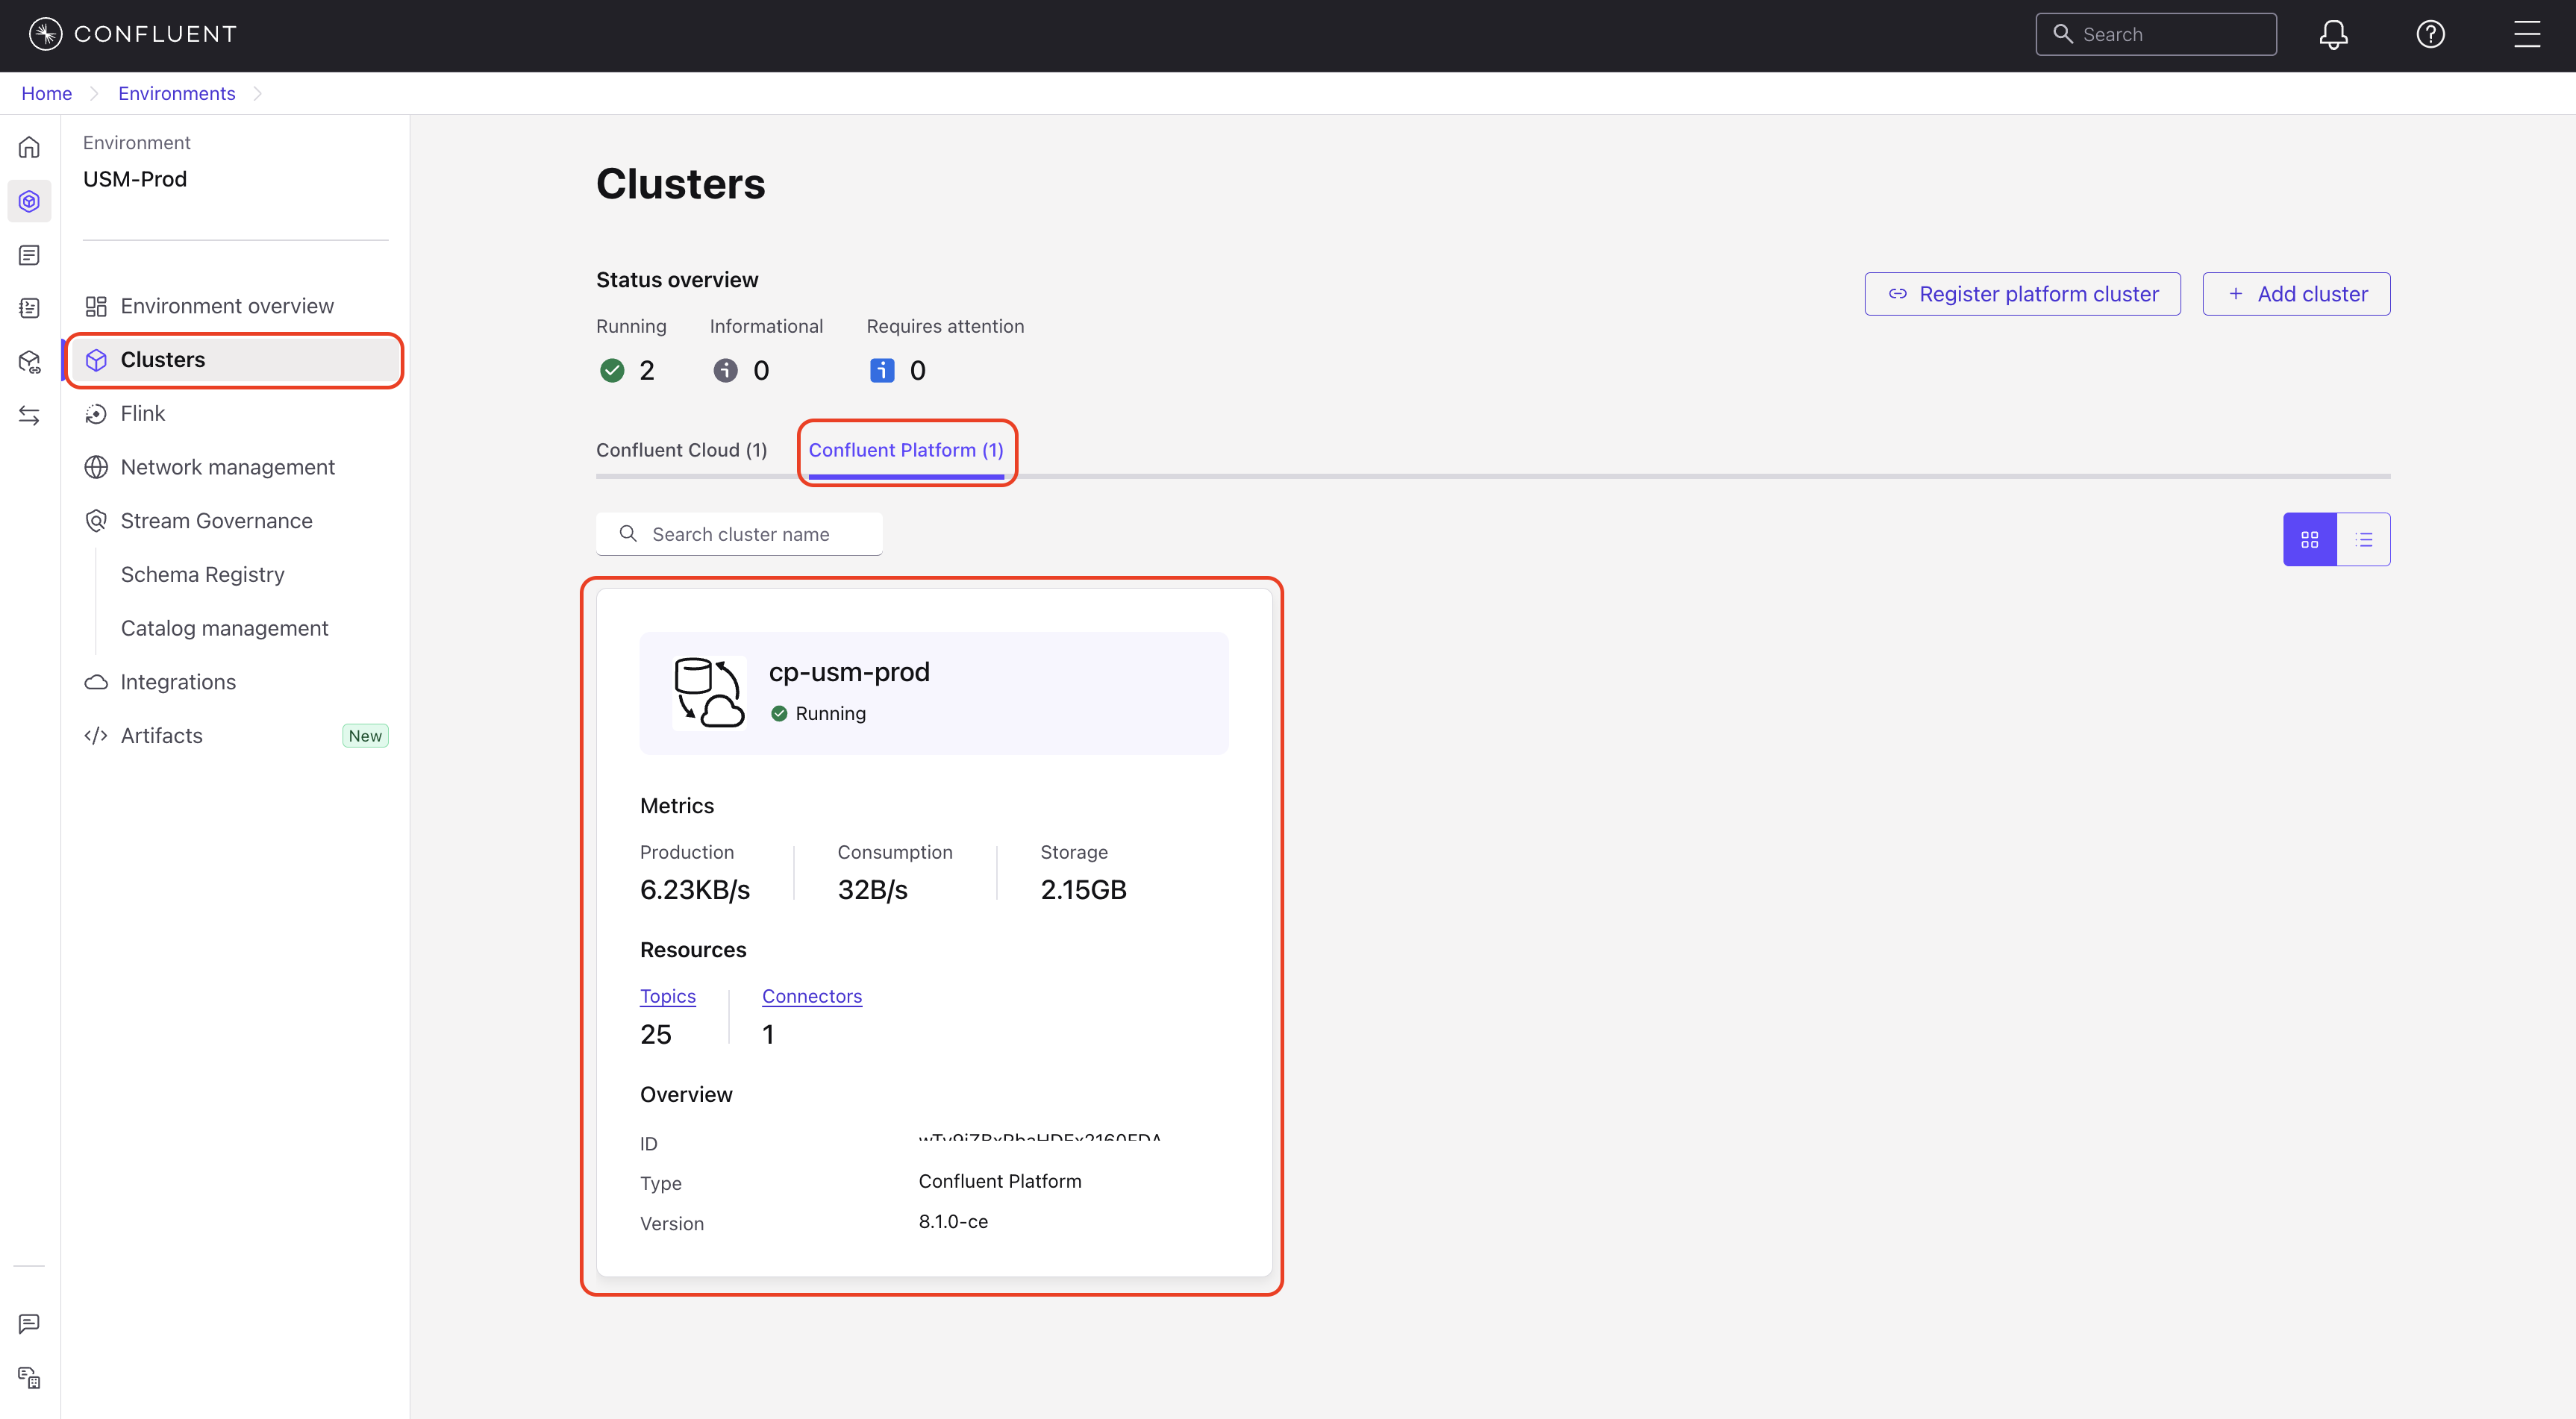
In the navigation menu, click Clusters and select a Confluent Platform cluster.
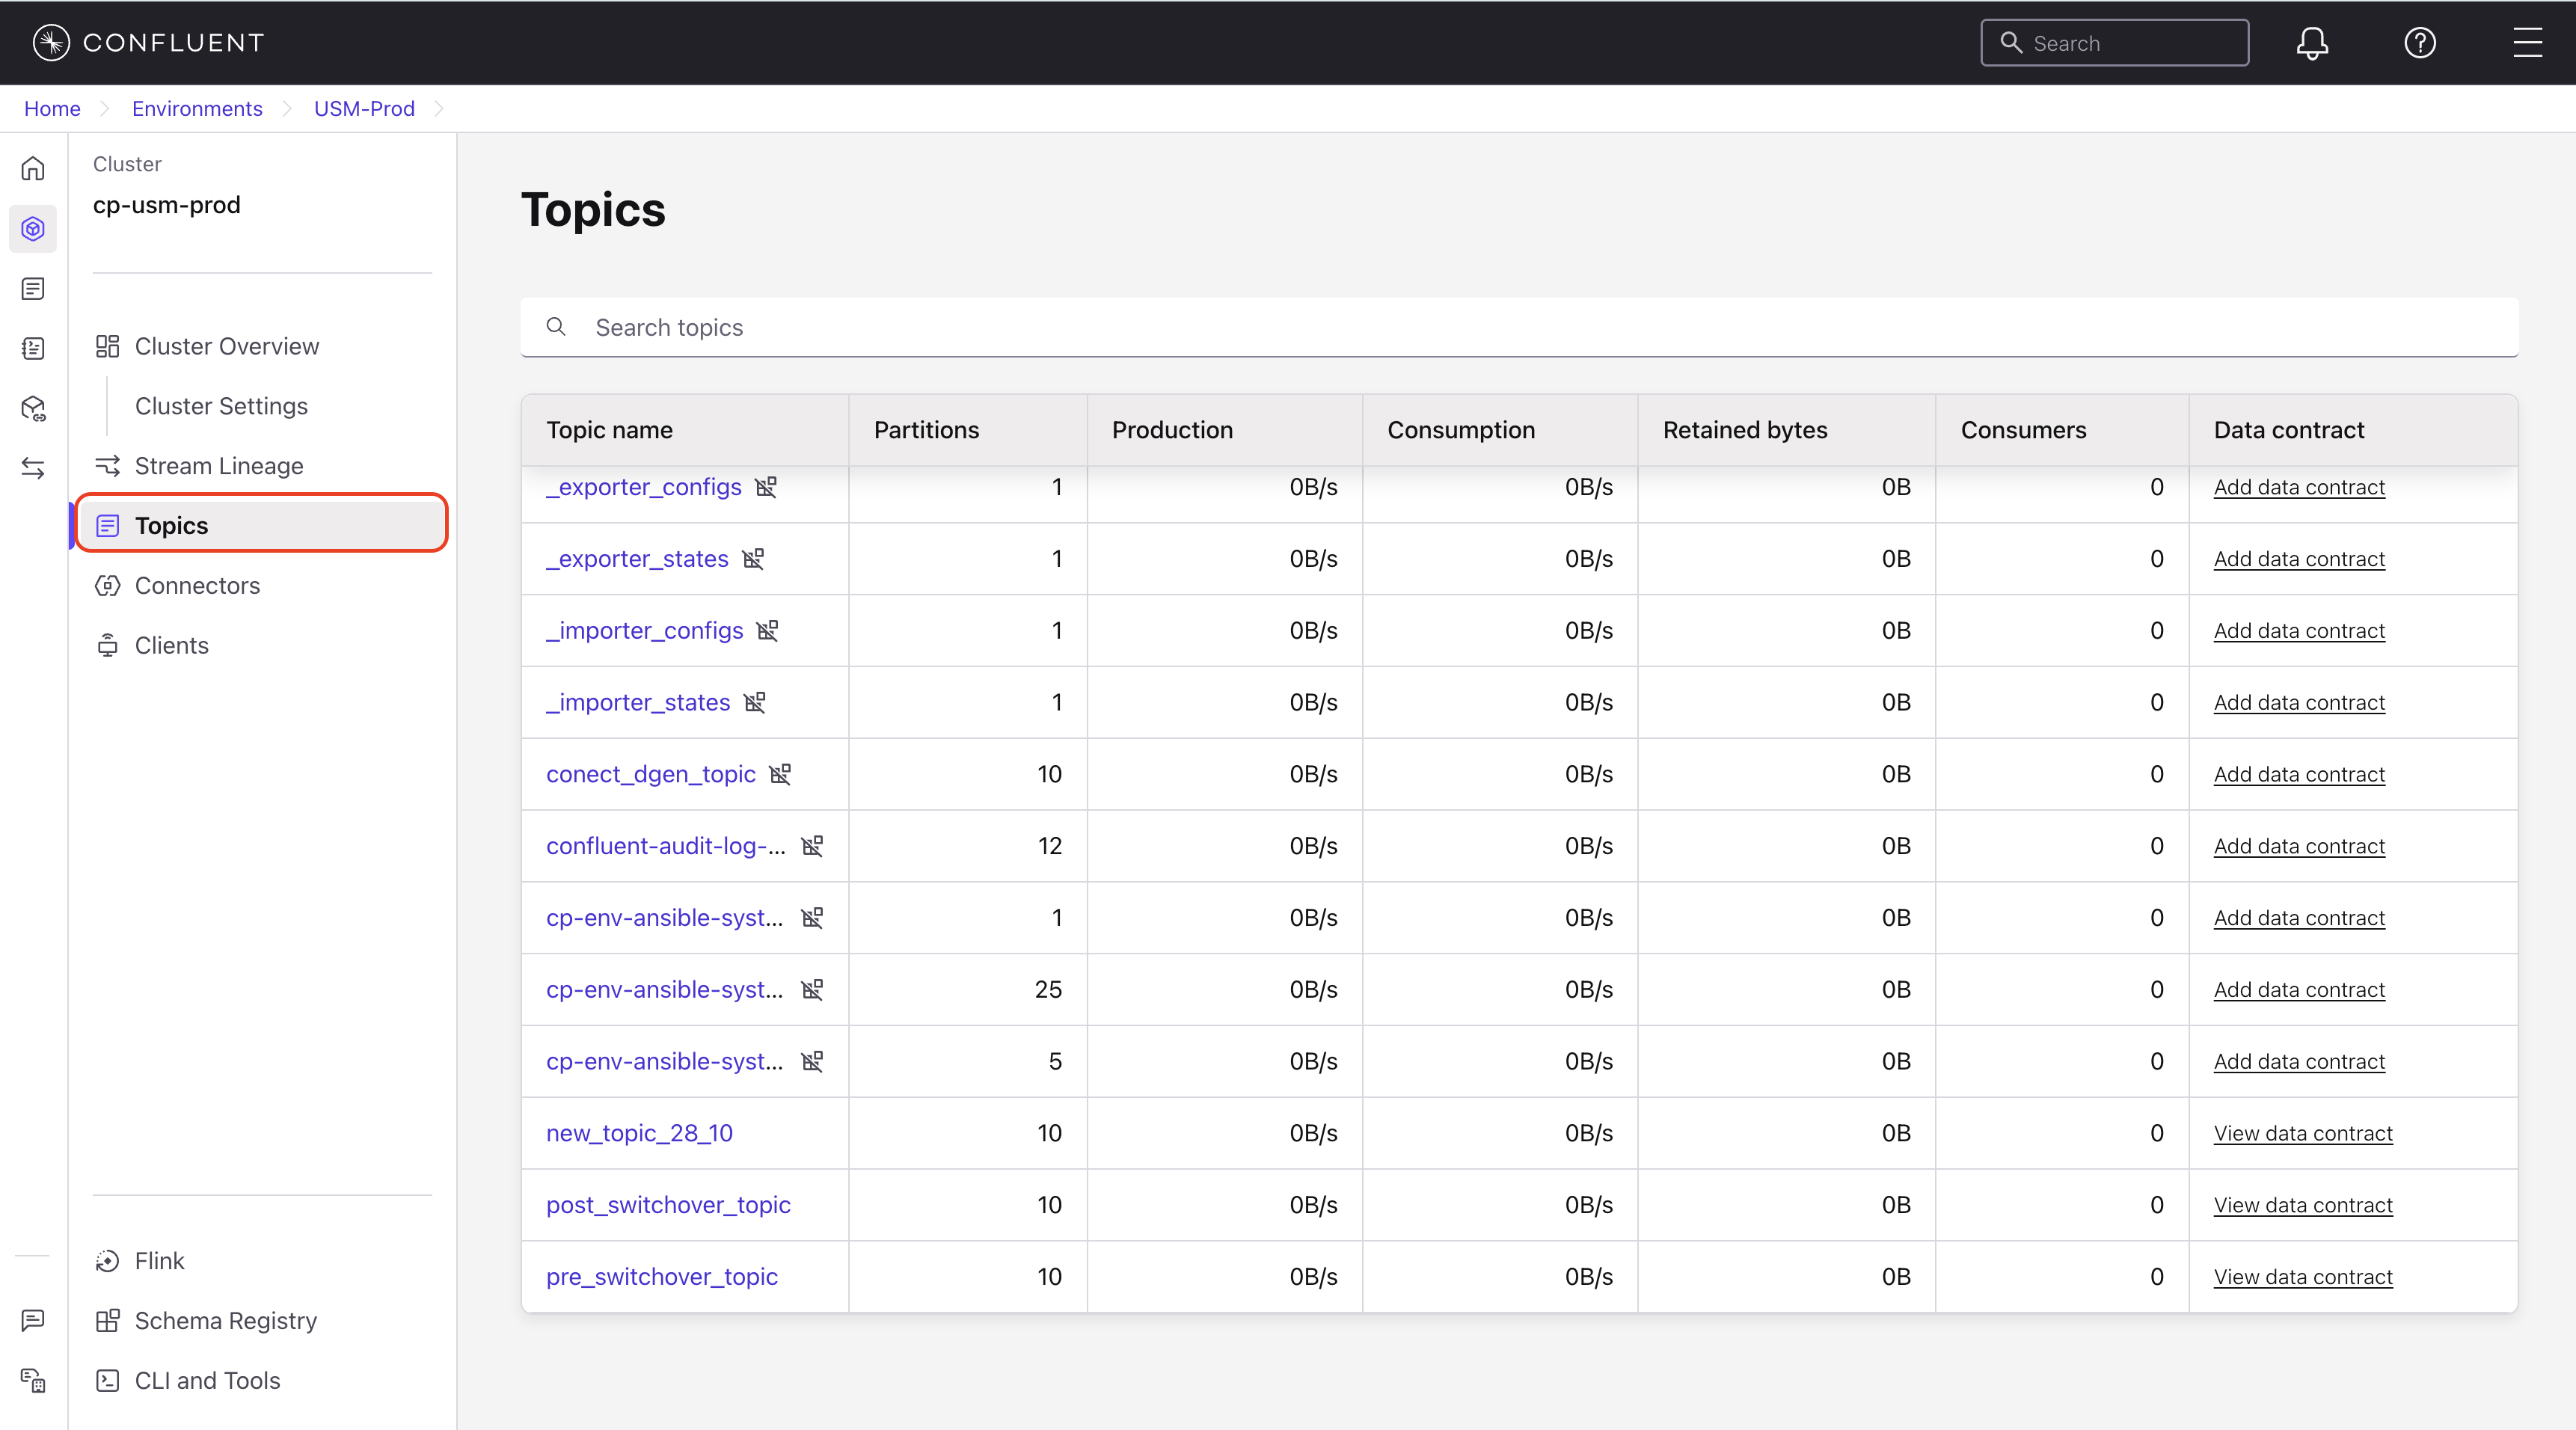
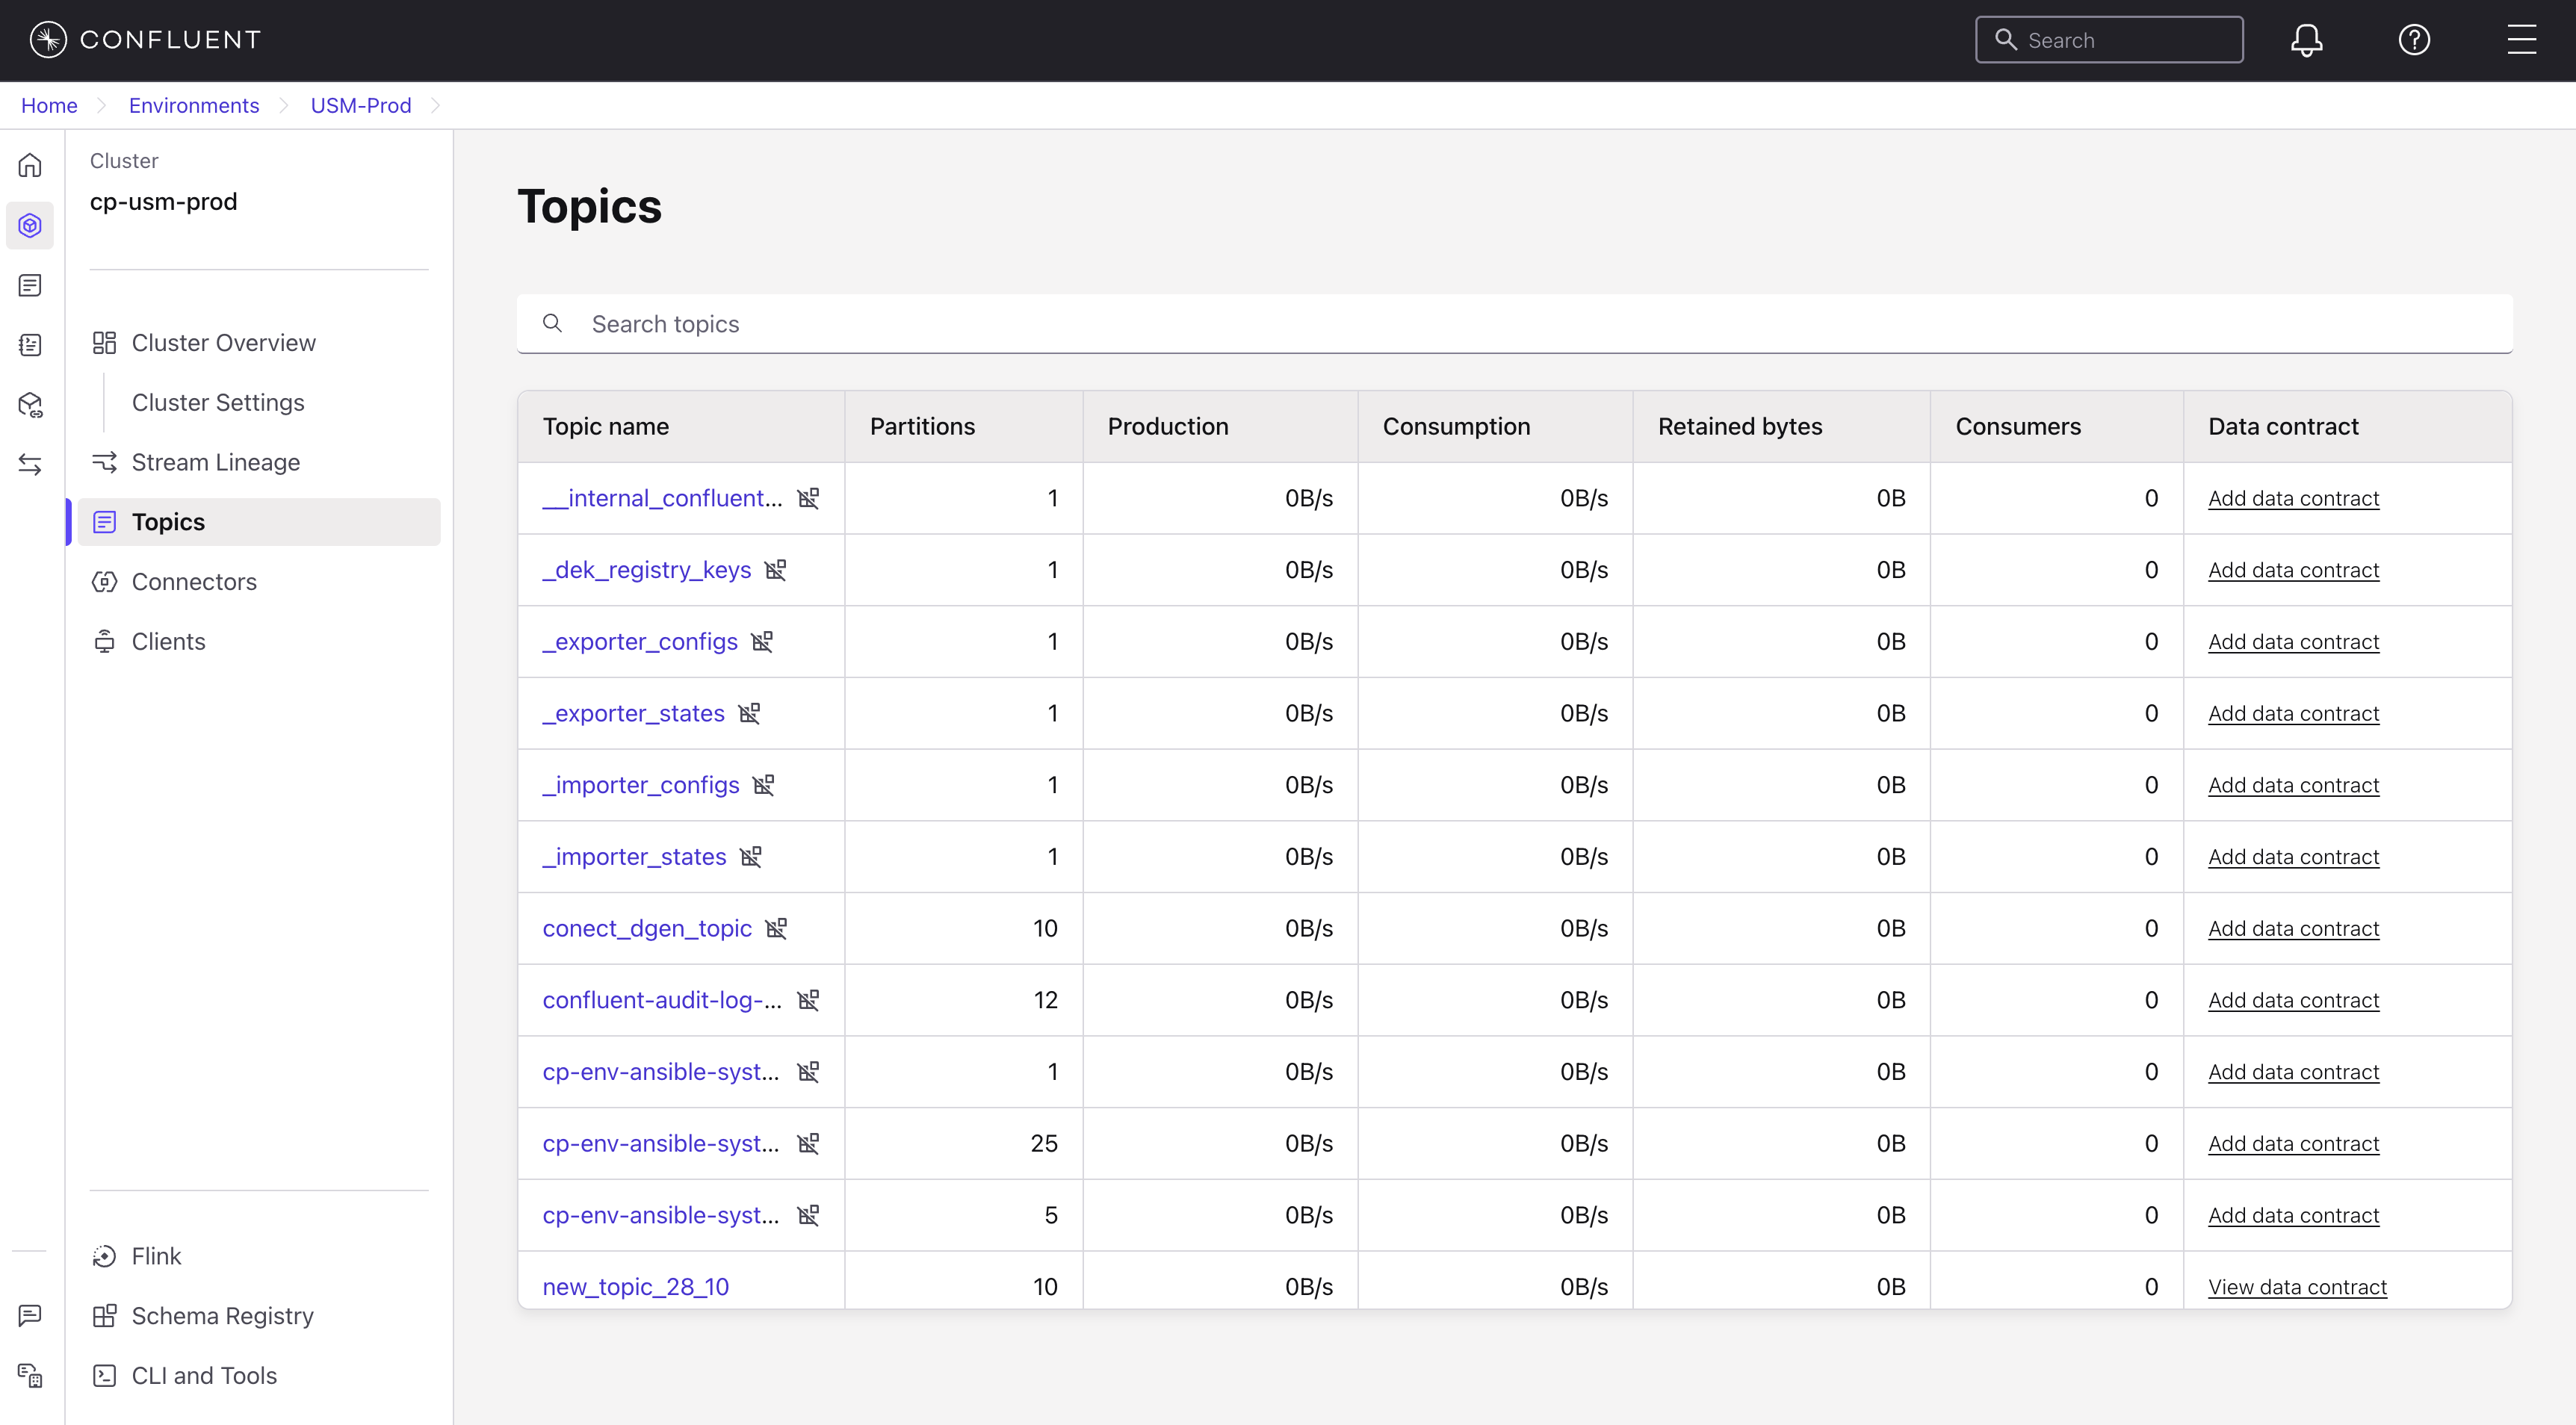
In the navigation menu, click Topics.
Understand the topics list
The Topics page provides a centralized view for all topics in your selected cluster. You can search for a topic by name using the search bar. You can use the Hide internal topics toggle to show or hide internal topics. The names of internal topics start with an underscore (_).
The table displays the following fields for each topic:
Topic name: The unique identifier for the topic.
Partitions: The number of partitions configured for the topic.
Production: The rate of data written to the topic, in bytes per second.
Consumption: The rate of data read from the topic, in bytes per second.
Retained bytes: The total size of data in the logs for the topic.
Consumers: The number of active consumer groups that read from the topic.
Data contract: A link to the schema and data rules for the topic.
View individual topic details
To inspect the metrics, data contract, configuration, and metadata for a specific topic, select it from the topics list. This opens a detailed view with five tabs: Overview, Monitor, Data contract, Settings, and Details.
Overview tab
The Overview tab provides a summary of the key metrics and stream lineage for the topic.
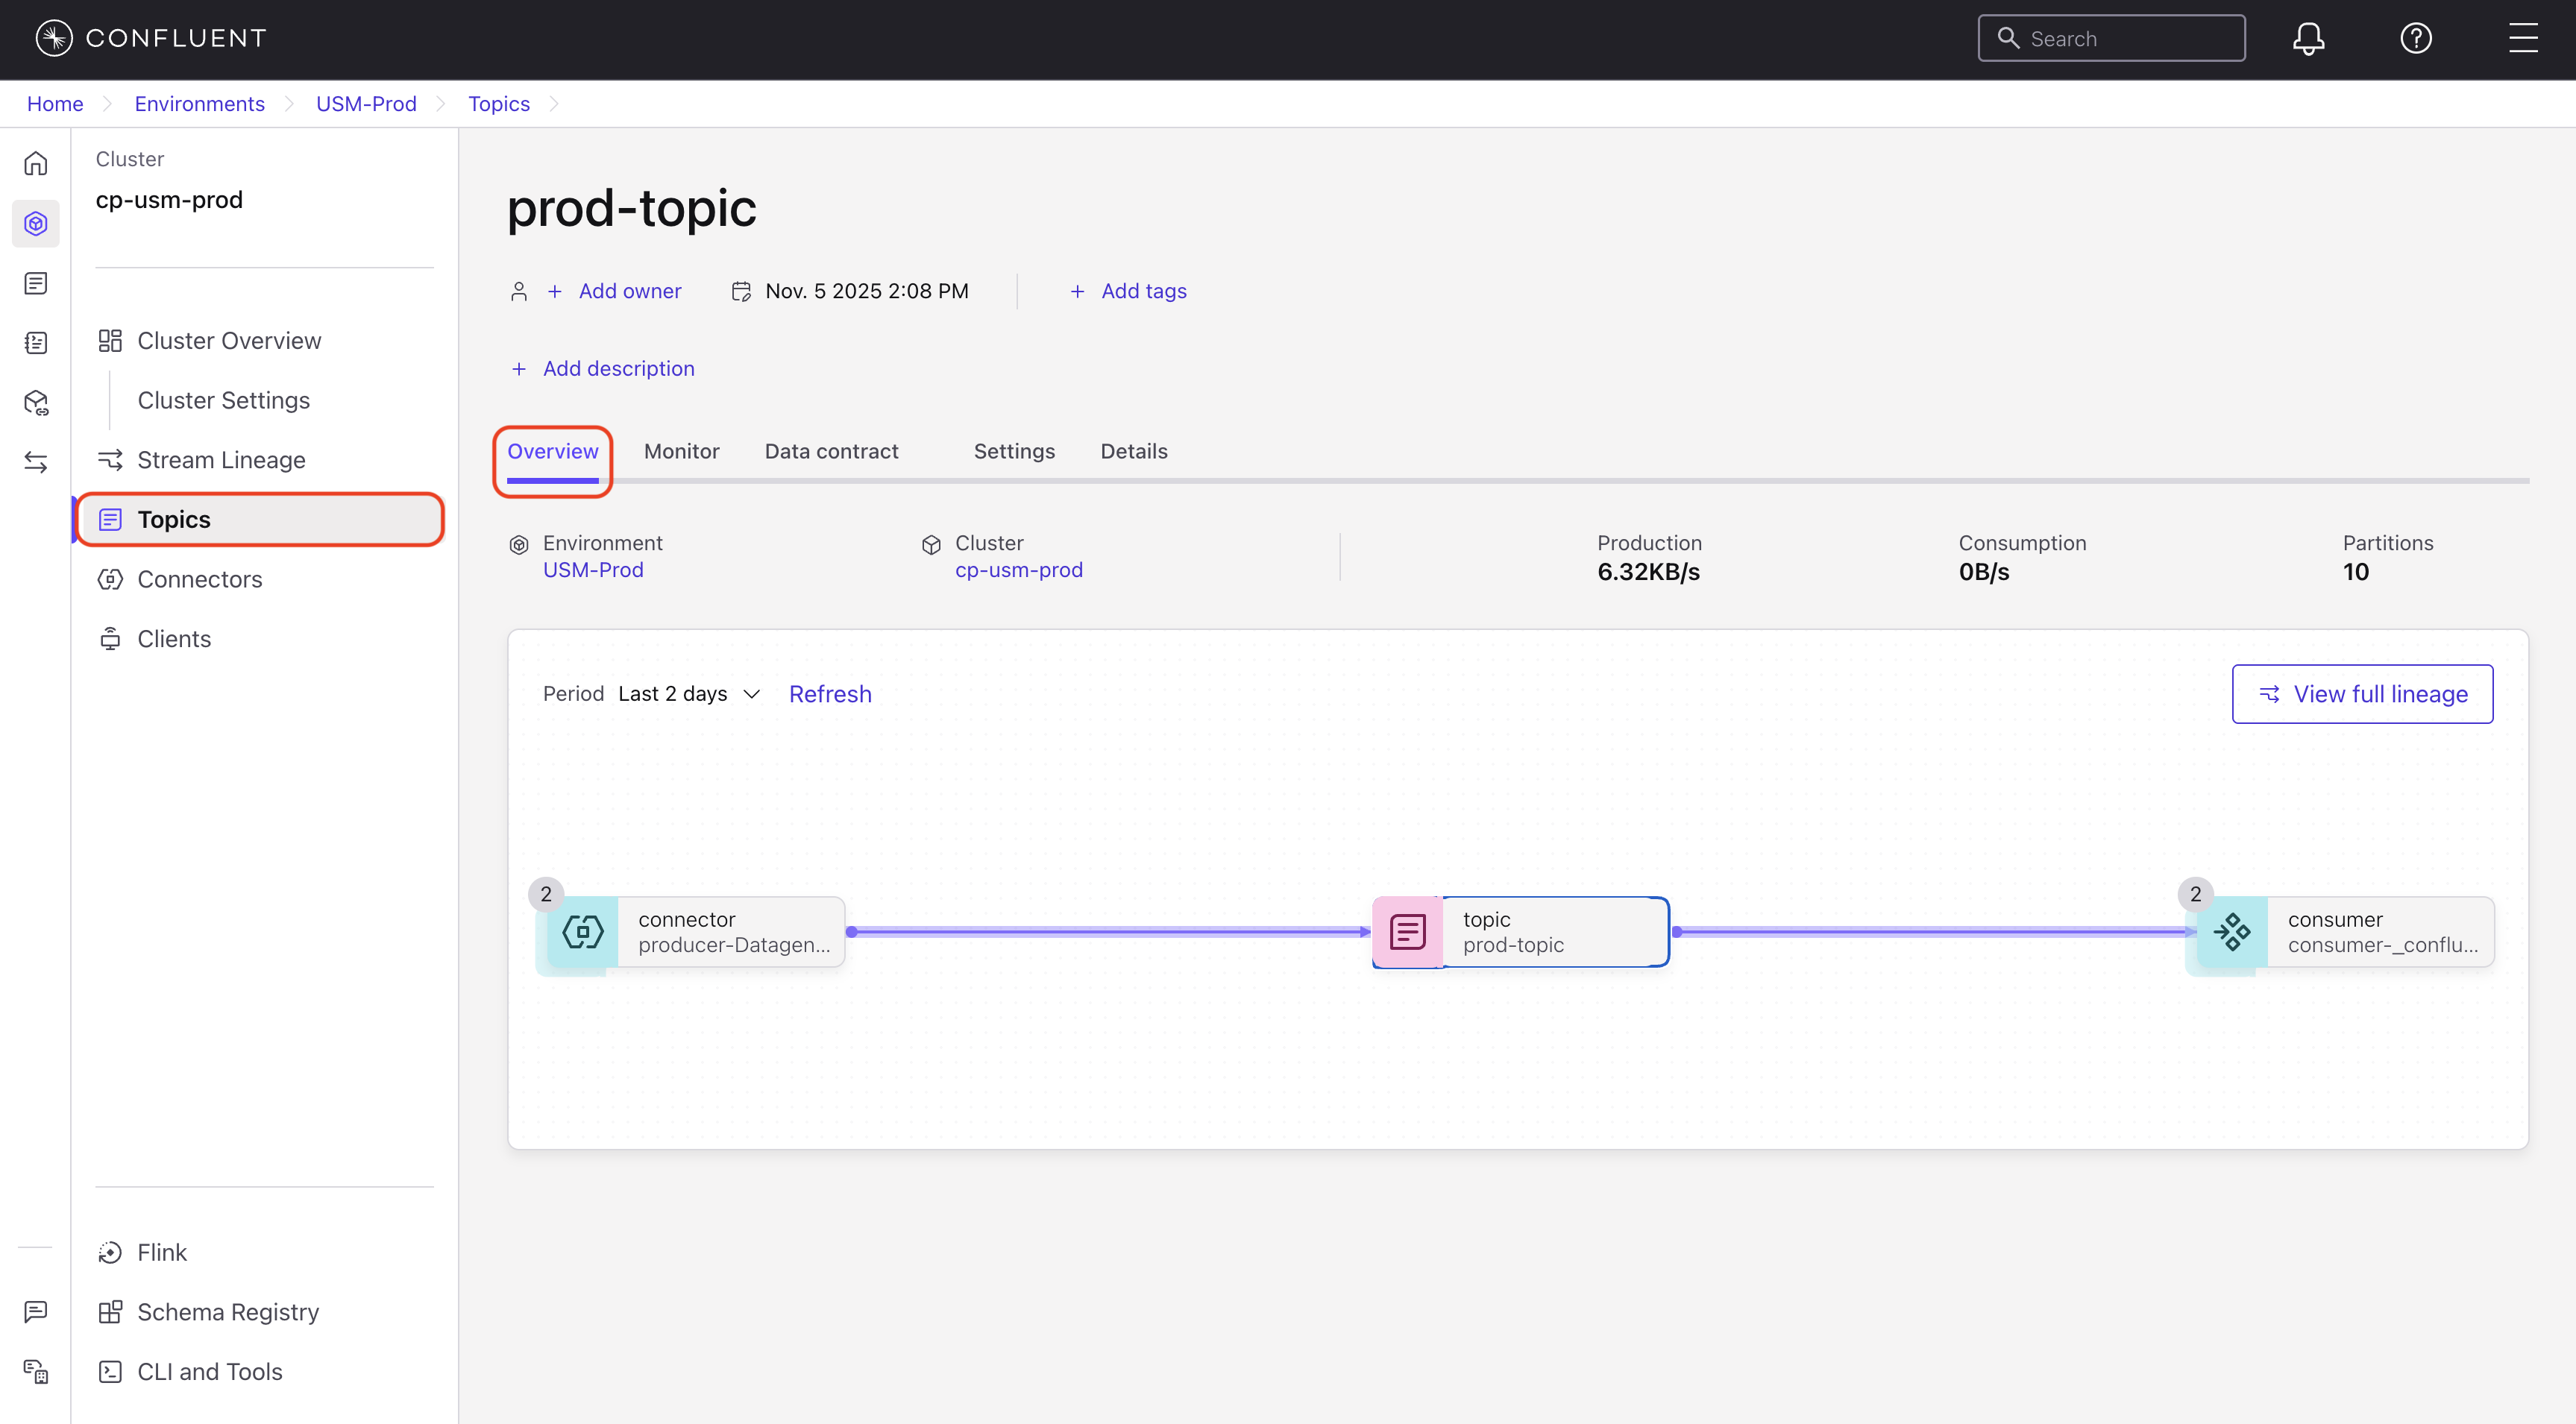
The tab displays the following information:
Environment: The environment where the topic is registered.
Cluster: The Confluent Platform cluster where the topic resides.
Production: The rate of data written to the topic.
Consumption: The rate of data read from the topic.
Partitions: The number of partitions configured for the topic.
Total messages: The total number of messages in the topic.
The Overview tab includes a Stream Lineage visualization that shows the data flow for the topic. To open the complete lineage diagram, click View full lineage. For more information, see Track Data with Stream Lineage on Confluent Cloud.
Monitor tab
The Monitor tab provides historical throughput graphs for the message flow of the selected topic. The displayed data corresponds to the time range that you select from the dropdown menu.
Production: The rate of data written to the topic.
Consumption: The rate of data read from the topic.
Data contract tab
The Data contract tab defines the schema and rules for the data published to the topic to ensure data quality and compatibility. The tab displays the schema, references, metadata, and any rules applied to the data.
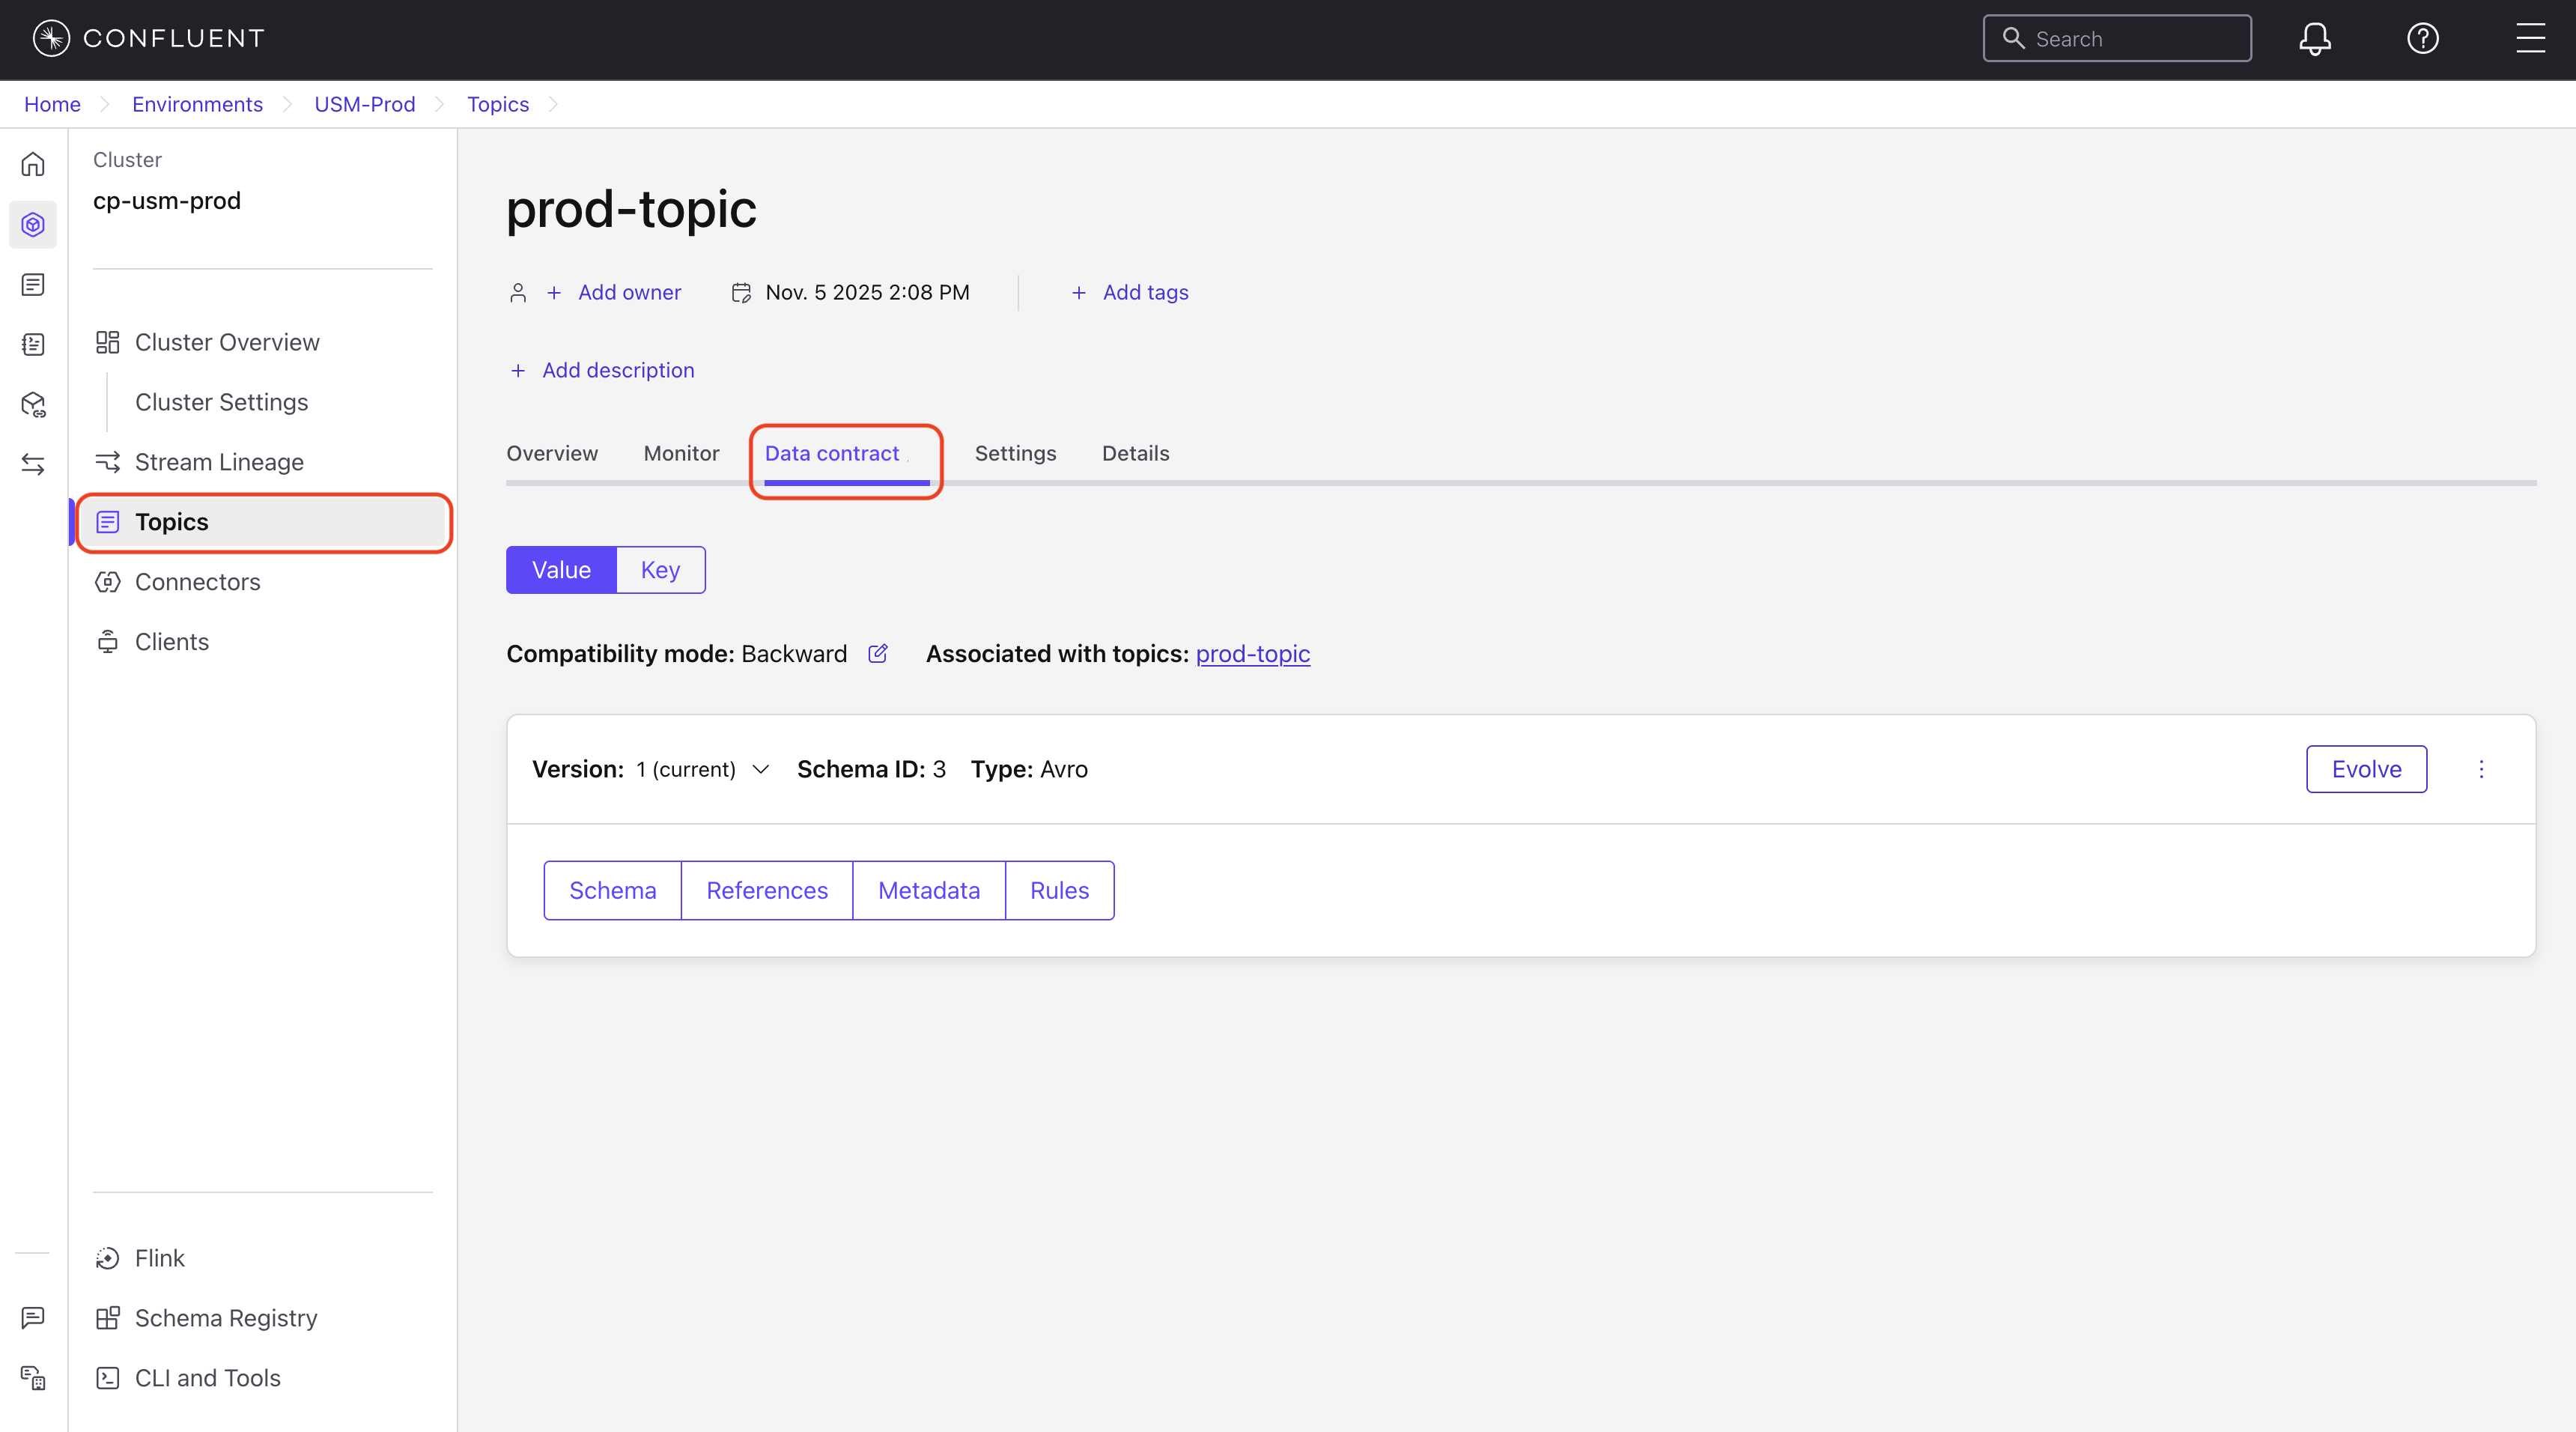
If a data contract does not exist, click Create data contract to add one. For instructions, see Create a schema (data contract).
The Data contract tab displays the following specifications:
Schema: The JSON schema for the messages in the topic. The schema defines the structure and data types.
References: A list of external schema references.
Metadata: Additional metadata about the schema.
Rules: The rules or validations applied to the data.
To view topic data contracts, follow these steps:
In the Confluent Cloud Console, navigate to Environments and select your environment.
In the navigation menu, click Clusters and select a Confluent Platform cluster.
In the navigation menu, click Topics.
Select a topic from the list of topics.
Click Data contract.
The Data contract tab displays the schema and rules for the topic.
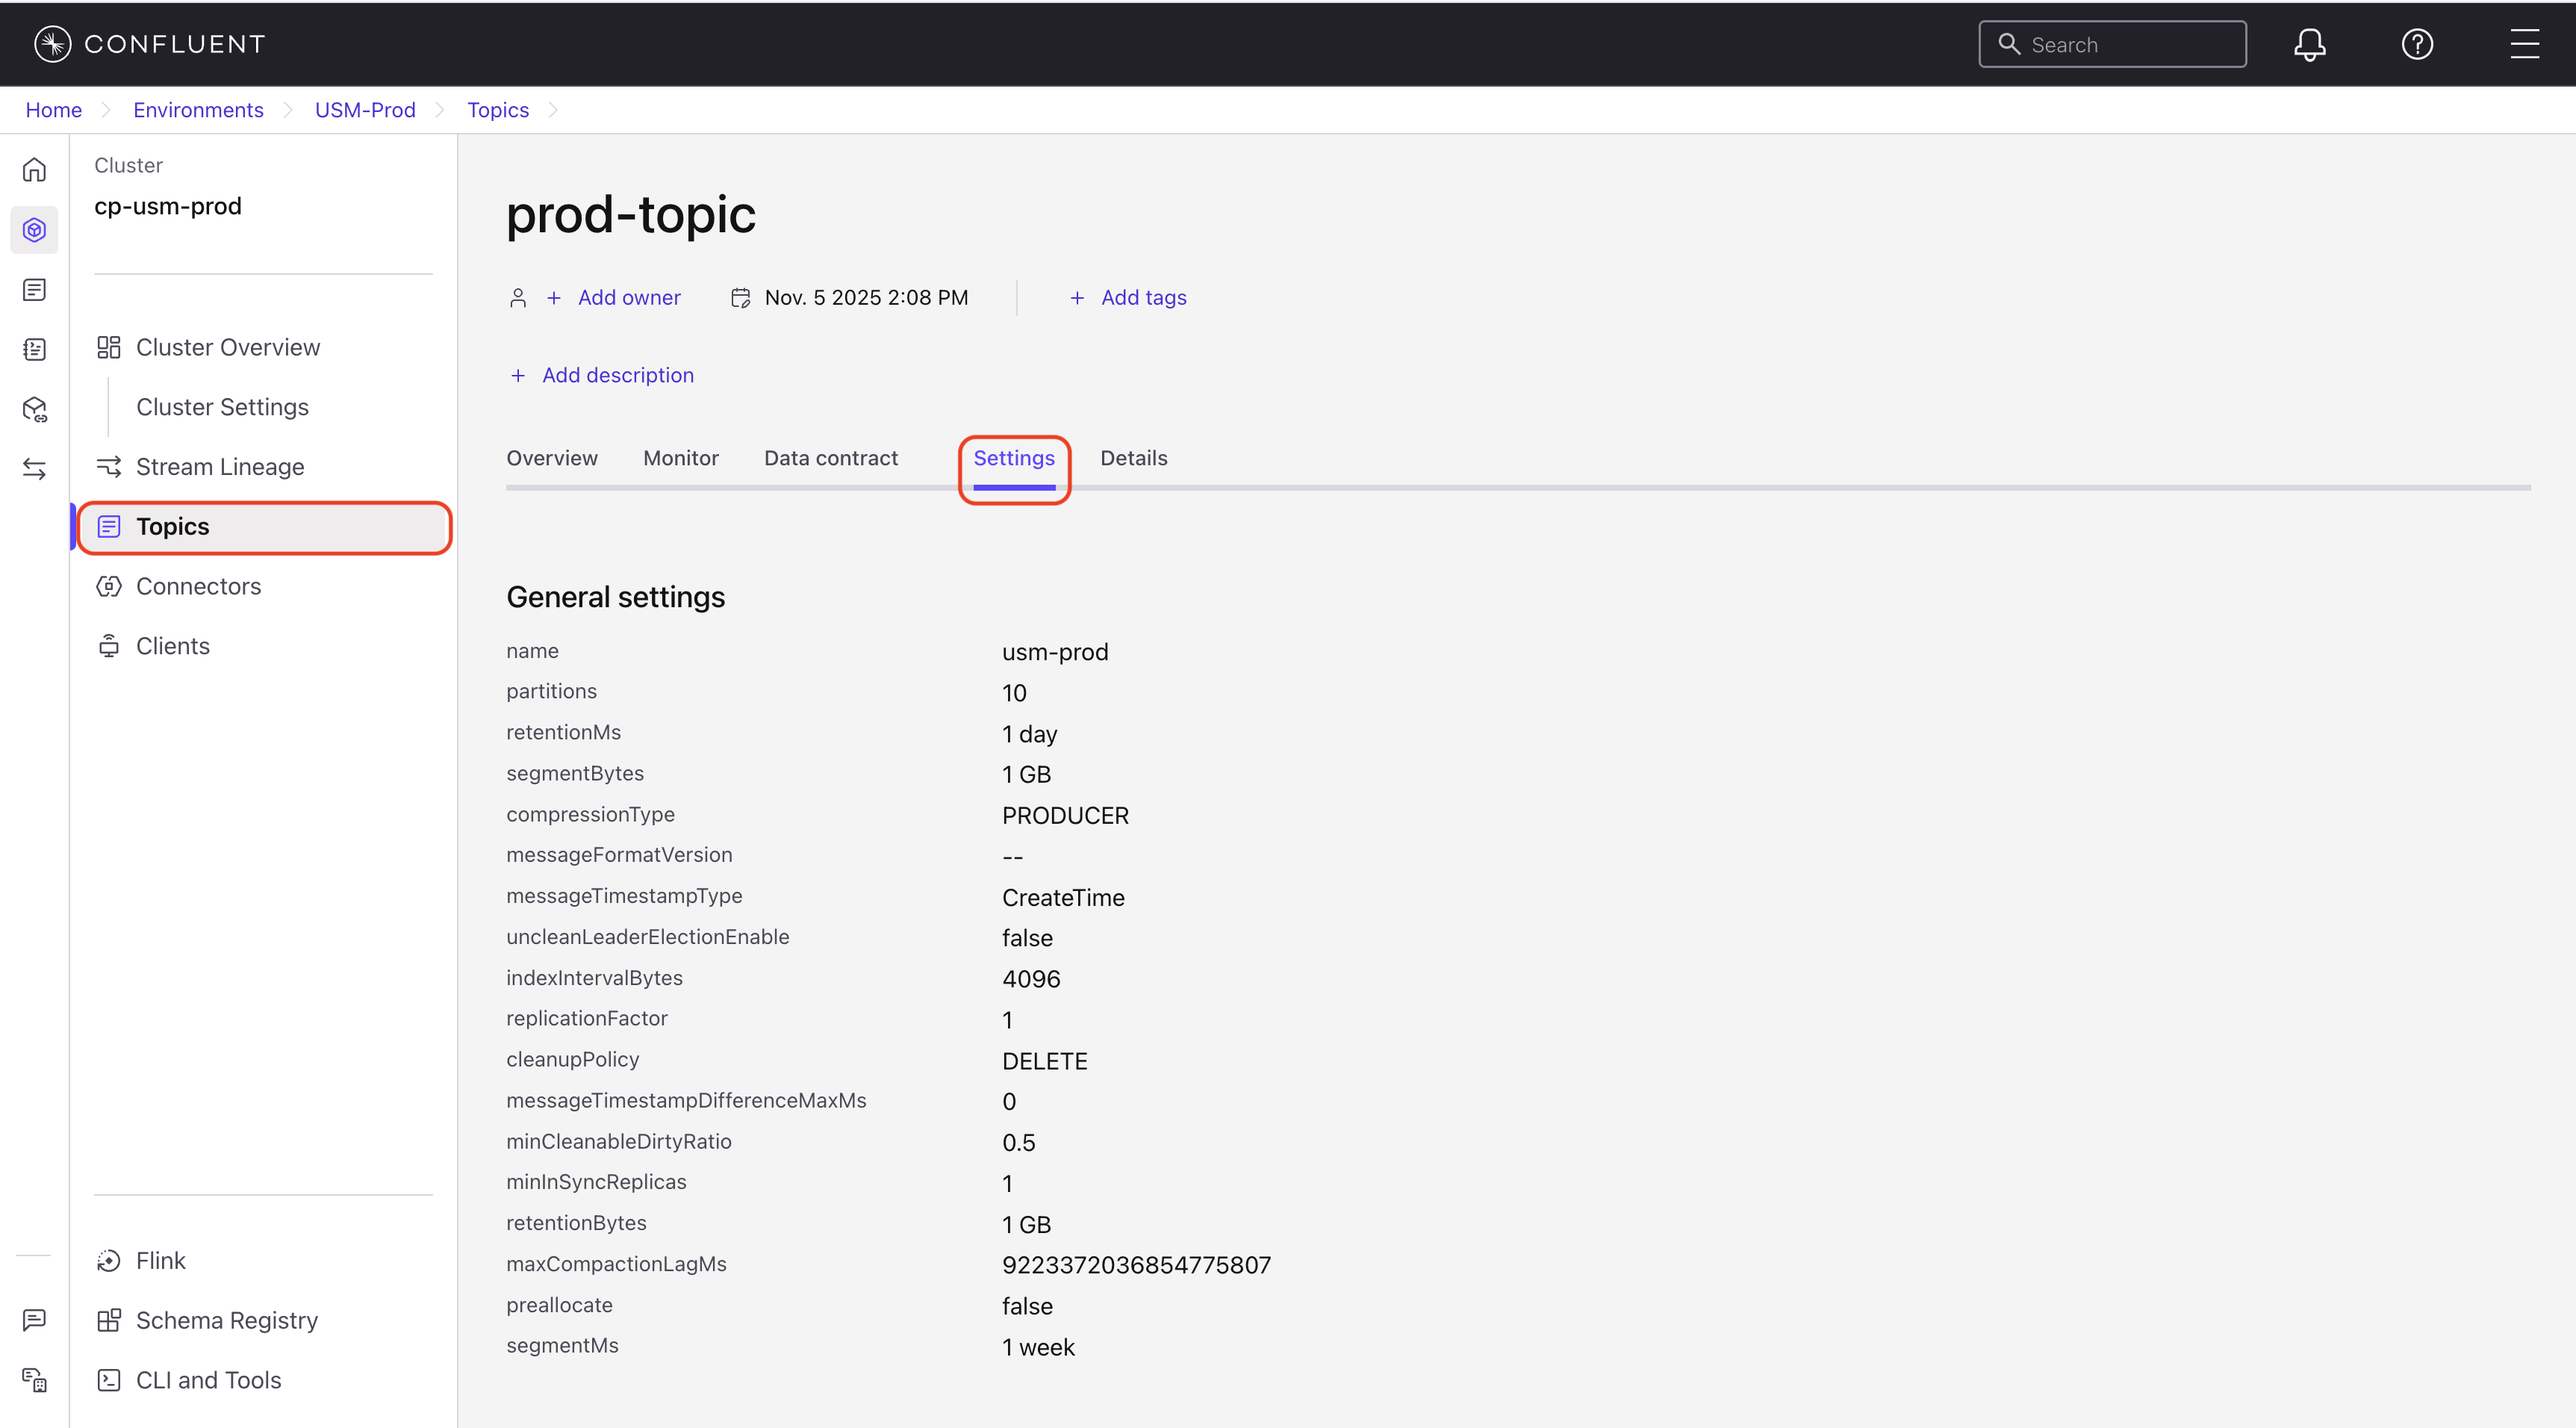
Settings tab
The Settings tab displays the configuration parameters for the topic. The settings are read-only in the Confluent Cloud Console and must be modified in the Confluent Platform environment.
Details tab
The Details tab provides metadata and organizational information about the topic.
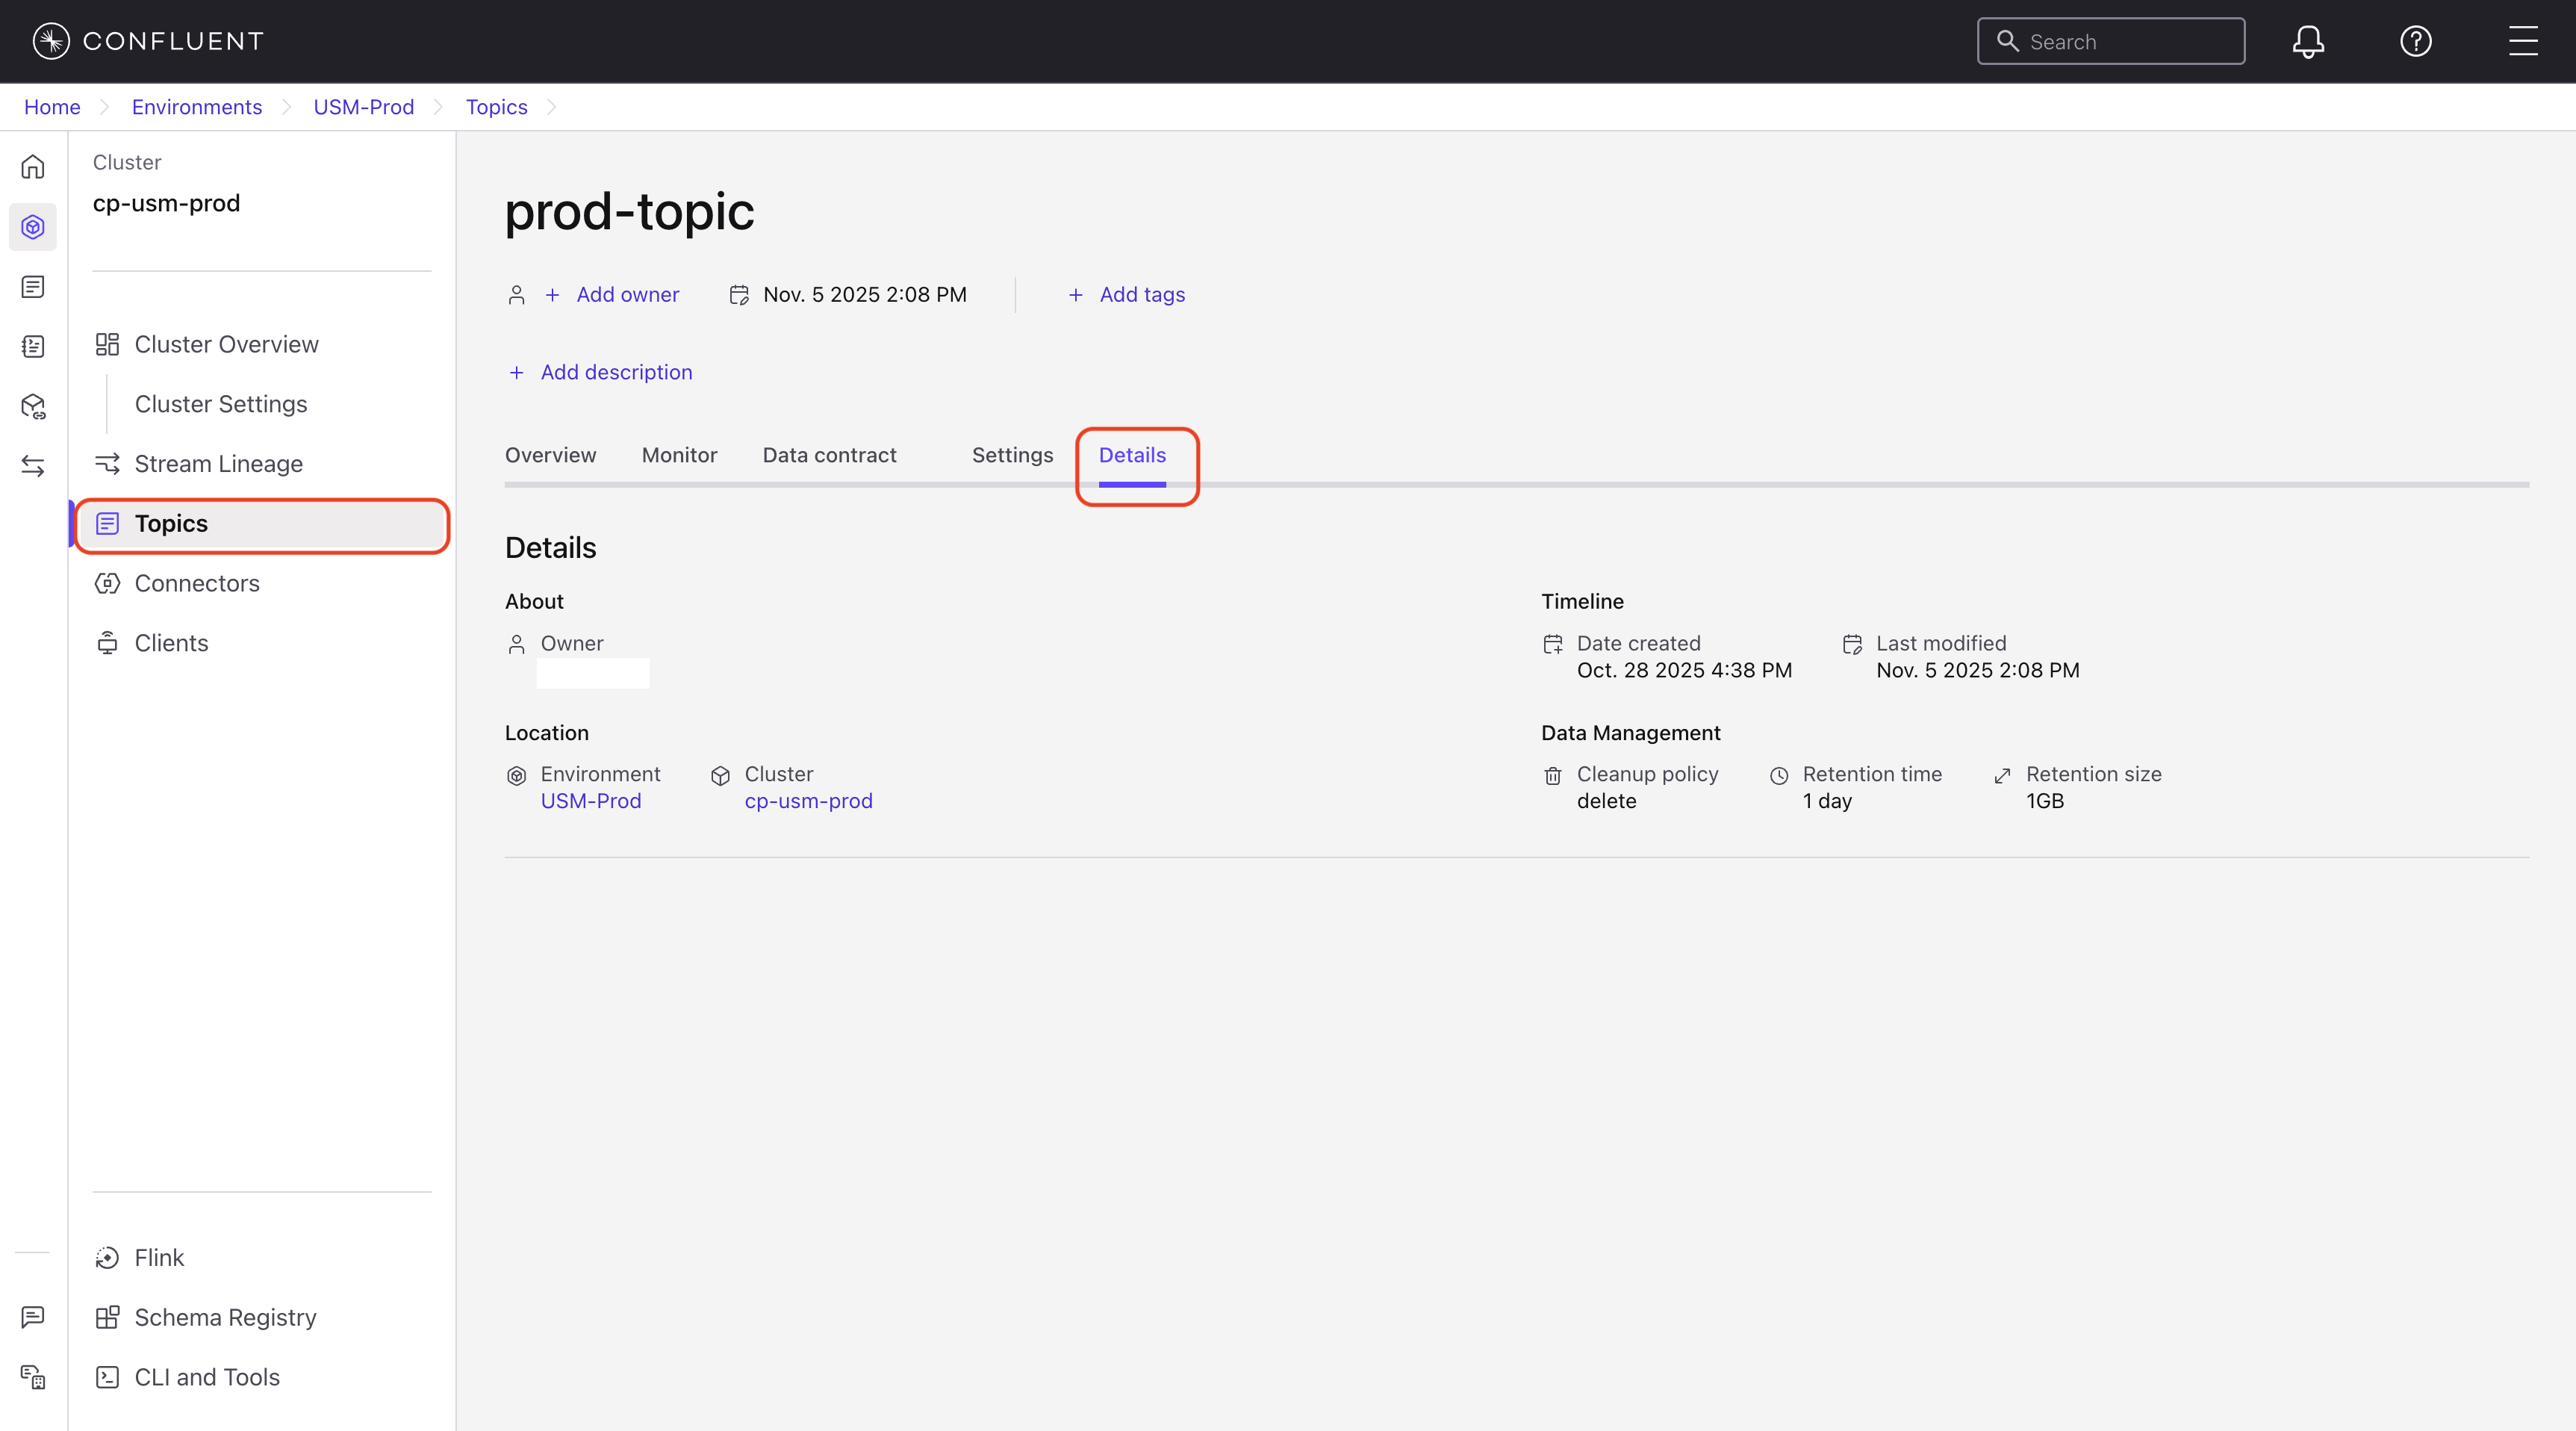
The Details tab includes the following sections:
About
Owner: The user or team responsible for the topic.
Timeline
Date created: The creation date and time for the topic.
Last modified: The date and time of the most recent modification to the topic.
Location
Environment: The Confluent Cloud environment where the topic is registered.
Cluster: The Confluent Platform cluster where the topic resides.
Data Management
Cleanup policy: The method for handling old log segments.
Retention time: The duration to retain messages.
Retention size: The maximum size for retained messages.