Kafka Basics on Confluent Platform
This is a hands-on introduction to Confluent Platform and Apache Kafka®.
What’s covered
Brief overview of Kafka use cases, application development, and how Kafka is delivered in Confluent Platform
Where to get Confluent Platform and overview of options for How to Run It
Instructions on how to set up Confluent Enterprise deployments on a single laptop or machine that models production style configurations, such as multi-broker or multi-cluster, including discussion of replication factors for topics
Kafka Commands Primer, a commands cheat sheet that also helps clarify how Kafka utilities might fit into a development or administrator workflow
Explanation of how to configure listeners, Metrics Reporter, and REST endpoints on a multi-broker setup so that all of the brokers and other components show up on Confluent Control Center (Legacy). Brief introduction to using Control Center to verify topics and messages you create with Kafka commands.
Links to Code Examples and Demo Apps
What is Confluent Platform and its relationship to Kafka?
Apache Kafka® is an event streaming platform you can use to develop, test, deploy, and manage applications. Kafka is a publish-and-subscribe messaging system that enables distributed applications to ingest, process, and share data in real-time.
As a developer, you can use Confluent Platform to build Kafka code into your applications, thereby enabling your application services to interact with Kafka through Confluent Platform, as either native clients or through REST Proxy, as described in Schemas, Serializers, and Deserializers for Confluent Platform.
Using Confluent Platform, you can leverage both core Kafka and Confluent Platform features. During development cycles, you can use the running platform to test both the capabilities of the platform and the elements of your application code that will interact with the platform (by creating topics, producing and consuming messages, associating schemas with topics, and so forth).
As an administrator, you can configure and launch scalable deployments to leverage both Kafka and Confluent Platform features, and manage and evolve those deployments.
Kafka use cases
As an example, a social media application might model Kafka topics for posts, likes, and comments. The application incorporates producers and consumers that subscribe to those Kafka topics. When a user of the app publishes a post, likes something, or comments, that data is sent (produced) to the associated topic. When a user goes to the social media site or clicks to pull up a particular page, a Kafka consumer reads from the associated topic and this data is rendered on the web page.
Here are some other real-world examples:
How Confluent Platform fits in
The example Kafka use cases above could also be considered Confluent Platform use cases. Confluent Platform is a specialized distribution of Kafka at its core, with lots of cool features and additional APIs built in. Many of the commercial Confluent Platform features are built into the brokers as a function of Confluent Server, as described here.
The fundamental capabilities, concepts, design ethos, and ways of working that you already know from using Kafka, also apply to Confluent Platform. By definition, Confluent Platform ships with all of the basic Kafka command utilities and APIs used in development, along with several additional CLIs to support Confluent specific features. To learn more about Confluent Platform, see What is Confluent Platform?.
Confluent Platform releases include the latest stable version of Apache Kafka, so when you install Confluent Platform you are also installing Kafka. You can view a mapping of Confluent Platform releases to Kafka versions here.
Demos and real-world examples of Confluent Platform use cases are included throughout this documentation and on various Confluent websites, such as:
Where to find Kafka command line tools
You can see both the Confluent and Kafka commands (those that start with
kafka-) listed in the CLI Tools for Confluent Platform in this documentation.With Confluent Platform installed on your system, you can find the Kafka and Confluent utilities in
$CONFLUENT_HOME/bin/(where$CONFLUENT_HOMEindicates the location of your Confluent Platform installation). For Kafka commands descriptions and examples, see Kafka Commands Primer on this page.
Where to get Confluent Platform
Before proceeding with these examples, verify that you have the following prerequisites, and Confluent Platform 6.0.0 or later installed on your local machine.
- Prerequisites:
Internet connectivity.
Operating System currently supported by Confluent Platform.
A supported version of Java downloaded and installed.
Java 8 and Java 11 are supported in this version of Confluent Platform (Java 9 and 10 are not supported). For more information, see Java supported versions.
Java 1.8 or 1.11 to run Confluent Platform
How to Run It
You have several options for running Confluent Platform (and Kafka), depending on your use cases and goals.
Quick Starts
For developers who want to get familiar with the platform, you can start with the Apache Quick Start Guides. The local quick start) demo how to run Confluent Platform with one command (confluent local services start) on a single broker, single cluster development environment with topic replication factors set to 1. The Docker demos, such as Quick Start for Confluent Platform demo the same type of deployment, also without the need to configure brokers or Confluent Control Center (Legacy) properties files.
Tip
If you want both an introduction to using Confluent Platform and an understanding of how to configure your clusters, a suggested learning progression is:
Follow the steps for a local install as shown in the Quick Start for Confluent Platform and run a default single-broker cluster as described, using
confluent local services start. Experiment with the features as shown in the workflow for that tutorial.Return to this page and walk through the steps to configure and run a multi-broker cluster.
The quick start Docker demos are a low friction way to try out Confluent Platform features, but a local install provides additional hands-on practice with configuring clusters and enabling features.
Multi-node production-ready deployments
Operators and developers who want to set up production-ready deployments can follow the workflows for Install Confluent Platform On-Premises or Ansible Playbooks.
Single machine, multi-broker and multi-cluster configurations
To bridge the gap between the developer environment quick starts and full-scale, multi-node deployments, you can start by pioneering multi-broker clusters and multi-cluster setups on a single machine, like your laptop.
Trying out these different setups is a great way to learn your way around the configuration files for Kafka broker and Control Center (Legacy), and experiment locally with more sophisticated deployments. These setups more closely resemble real-world configurations and support data sharing and other scenarios for Confluent Platform specific features like Replicator, Self-Balancing, Cluster Linking, and multi-cluster Schema Registry.
For a single cluster with multiple brokers, you must configure and start a single ZooKeeper, and as many brokers as you want to run in the cluster. A detailed example is provided below in Run a multi-broker cluster.
For a multi-cluster deployment, you need as many ZooKeepers as you want clusters, and multiple Kafka server properties files (one for each broker). To learn more about multi-cluster setups, see Run multiple clusters.
Does all this run on my laptop?
Yes! These examples show you how to run all clusters and brokers on a single laptop or machine.
That said, you can easily extrapolate much of what you learn here to create similar deployments on your favorite cloud provider, using multiple virtual hosts. Use these examples as stepping stones to more complex deployments and feature integrations.
Run a multi-broker cluster
To run a single cluster with multiple brokers (3 brokers, for this example) you need:
1 ZooKeeper properties file
3 Kafka broker properties files with unique broker IDs, listener ports (to surface details for all brokers on Control Center (Legacy)), and log file directories.
Control Center (Legacy) properties file with the REST endpoints for
controlcenter.clustermapped to your brokers.Metrics Reporter JAR file installed and enabled on the brokers. (If you start Confluent Platform as described below, from
$CONFLUENT_HOME/bin/, the Metrics Reporter is automatically installed on the broker. Otherwise, you would need to add the path to the Metrics Reporter JAR file to your CLASSPATH.)Properties files for any other Confluent Platform components you want to run, with default settings to start with.
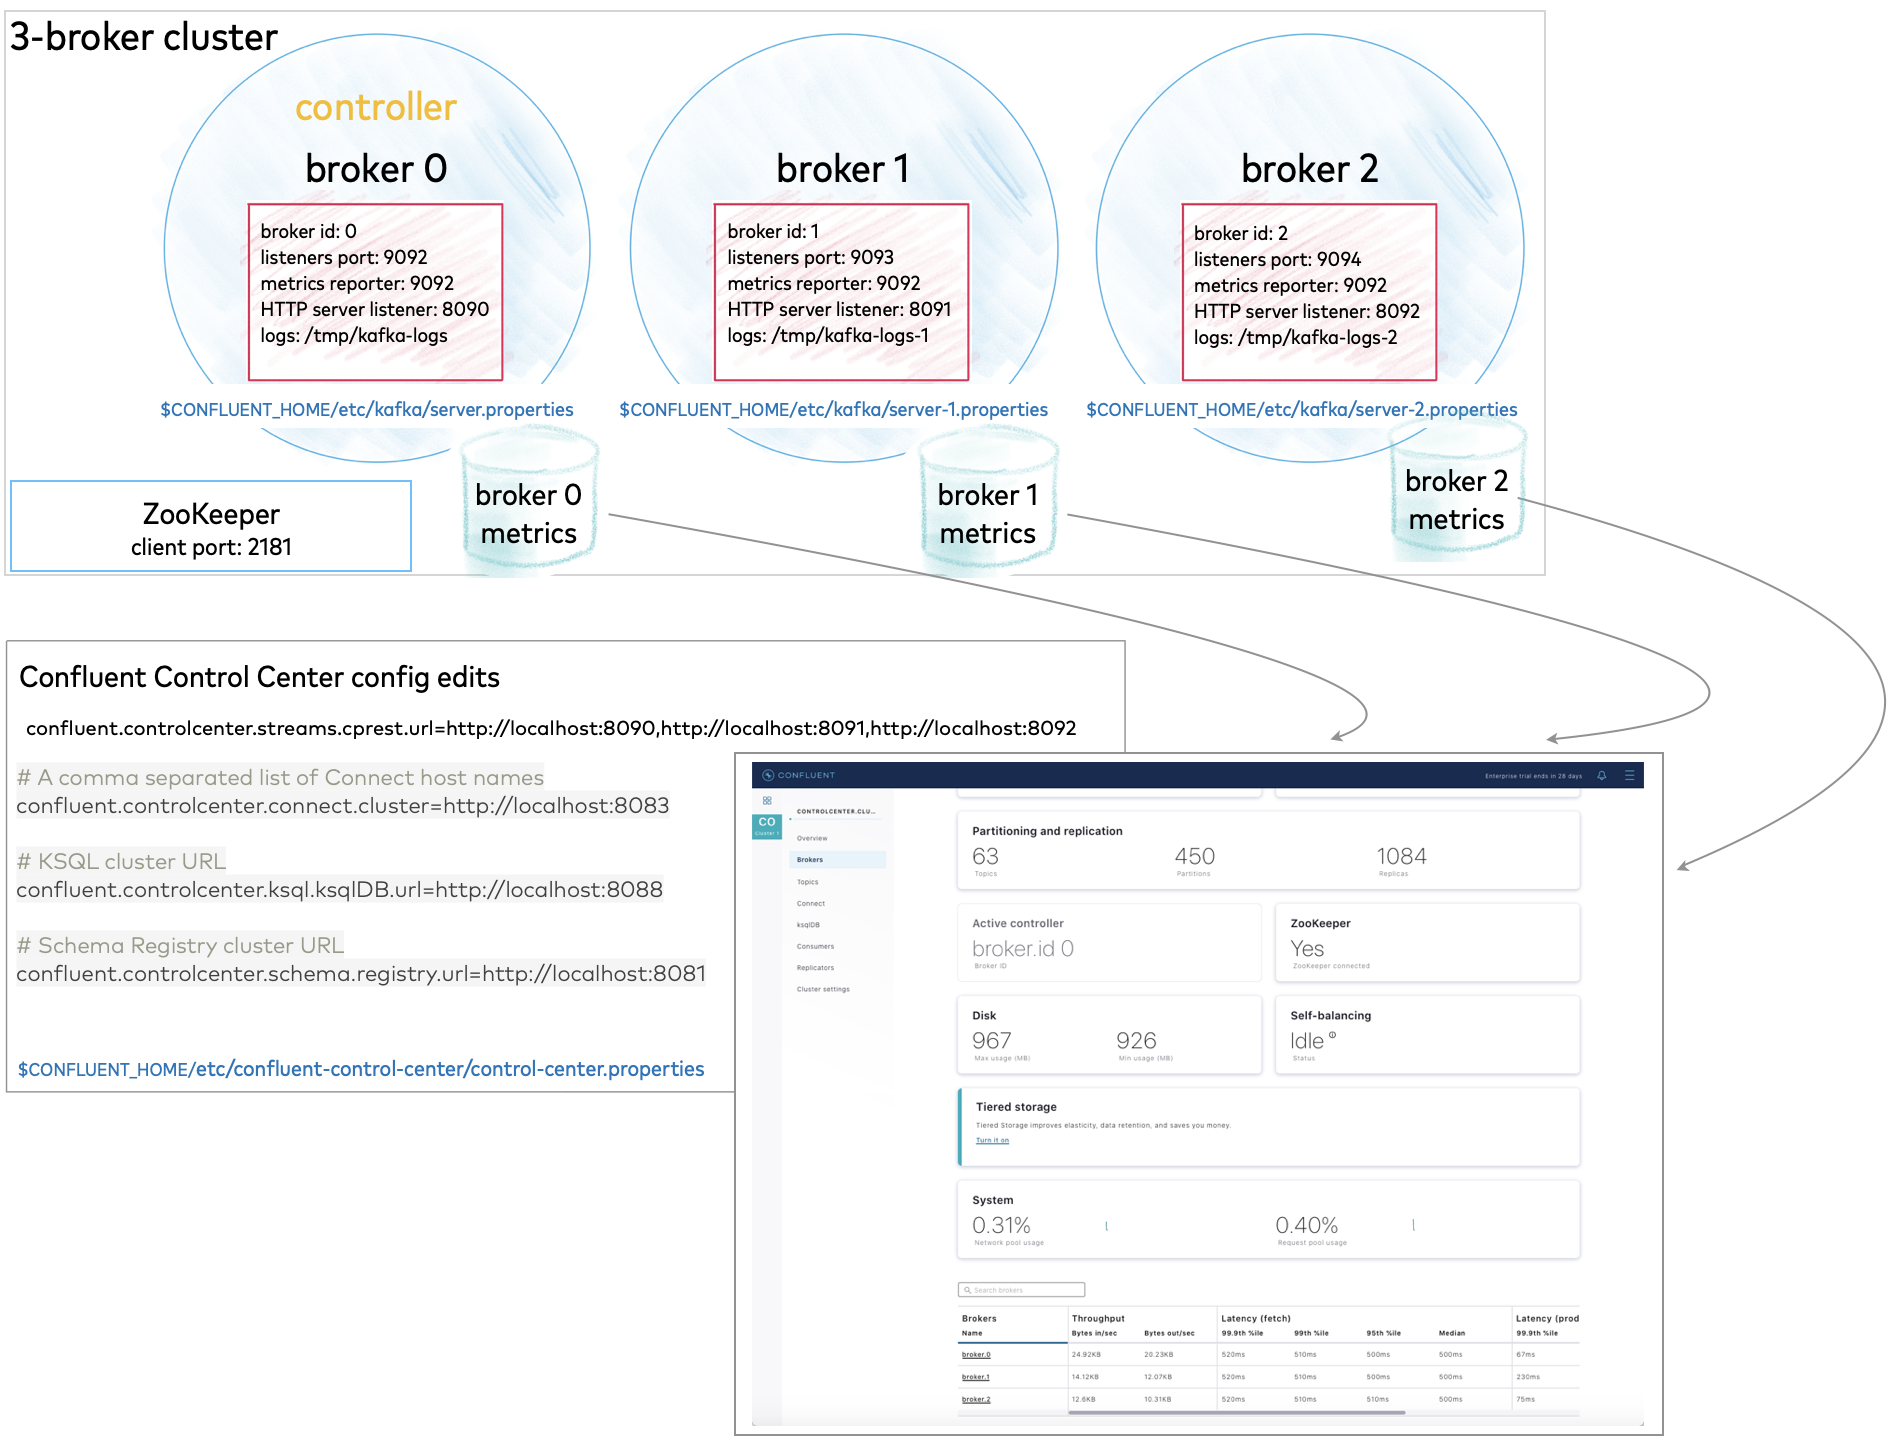
All of this is described in detail below.
Configure replication factors
The server.properties file that ships with Confluent Platform has replication factors set to 1 on several system topics to support development test environments and Quick Start for Confluent Platform scenarios. For real-world scenarios, however, a replication factor greater than 1 is preferable to support fail-over and auto-balancing capabilities on both system and user-created topics.
The following steps show you how to reset system topics replication factors and replicas to 2, and uncomment the properties if needed so that your changes go into effect.
Make these changes, and then save the file.
Search in
$CONFLUENT_HOME/etc/kafka/server.propertiesfor all instances ofreplication.factorand set the values for these to a number that is less than the number of brokers but greater than 1. For this cluster, set allreplication.factor’s to 2. Your search throughserver.propertiesshould turn up these properties. If they are commented out, uncomment them:offsets.topic.replication.factor=2 transaction.state.log.replication.factor=2 confluent.license.topic.replication.factor=2 confluent.metadata.topic.replication.factor=2 confluent.balancer.topic.replication.factor=2
In the same properties file, do a search to on
replicas, uncomment these properties, and set their values to 2:confluent.metrics.reporter.topic.replicas=2 confluent.security.event.logger.exporter.kafka.topic.replicas=2
If you want to run Connect, change replication factors in that properties file also. Search
$CONFLUENT_HOME/etc/kafka/connect-distributed.propertiesfor all instances ofreplication.factorand set the values for these to a number that is less than the number of brokers but greater than 1. For this cluster, set allreplication.factor’s to 2. Your search throughconnect-distributed.propertiesshould turn up these properties. If they are commented out, uncomment them:offset.storage.replication.factor=2 config.storage.replication.factor=2 status.storage.replication.factor=2
Tip
Limiting replicas and replication factors to
2provides a safeguard for topic replication if you lose a broker, or the option to intentionally shrink the cluster by one broker using Self-Balancing Clusters. You can always expand back up to 3, or add more brokers. This configuration supports topic replication on a cluster of two or more brokers.When you create your topics, make sure that they also have the needed replication factor, depending on the number of brokers. Examples are shown in the section on creating topics in Kafka Commands Primer.
Create a basic configuration for a three-broker cluster
This example demos a cluster with three brokers.
Start with the server.properties file you updated for replication factors in the previous step, copy it and modify the configurations as shown below, renaming the new files to represent the other two brokers.
File | Configurations |
|---|---|
server.properties | Use the defaults for these basics (if a value is commented out, leave it as such):
Uncomment the following two lines to enable the Metrics Reporter and populate Control Center (Legacy) with broker metrics for all brokers. This same configuration can apply to all brokers in the cluster. There is no need to change this to match the listener port for each broker: metric.reporters=io.confluent.metrics.reporter.ConfluentMetricsReporter
confluent.metrics.reporter.bootstrap.servers=localhost:9092
Add the following listener configuration to specify the REST endpoint for this broker: confluent.http.server.listeners=http://localhost:8090
|
server-1.properties | Update the values for these basic properties to make them unique. (Be sure to uncomment
Make sure the following two lines are uncommented to enable the Metrics Reporter on this broker: metric.reporters=io.confluent.metrics.reporter.ConfluentMetricsReporter
confluent.metrics.reporter.bootstrap.servers=localhost:9092
Add the listener configuration to specify the REST endpoint unique to this broker (if you copied confluent.http.server.listeners=http://localhost:8091
|
server-2.properties | Update the values for these basic properties to make them unique. (Be sure to uncomment
Make sure the following two lines are uncommented to enable the Metrics Reporter on this broker: metric.reporters=io.confluent.metrics.reporter.ConfluentMetricsReporter
confluent.metrics.reporter.bootstrap.servers=localhost:9092
Add the listener configuration to specify the REST endpoint unique to this broker (if you copied confluent.http.server.listeners=http://localhost:8092
|
When you have completed this step, you will have three server properties files in $CONFLUENT_HOME/etc/kafka/, one per broker:
server.propertieswhich corresponds to broker 0server-1.propertieswhich corresponds to broker 1server-2.propertieswhich corresponds to broker 2
Tip
In server.properties and other configuration files, commented out properties or those not listed at all, take the default values. For example, the commented out line for listeners on broker 0 has the effect of setting a single listener to PLAINTEXT://:9092.
Configure Control Center (Legacy) with REST endpoints and advertised listeners (Optional)
This is an optional step, only needed if you want to use Confluent Control Center (Legacy). It gives you a similar starting point as you get in the Quick Start for Confluent Platform, and an alternate way to work with and verify the topics and data you will create on the command line with kafka-topics.
You must tell Control Center (Legacy) about the REST endpoints for all brokers in your cluster, and the advertised listeners for the other components you may want to run. Without these configurations, the brokers and components will not show up on Control Center (Legacy).
Make the following changes to $CONFLUENT_HOME/etc/confluent-control-center/control-center.properties and save the file.
Configure REST endpoints for the brokers.
In the appropriate Control Center (Legacy) properties file, use
confluent.controlcenter.streams.cprest.urlto define the REST endpoints forcontrolcenter.cluster.In
$CONFLUENT_HOME/etc/confluent-control-center/control-center.properties, uncomment the default value for the Kafka REST endpoint URL and modify it to match your multi-broker configuration as follows:# Kafka REST endpoint URL confluent.controlcenter.streams.cprest.url=http://localhost:8090,http://localhost:8091,http://localhost:8092
See also
Required Configurations for Control Center (Legacy) in Self-Balancing Configuration Options and
confluent.controlcenter.streams.cprest.urlin the Control Center Configuration Reference.Uncomment the configurations for Kafka Connect, ksqlDB, and Schema Registry to provide Control Center (Legacy) with the default advertised URLs to for the component clusters.
# A comma separated list of Connect host names
confluent.controlcenter.connect.cluster=http://localhost:8083

# KSQL cluster URL
confluent.controlcenter.ksql.ksqlDB.url=http://localhost:8088

# Schema Registry cluster URL
confluent.controlcenter.schema.registry.url=http://localhost:8081
Tip
Component listeners are uncommented for you already in
control-center-dev.propertieswhich is used byconfluent local services start, as in Quick Start for Confluent Platform, but in the file you are using here (control-center.properties), you must uncomment them.
Install the Datagen Connector (Optional)
Install the Kafka Connect Datagen source connector using the Confluent Marketplace client. This connector generates mock data for demonstration purposes and is not suitable for production. Confluent Hub is an online library of pre-packaged and ready-to-install extensions or add-ons for Confluent Platform and Kafka.
confluent-hub install \
   --no-prompt confluentinc/kafka-connect-datagen:latest
This is an optional step, but useful, as it gives you a similar starting point as you get in the Quick Start for Confluent Platform.
Start Confluent Platform
Follow these steps to start the servers in separate command windows.
Start ZooKeeper in its own command window.
./bin/zookeeper-server-start etc/kafka/zookeeper.propertiesStart each of the brokers in separate command windows.
./bin/kafka-server-start etc/kafka/server.properties./bin/kafka-server-start etc/kafka/server-1.properties./bin/kafka-server-start etc/kafka/server-2.propertiesStart each of these components in separate windows.
Tip
For this example, it is not necessary to start all of these. At a minimum, you will need ZooKeeper and the brokers (already started), and Kafka REST. However, it is useful to have all components running if you are just getting started with the platform, and want to explore everything. This gives you a similar starting point as you get in Quick Start for Confluent Platform, and enables you to work through the examples in that Quick Start in addition to the Kafka command examples provided here.
./bin/kafka-rest-start etc/kafka-rest/kafka-rest.properties(Optional) Kafka Connect
./bin/connect-distributed etc/kafka/connect-distributed.properties(Optional) ksqlDB Overview
./bin/ksql-server-start etc/ksqldb/ksql-server.properties(Optional) Schema Registry
./bin/schema-registry-start etc/schema-registry/schema-registry.properties(Optional) Finally, start Control Center in a separate command window.
./bin/control-center-start etc/confluent-control-center/control-center.properties
Explore Control Center (Legacy) (Optional)
Bring up Confluent Control Center (Legacy) to verify the current status of your cluster, including lead broker (controller), topic data, and number of brokers. For a local deployment, Control Center (Legacy) is available at http://localhost:9021/ in your web browser.
The starting view of your environment in Control Center (Legacy) shows your cluster with 3 brokers.
Click into the cluster card.
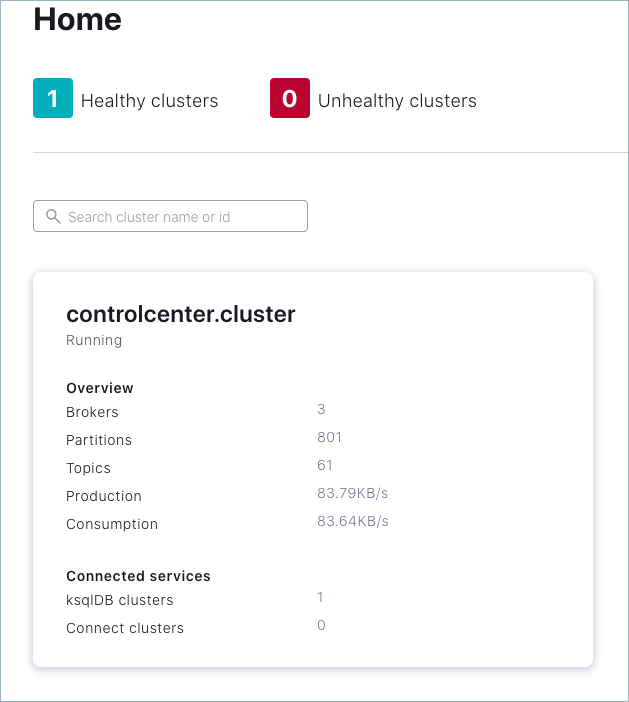
The cluster overview is displayed.

Click either the Brokers card or Brokers on the menu to view broker metrics.
Notice the card for Active controller indicating that the lead broker is broker.id 0, which was configured in
server.propertieswhen you specifiedbroker.id=0. On a multi-broker cluster, the role of the controller can change hands if the current controller is lost. To learn more, see What happens if the lead broker (controller) is removed or lost?, and topics on the “Controller” and “State Change Log” in Post Kafka Deployment.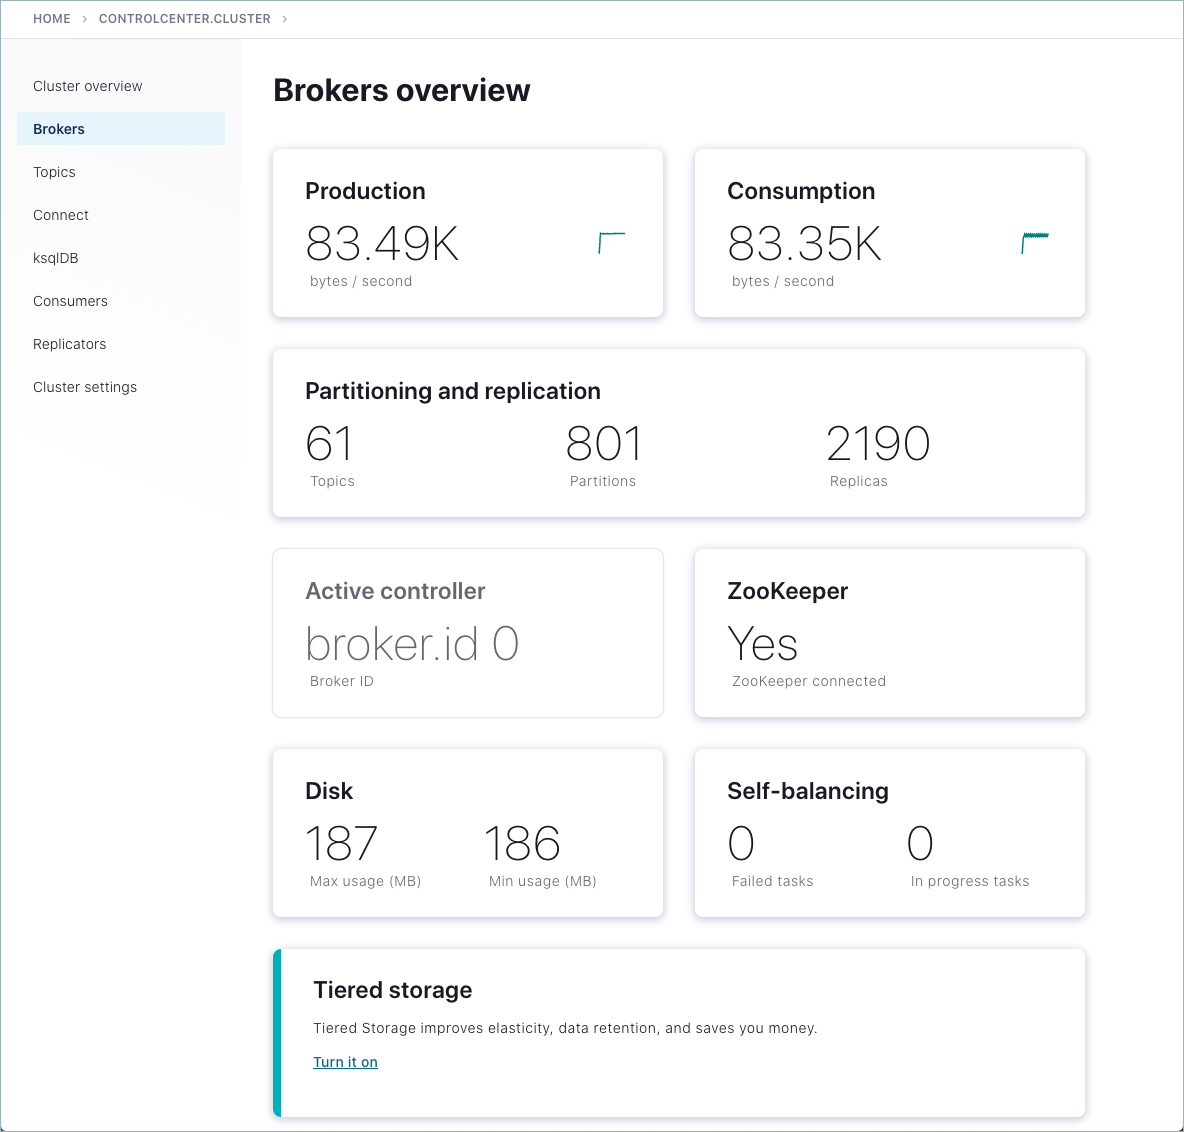
From the brokers list at the bottom of the page, you can view detailed metrics and drill down on each broker.

Finally, click Topics on the left menu.
Note that only system (internal) topics are available at this point because you haven’t created any topics of your own yet. The
default_ksql_processing_logwill show up as a topic if you configured and started ksqlDB.
There is a lot more to Control Center (Legacy) but it is not the focus of this guide. If you haven’t had a chance to work all the way through a quick start (which demos tasks on Control Center (Legacy)), technically you could jump over to Quick Start for Confluent Platform and work through those same tasks on this cluster (starting with creating Kafka topics on Control Center (Legacy)), and then come back to this guide to continue with the examples in Kafka Commands Primer.
Everything should work the same for the Quick Start steps. The only difference is that here you have a multi-broker cluster with replication factors set appropriately for additional examples, and the deployment in the quick starts (launched with confluent local services start) is a single-broker cluster with replication factors set to 1 for a development-only environment.
Kafka Commands Primer
Once you have Confluent Platform running, an intuitive next step is try out some basic Kafka commands to create topics and work with producers and consumers. This should help orient Kafka newbies and pros alike that all those familiar Kafka tools are readily available in Confluent Platform, and work the same way. These provide a means of testing and working with basic functionality, as well as configuring and monitoring deployments. The commands surface a subset of the APIs available to you.
Confluent Platform ships with Kafka commands and utilities in $CONFLUENT_HOME/bin. This bin/ directory includes both Confluent proprietary and open source Kafka utilities.
A few things to note:
With Confluent Platform installed and running on your system, you can run Kafka commands from anywhere; for example, from your
$HOME(~/) directory. You do not have to run these from within$CONFLUENT_HOME.A full list is provided in CLI Tools for Confluent Platform. Those in the list that begin with
kafka-are the Kafka open source command utilities, also covered in various sections of the Apache Kafka documentation.Comprehensive command line help is available by typing any of the commands with no arguments; for example,
kafka-topicsorkafka-producer-perf-test.
To help get you started, the sections below provide examples for some of the most fundamental and widely-used commands.
Create, list and describe topics
You can use kafka-topics for operations on topics (create, list, describe, alter, delete, and so forth).
In a command window, run the following commands to experiment with topics.
Create three topics,
cool-topic,warm-topic,hot-topic.kafka-topics --create --topic cool-topic --bootstrap-server localhost:9092
kafka-topics --create --topic warm-topic --bootstrap-server localhost:9092
kafka-topics --create --topic hot-topic --partitions 2 --replication-factor 2 --bootstrap-server localhost:9092
List all topics.
kafka-topics --list --bootstrap-server localhost:9092
Tip
System topics are prefaced by an underscore in the output. The topics you created are listed at the end.
Describe a topic.
This shows partitions, replication factor, and in-sync replicas for the topic.
kafka-topics --describe --topic cool-topic --bootstrap-server localhost:9092
Your output should resemble the following:
Topic: cool-topic PartitionCount: 1       ReplicationFactor: 1    Configs: segment.bytes=1073741824
  Topic: cool-topic       Partition: 0    Leader: 0       Replicas: 0     Isr: 0  Offline:
Tip
If you run
kafka-topics --describewith no specified topic, you get a detailed description of every topic on the cluster (system and user topics).Describe another topic, using one of the other brokers in the cluster as the bootstrap server.
kafka-topics --describe --topic hot-topic --bootstrap-server localhost:9094
Here is that example output:
Topic: hot-topic  PartitionCount: 2       ReplicationFactor: 2    Configs: segment.bytes=1073741824
  Topic: hot-topic        Partition: 0    Leader: 1       Replicas: 1,0   Isr: 1,0        Offline:
  Topic: hot-topic        Partition: 1    Leader: 0       Replicas: 0,2   Isr: 0,2        Offline:
You can connect to any of the brokers in the cluster to run these commands because they all have the same data!
Alter a topic’s cofiguration.
For this example, change the partition count on hot-topic from
2to9.kafka-topics --alter --topic hot-topic --partitions 9 --bootstrap-server localhost:9092
Tip
Dynamic topic modification is inherently limited by the current configurations. For example, you cannot decrease the number of partitions or modify the replication factor for a topic, as that would require partition reassignment.
Rerun
--describeon the same topic.kafka-topics --describe --topic hot-topic --bootstrap-server localhost:9092
Here is that example output, and verify that the partition count is updated to
9:Topic: hot-topic PartitionCount: 9 ReplicationFactor: 2 Configs: segment.bytes=1073741824 Topic: hot-topic Partition: 0 Leader: 2 Replicas: 2,1 Isr: 2,1 Offline: Topic: hot-topic Partition: 1 Leader: 1 Replicas: 1,0 Isr: 1,0 Offline: Topic: hot-topic Partition: 2 Leader: 1 Replicas: 1,2 Isr: 1,2 Offline: Topic: hot-topic Partition: 3 Leader: 2 Replicas: 2,1 Isr: 2,1 Offline: Topic: hot-topic Partition: 4 Leader: 0 Replicas: 0,2 Isr: 0,2 Offline: Topic: hot-topic Partition: 5 Leader: 1 Replicas: 1,0 Isr: 1,0 Offline: Topic: hot-topic Partition: 6 Leader: 2 Replicas: 2,0 Isr: 2,0 Offline: Topic: hot-topic Partition: 7 Leader: 0 Replicas: 0,1 Isr: 0,1 Offline: Topic: hot-topic Partition: 8 Leader: 1 Replicas: 1,2 Isr: 1,2 Offline:
Delete a topic.
kafka-topics --delete --topic warm-topic --bootstrap-server localhost:9092
List all topics.
kafka-topics --list --bootstrap-server localhost:9092
Run producers and consumers to send and read messages
The command utilities kafka-console-producer and kafka-console-consumer allow you to manually produce messages to and consume from a topic.
Open two new command windows, one for a producer, and the other for a consumer.
Run a producer to produce to
cool-topic.kafka-console-producer --topic cool-topic --bootstrap-server localhost:9092
Send some messages.
Type your messages at the prompt (
>), and hit Return after each one.Your command window will resemble the following:
$ kafka-console-producer --broker-list localhost:9092 --topic cool-topic
>hi cool topic
>did you get this message?
>first
>second
>third
>yes! I love you cool topic
>
Tip
You can use the
--broker-listflag in place of--bootstrap-serverfor the producer, typically used to send data to specific brokers; shown here as an example.In the other command window, run a consumer to read messages from
cool-topic. Specify that you want to start consuming from the beginning, as shown.kafka-console-consumer --topic cool-topic --from-beginning --bootstrap-server localhost:9092
Your output will resemble the following:
$ kafka-console-consumer --bootstrap-server localhost:9092 --from-beginning --topic cool-topic
hi cool topic on origin cluster
is this getting to your replica?
first
second
third
yes! I love you cool topic
When you want to stop the producer and consumer, type Ctl-C in their respective command windows.
Tip
You may want to leave at least the producer running for now, in case you want to send more messages when we revisit topics on the Control Center (Legacy).
Produce auto-generated message data to topics
You can use kafka-producer-perf-test in its own command window to generate test data to topics.
For example, open a new command window and type the following command to send data to
hot-topic, with the specified throughput and record size.kafka-producer-perf-test \ --producer-props bootstrap.servers=localhost:9092 \ --topic hot-topic \ --record-size 1000 \ --throughput 1000 \ --num-records 3600000
The command provides status output on messages sent, as shown:
4999 records sent, 999.8 records/sec (0.95 MB/sec), 1.1 ms avg latency, 240.0 ms max latency.
5003 records sent, 1000.2 records/sec (0.95 MB/sec), 0.5 ms avg latency, 4.0 ms max latency.
5003 records sent, 1000.2 records/sec (0.95 MB/sec), 0.6 ms avg latency, 5.0 ms max latency.
5001 records sent, 1000.2 records/sec (0.95 MB/sec), 0.3 ms avg latency, 3.0 ms max latency.
5001 records sent, 1000.0 records/sec (0.95 MB/sec), 0.3 ms avg latency, 4.0 ms max latency.
5000 records sent, 1000.0 records/sec (0.95 MB/sec), 0.8 ms avg latency, 24.0 ms max latency.
5001 records sent, 1000.2 records/sec (0.95 MB/sec), 0.6 ms avg latency, 3.0 ms max latency.
...
Open a new command window to consume the messages from hot-topic as they are sent (not from the beginning).
kafka-console-consumer --topic hot-topic --bootstrap-server localhost:9092
Type Ctl-C to stop the consumer.
Tip
You may want to leave the producer running for a moment, as you are about to revisit Topics on the Control Center (Legacy).
To learn more, check out Benchmark Commands, Let’s Load test, Kafka!, and How to do Performance testing of Kafka Cluster
Revisit Control Center (Legacy) (Optional)
Now that you have created some topics and produced message data to a topic (both manually and with auto-generated), take another look at Control Center (Legacy), this time to inspect the existing topics.
Open a web browser and go to http://localhost:9021/, the default URL for Control Center (Legacy) on a local system.
Select the cluster, and click Topics from the menu.
Choose
cool-topic, then select the Messages tab.Select Jump to offset and type
1,2, or3to display previous messages.These messages do not show in the order they were sent because the consumer here is not reading
--from-beginning.Try manually typing some more messages to
cool-topicwith your command line producer, and watch them show up here.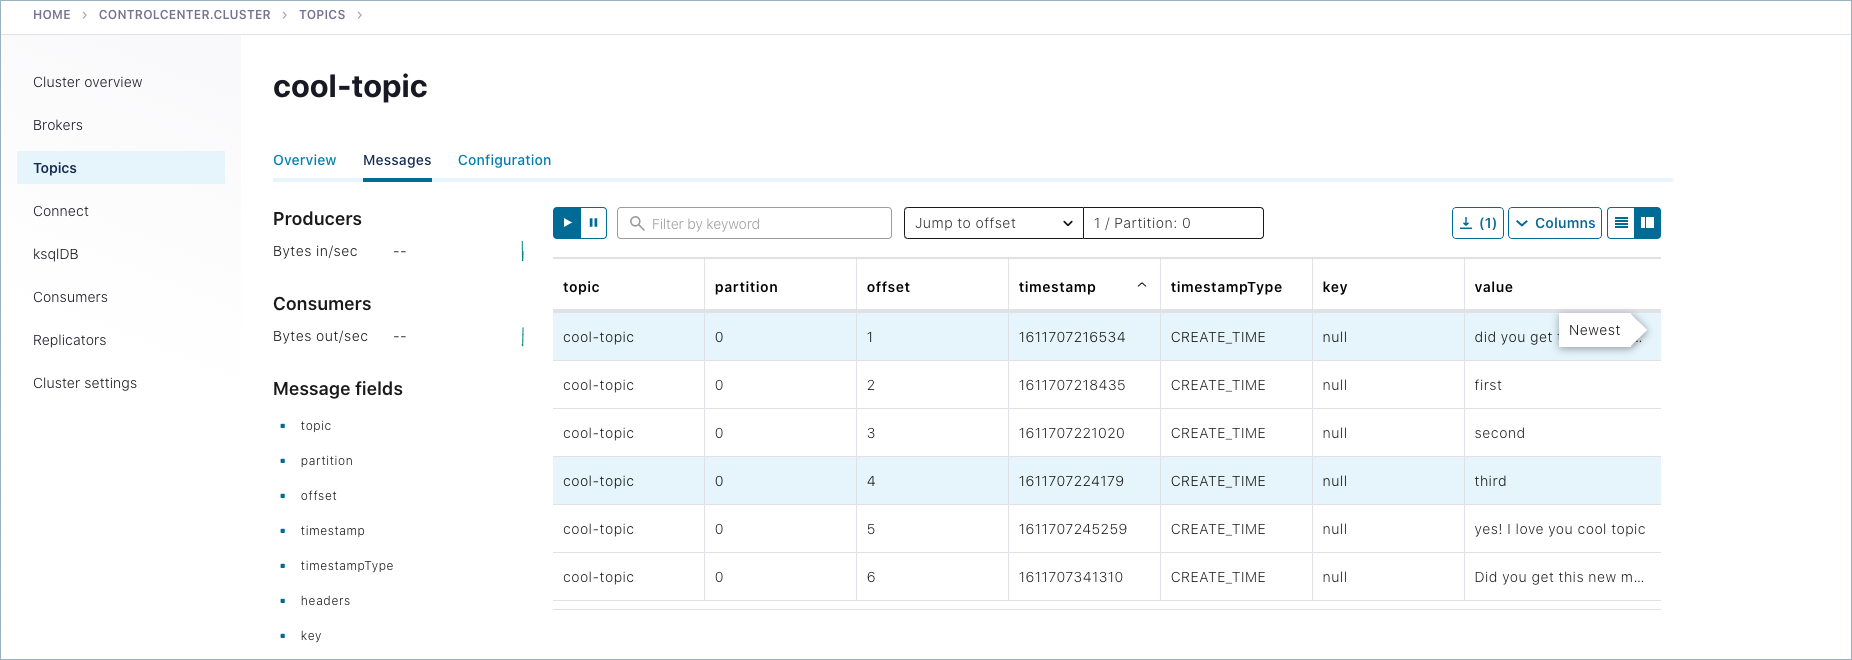
Navigate to Topics >
hot-topic> Messages tab.Auto-generated messages from your
kafka-producer-perf-testare shown here as they arrive.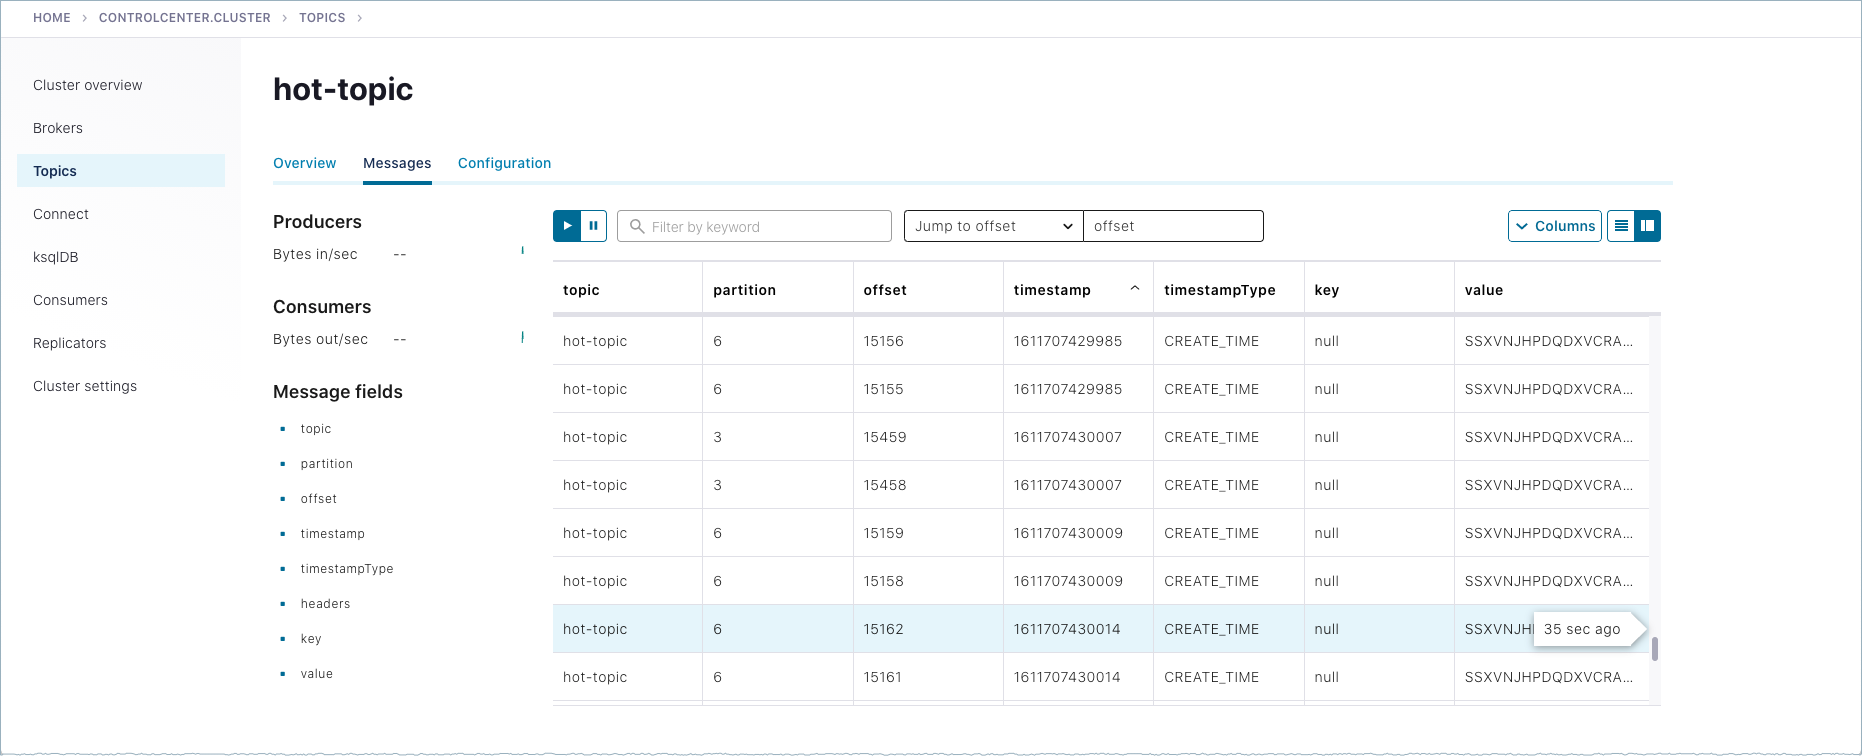
Shutdown and cleanup tasks
Run the following shutdown and cleanup tasks.
Stop the
kafka-producer-perf-testwith Ctl-C in its respective command window.Stop the all of the other components with Ctl-C in their respective command windows, in reverse order in which you started them. For example, stop Control Center (Legacy) first, then other components, followed by Kafka brokers, and finally ZooKeeper.
Run multiple clusters
Another option to experiment with is a multi-cluster deployment. This is relevant for trying out features like Replicator, Cluster Linking, and multi-cluster Schema Registry, where you want to share or replicate topic data across two clusters, often modeled as the origin and the destination cluster.
For a multi-cluster deployment, you must configure and start as many ZooKeeper instances as you want clusters, and multiple Kafka server properties files (one for each broker). For two clusters, you need two ZooKeeper instances, and a minimum of two server properties files, one for each ZooKeeper. This minimal setup would give you two single-broker clusters that you can manage together.
These configurations can be used for data sharing across data centers and regions and are often modeled as source and destination clusters. An example configuration for cluster linking is shown in the diagram below. (A full guide to this setup is available in the Tutorial: Use Cluster Linking to Share Data Across Topics.)
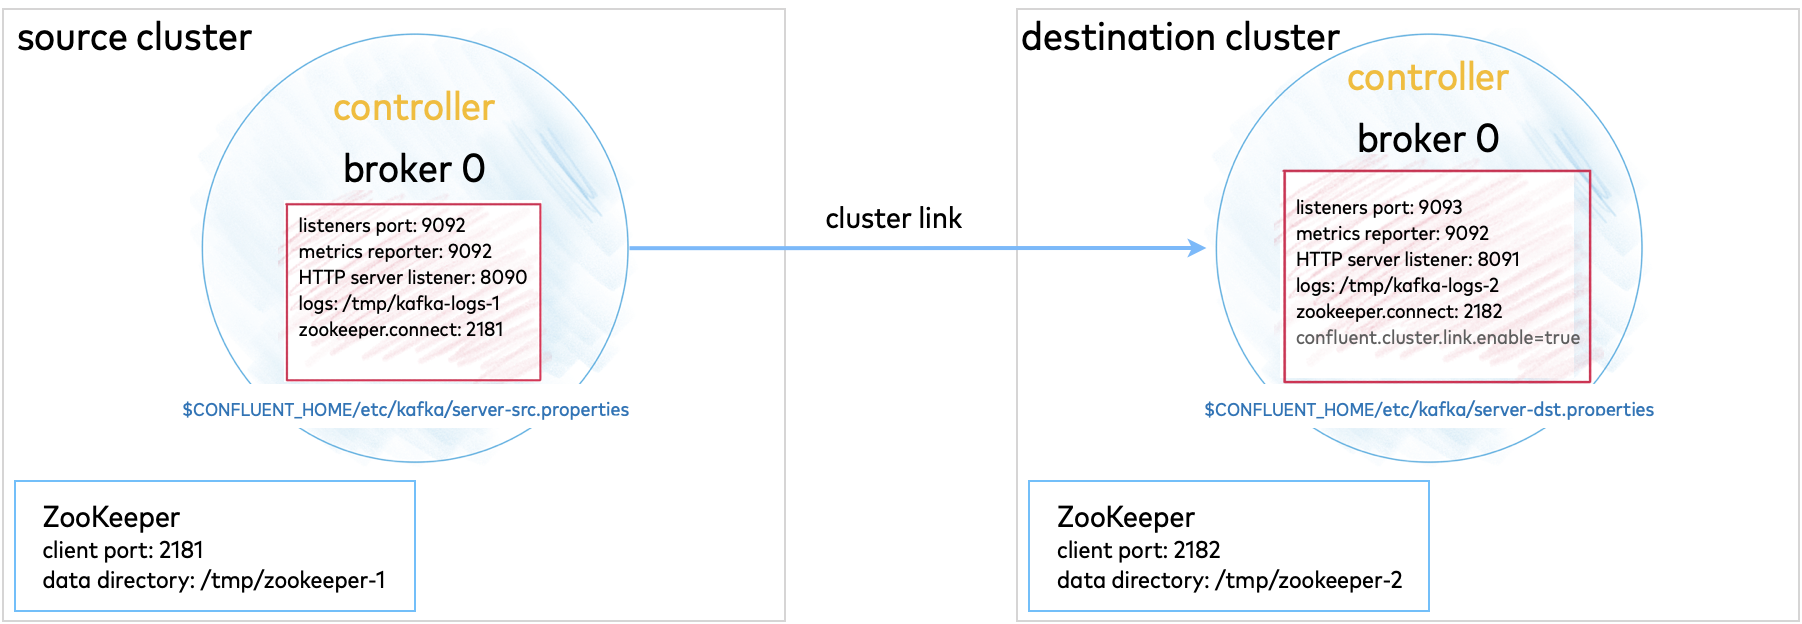
Multi-cluster configurations are described in context under the relevant use cases. Since these configurations will vary depending on what you want to accomplish, the best way to test out multi-cluster is to choose a use case, and follow the feature-specific tutorial.
Tutorial: Use Cluster Linking to Share Data Across Topics (requires Confluent Platform 6.0.0 or newer, recommended as the best getting started example)
Code Examples and Demo Apps
Following are links to examples of Confluent Platform distributed applications that uses Kafka topics, along with producers, and consumers that subscribe to those topics, in an event subscription model. The idea is to complete the picture of how Kafka and Confluent Platform can be used to accomplish a task or provide a service.
Suggested Reading
To learn how serverless infrastructure is built and apply these learnings to your own projects, see Cloud-Native Apache Kafka: Designing Cloud Systems for Speed and Scale
Configure a multi-Node Apache Kafka environment with Docker and cloud providers
Examples: Kafka Streams examples
Examples: Demo Scene examples
- Blog post: Why Can’t I Connect to Kafka? | Troubleshoot Connectivity
An overview of some of the developer tools and utilities available as a part of the Apache Kafka® ecosystem.
- Blog post: Apache Kafka 101
Get started with learning Kafka in three easy steps. Explore guides, watch videos, and get coding with hands-on tutorials from the original creators of Kafka.
- Blog post: Helpful Tools for Apache Kafka Developers
An overview of some of the developer tools and utilities available as a part of the Apache Kafka® ecosystem.