View and Manage Control Center (Legacy) Alert Triggers
Clicking the Alerts Triggers tab shows a summary of all configured triggers:
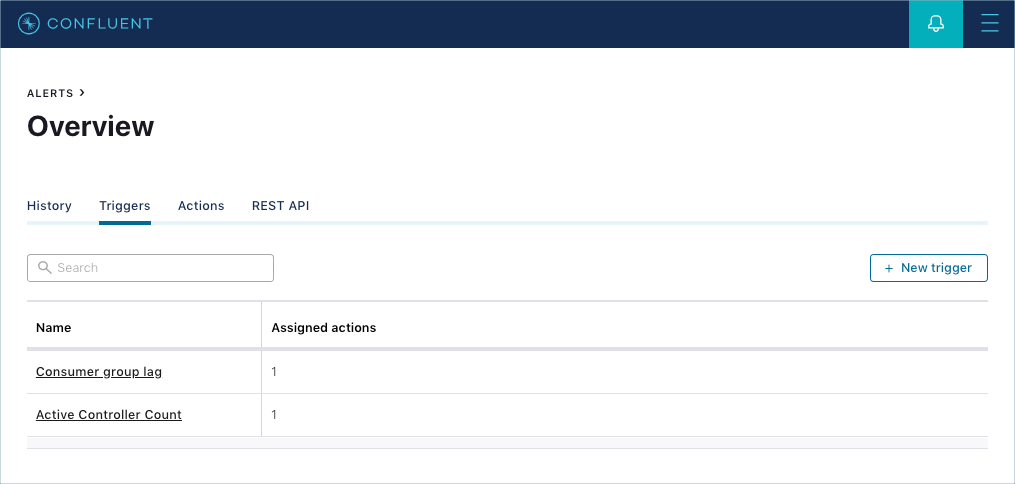
The Triggers page is blank when there are no triggers defined.
Use the Triggers page to:
Create a trigger using the + New trigger button.
View and sort a summary of triggers and their assigned actions.
Search for a trigger.
Triggers and mode
Some component types and metrics are not compatible with Reduced infrastructure mode. If you are running Control Center (Legacy) in Reduced infrastructure mode, Control Center (Legacy) displays only the trigger component types and metrics that are compatible.
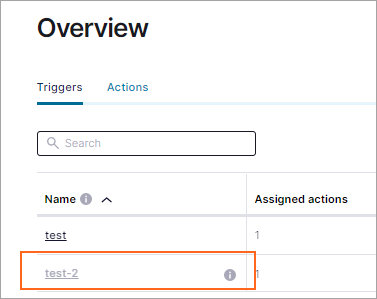
In addition, if you have previously defined triggers and later switched Control Center (Legacy) to Reduced infrastructure mode, some triggers may be grayed out, which indicates the triggers are not compatible. Since they are incompatible with Reduced infrastructure mode, they will not cause any actions to occur.
As a result, you can delete these triggers, but you cannot edit them. The following image shows an example of an incompatible trigger.
In summary, in Reduced infrastructure mode:
You cannot create or edit triggers with a component or metric type that is incompatible with Reduced infrastructure mode.
You can delete triggers with a component or metric type that is incompatible with Reduced infrastructure mode.
The following table lists the trigger components and metrics that are compatible with Normal mode and Reduced infrastructure mode.
Trigger component | Normal mode metrics compatibility | Reduced infrastructure mode metrics compatibility |
|---|---|---|
Broker |
| Component type not compatible |
Cluster |
|
|
Consumer group |
|
|
Topic |
| Component type not compatible |
Create a new trigger
Use the New Trigger form to define the criteria that will activate associated alert actions. Some of the fields are pre-populated when you click Set up an alert from a context menu.
When you create a new trigger, you choose one of the following component types:
As noted above, you can create any kind of trigger when you are running Control Center (Legacy) in Normal mode. Only Cluster and Consumer Group triggers are compatible with Reduced infrastructure mode.
See Example triggers for step-by-step trigger examples.
Broker trigger (Normal mode only)
Use this broker trigger field reference for guidance when adding a broker trigger. You can create and edit this trigger type only when you are running Control Center (Legacy) in Normal mode.
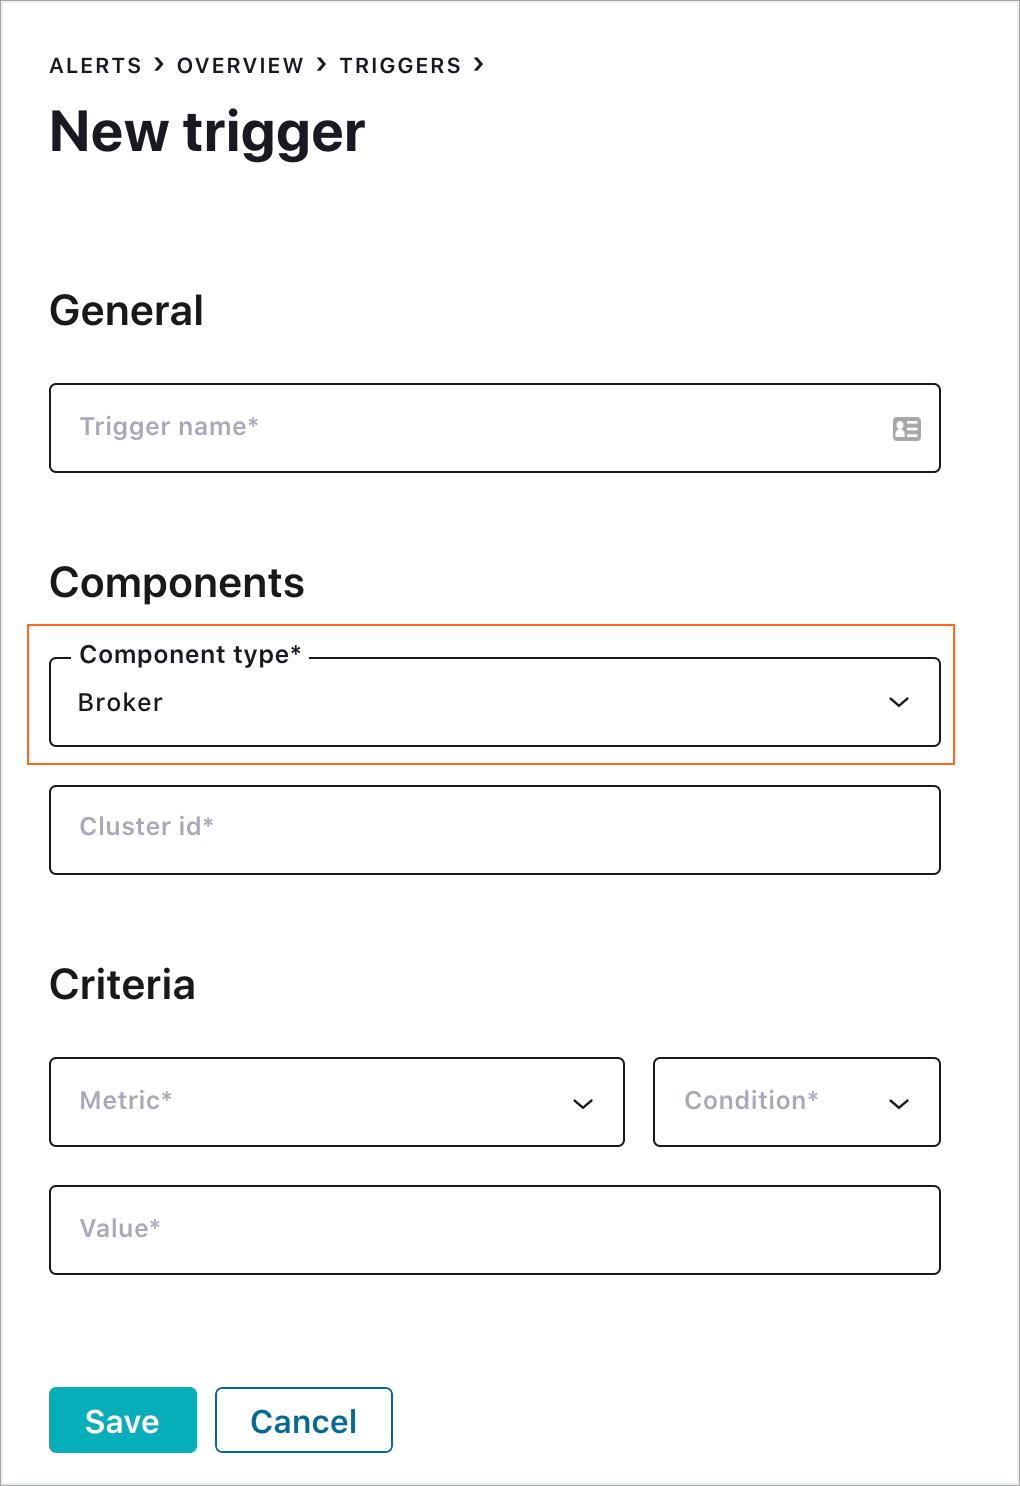
Broker trigger form
- Trigger name
A unique name that identifies the trigger (for example: Broker fetch request latency).
Uniqueness is not enforced. Use unique and descriptive names to avoid confusion.
- Component type
Select the Broker component type.
- Cluster id
Select a cluster to trigger based on conditions of individual brokers.
There is a known issue when multiple clusters are selected for a broker or cluster trigger. As a recommended best practice, only select a single cluster for the trigger. For more information, see the known issues section in the release notes.
- Metric
Metrics are triggered on a per-broker basis. Any broker that meets the defined condition will trigger individually. Choose one of the following metrics to monitor:
Bytes:
Number of bytes per second produced a broker.
Bytes out:
Number of bytes per second fetched from a broker (does not account for internal replication traffic).
Fetch request latency:
Latency of fetch requests to this broker at the median, 95th, 99th, or 99.9th percentile (in milliseconds).
Production request count:
Total number of produce requests to a broker (requests per minute).
Production request latency:
Latency of produce requests to this broker at the median, 95th, 99th, or 99.9th percentile (in milliseconds).
- Condition
The trigger will fire when the Condition is true of the comparison between the value of the metric being monitored and the value of the Value field. Possible options are Greater than, Less than, Equal to, Not equal to, Online, or Offline, depending on the selected Metric.
- Value
The value to which the broker Metric is compared.
Cluster trigger (both modes)
Use this cluster trigger field reference for guidance when adding a cluster trigger. You can create and edit this trigger type when you are running Control Center (Legacy) in either All or Reduced infrastructure mode.
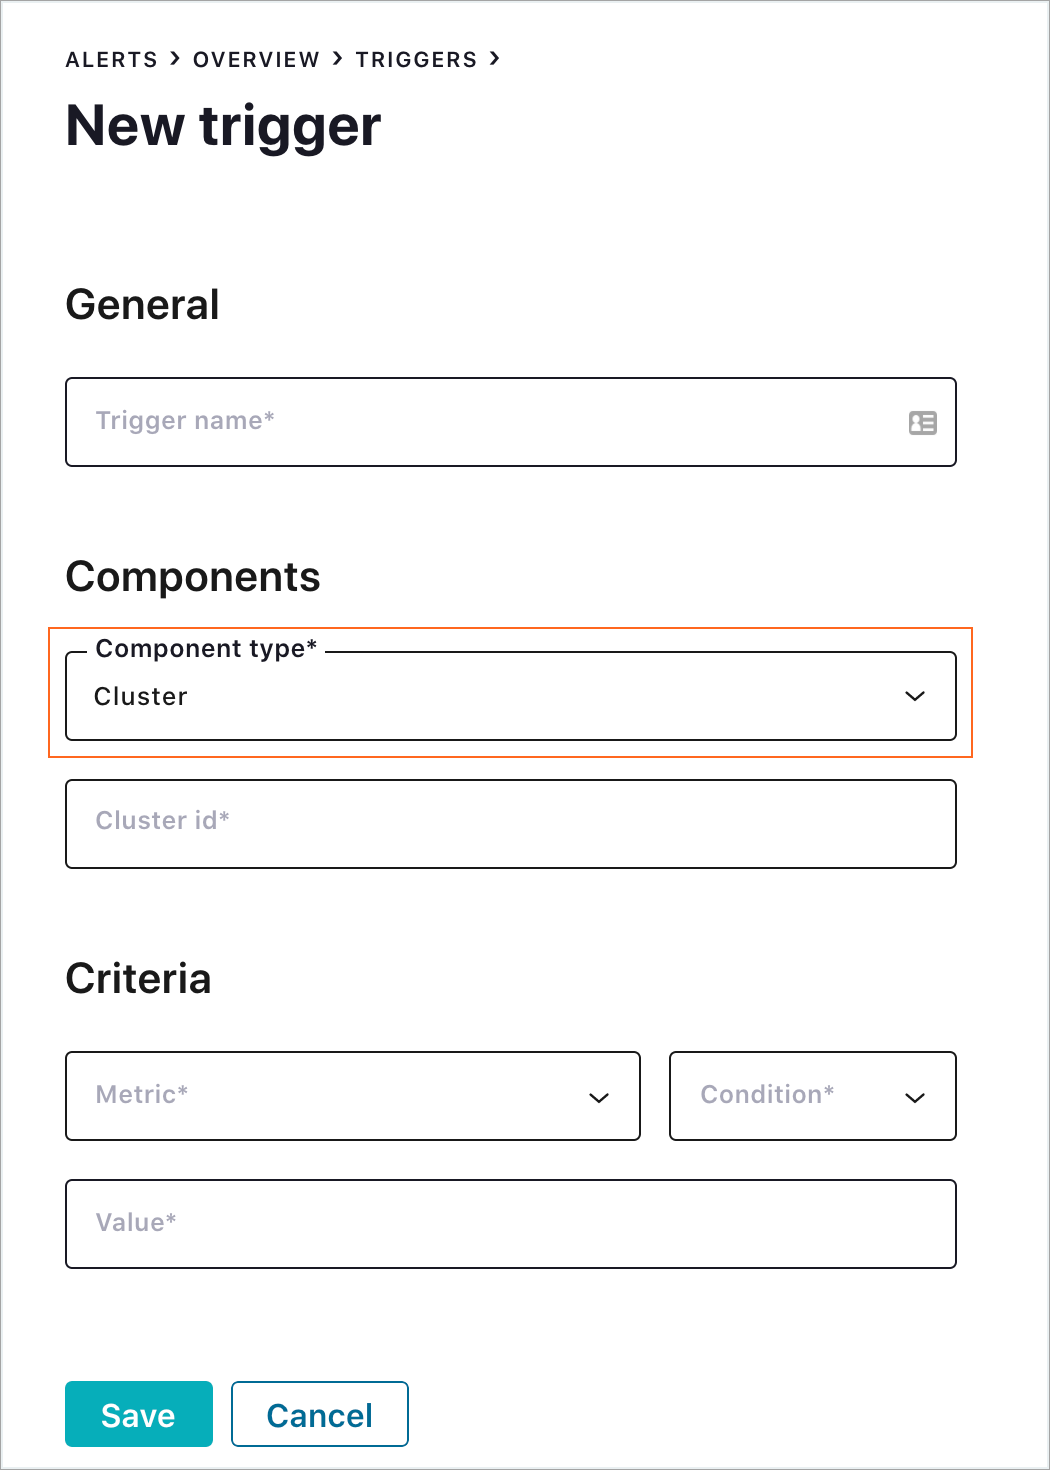
- Trigger name
A unique name that identifies the trigger (for example:
Control Center Cluster down).Uniqueness is not enforced. Use unique and descriptive names to avoid confusion.
- Component type
Select the Cluster component type.
- Cluster id
Select a cluster to trigger based on a defined condition.
There is a known issue when multiple clusters are selected for a broker or cluster trigger. As a recommended best practice, only select a single cluster for the trigger. For more information, see the known issues section in the release notes.
- Metric
Values in Metric are triggered on a cluster-wide basis. A cluster that meets the defined condition triggers an associated action. Choose one of the following metrics to monitor:
Cluster down:
A trigger should be created for Condition
Yes. See Control Center (Legacy) cluster down status.Leader election rate:
Number of partition leader elections.
Offline topic partitions:
Total number of topic partitions in the cluster that are offline. This can happen if the brokers with replicas are down, or if unclean leader election is disabled and the replicas are not in sync and thus none can be elected leader (may be desirable to ensure no messages are lost).
A trigger should be created for values
> 0(Greater than zero).Unclean election count:
The number of unclean partition leader elections in the cluster reported in the last interval.
When unclean leader election is held among out-of-sync replicas, there is a possibility of data loss if any messages were not synced prior to the loss of the former leader. So if the number of unclean elections is greater than 0, investigate broker logs to determine why leaders were re-elected, and look for WARN or ERROR messages. Consider setting the broker configuration parameter
unclean.leader.election.enabletofalseso that a replica outside of the set of in-sync replicas is never elected leader.A trigger should be created for values
!= 0(Not equal to zero).Under replicated topic partitions:
Total number of topic partitions in the cluster that are under-replicated; i.e., partition with number of in-sync replicas less than replication factor.
A trigger should be created for values
> 0(Greater than zero).Zookeeper status:
Indicates whether brokers able to connect to ZooKeeper. Online and Offline are possible values.
Zookeeper expiration rate:
Rate at which brokers are experiencing ZooKeeper session expirations (number of expirations per second).
- Condition
The trigger will fire when the Condition is true of the comparison between the value of the metric being monitored and the value of the Value field. Possible options are Greater than, Less than, Equal to, Not equal to, Online, or Offline, depending on the selected Metric.
- Value
The value to which the cluster Metric is compared.
Consumer Group trigger (both modes)
Use this consumer group trigger field reference for guidance when adding a consumer group trigger. You can create or edit this trigger type when you are running Control Center (Legacy) in either All or Reduced infrastructure mode.
Note that to monitor average and max latency, you must configure Monitoring Interceptors on the client apps in that consumer group. For more information, see Monitor Production and Consumption in Control Center (Legacy).
Important
Consumer group alerts in Confluent Control Center (Legacy) are based on the total cumulative lag for all partitions in all topics consumed in a Consumer group.
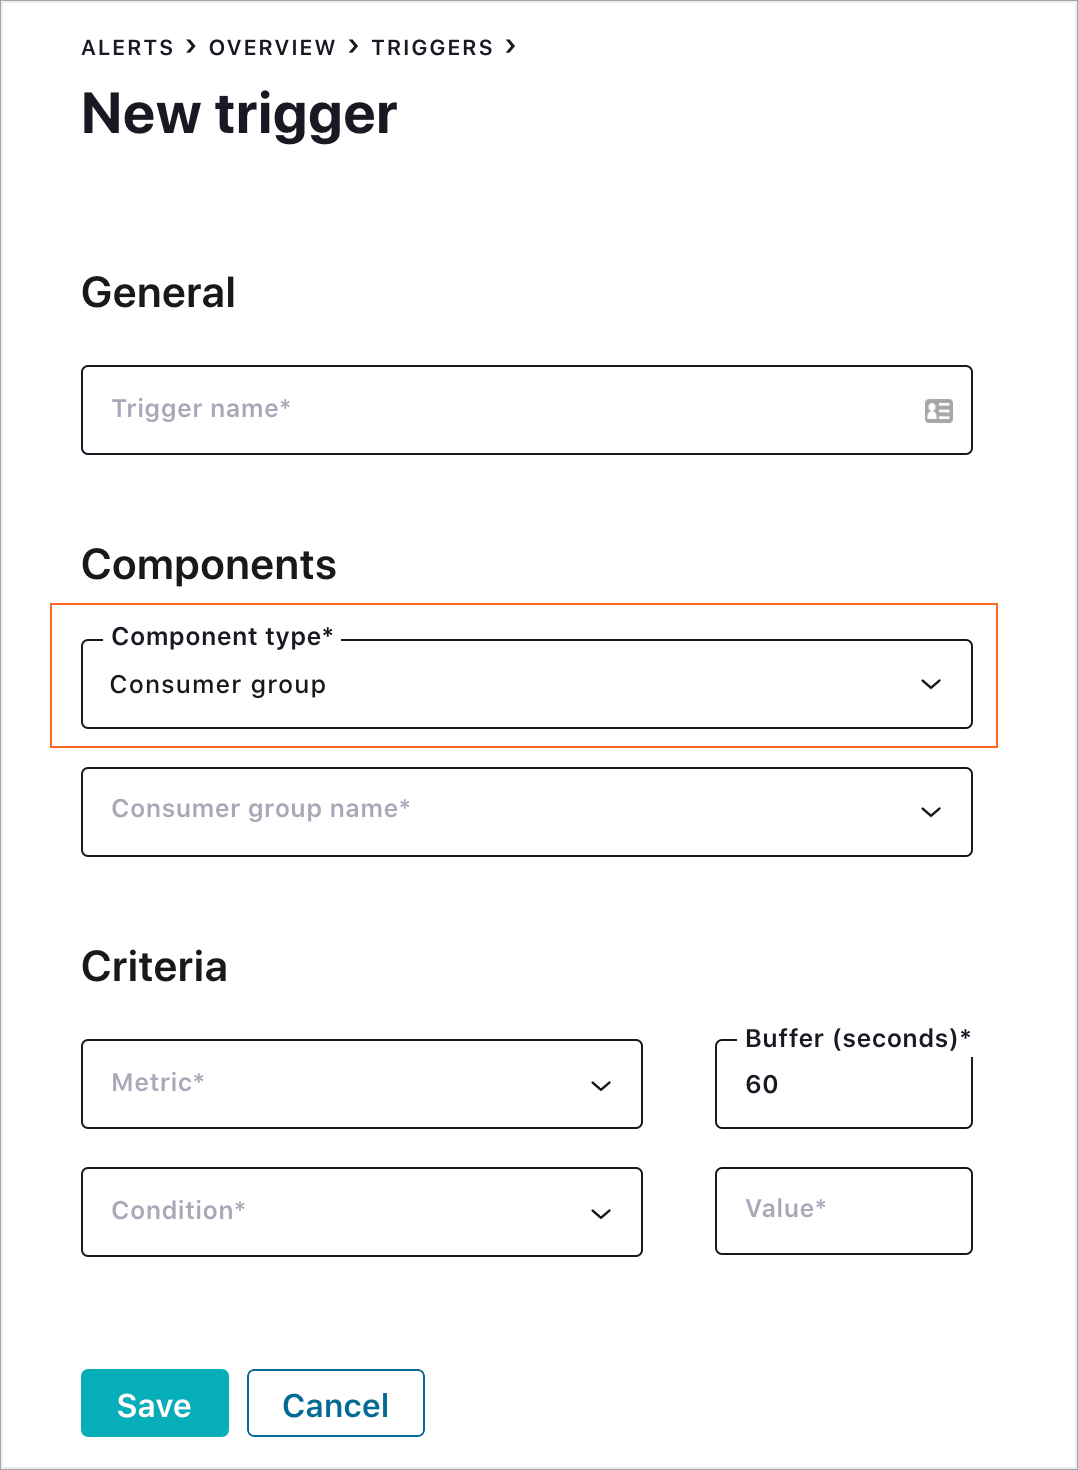
Consumer Group trigger form
- Trigger name
A unique name that identifies the trigger (for example: consumer group name under consumption).
Uniqueness is not enforced. Use unique and descriptive names to avoid confusion.
- Component type
Should be pre-selected as Consumer group (default type) if the Set up an alert button was clicked from the Consumer lag page. Otherwise, select Consumer group.
- Consumer group name
The name of the consumer group to monitor for anomalies.
- Metric
Choose one of the following metrics to monitor:
Average latency (ms):
Average latency of the consumer group in milliseconds. To monitor this metric, you must configure Monitor Production and Consumption in Control Center (Legacy) for clients in the consumer group.
Consumer lag:
How far behind consumer applications are while consuming from their producer applications. The consumer lag is the difference between the end offset and the current offset. Tracks the opposite of Consumer lead.
Consumer lead:
How far ahead consumer applications are while consuming from producer applications. The consumer lead is the difference between the current offset and the beginning offset. For example, a consumer at offset 15 in a partition that starts at offset 0 would have a lead of 15. This alert metric indicates when consumption is close to the earliest available messages, which means there is potential for data loss. Tracks the opposite of Consumer lag.
Consumption difference:
The difference between the expected consumption value and the actual consumption value within a given time bin. Typically, there is a gap between expected and actual consumption that is very close to real time. This gap should diminish over time.
Maximum latency (ms):
Maximum latency of the consumer group in milliseconds. To monitor this metric, you must configure Monitor Production and Consumption in Control Center (Legacy) for clients in the consumer group.
- Condition
The trigger will fire when the Condition is true of the comparison between the value of the metric being monitored and the value of the Value field. Available options are Greater than, Less than, Equal to, or Not equal to.
- Value
The value to which the monitored consumer group Metric is compared.
Topic trigger (Normal mode only)
Use this topic trigger field reference for guidance when adding a topic trigger. You can create or edit this trigger type only when you are running Control Center (Legacy) in Normal mode.
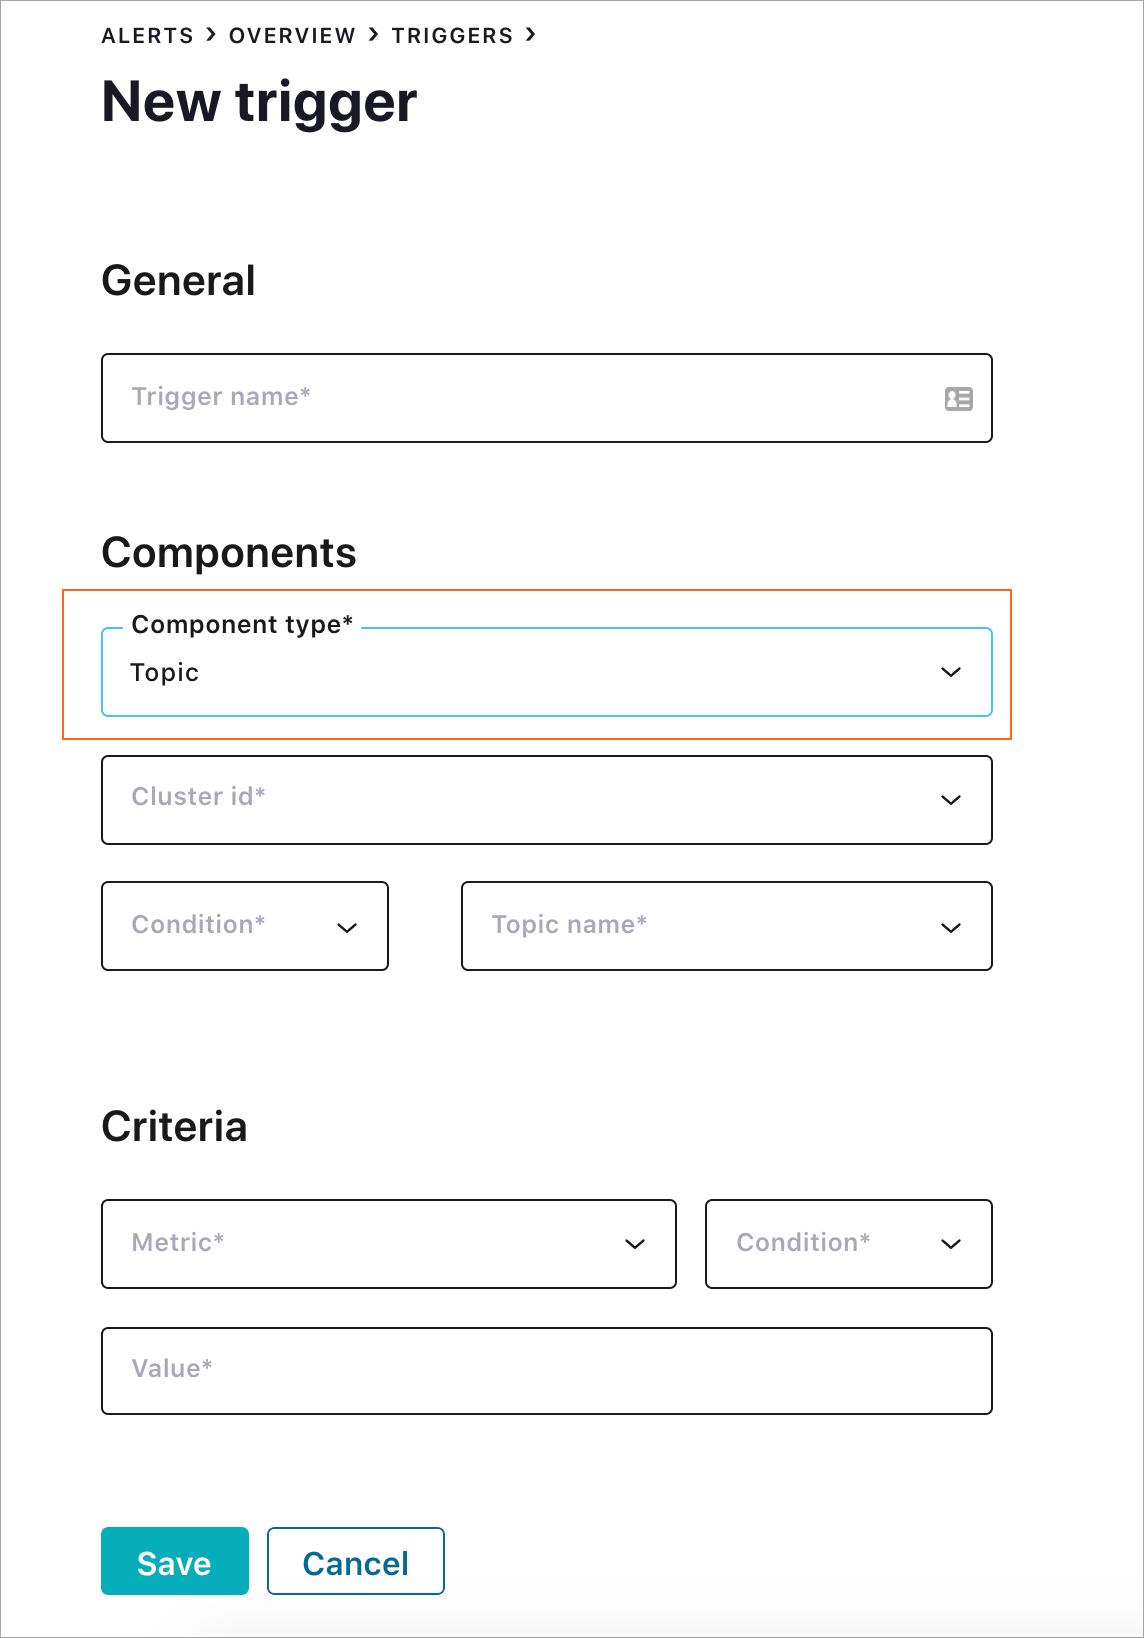
Topic trigger form
- Trigger name
A unique name that identifies the trigger (for example: topic name production requests).
Uniqueness is not enforced. Use unique and descriptive names to avoid confusion.
- Component type
Select Topic . Topic may be preselected if you clicked Set up an alert from the legacy System Health > Topics tab or within another page context menu.
- Cluster id
The trigger for a topic is limited to a specific cluster ID. If you require a topic to be triggered by multiple clusters, create independent triggers for each cluster.
- Condition
A select list of options for matching against the value field (below). The name of the topic can Equals, Begins with, Ends with, or Contains a specified value.
For example, selecting Contains and then entering ‘topic’ into the value field will match ‘my topic’, ‘topical’, and ‘topics with data’. If Begins with is selected, the trigger will only match ‘topical’ and ‘topics with data’, not ‘my topic’.
- Topic name
The name or part of a topic name to be triggered against. Works in conjunction with Condition to match against one or more topics. A message appears when there are greater than five topics that match the criteria. Narrow the criteria if you see this message.
If multiple topics match against topic name, the trigger will be per topic, not an aggregate. In the case where there are two topics that Begin with ‘mytopic’; and the trigger is set to
Bytes infor Metric,Greater thanfor Condition, and100for Value, any ‘mytopic’ matches will fire the trigger if they get > 100 Bytes In.- Metric
The value to check for the trigger alert. Choose one of the following metrics to monitor:
Bytes in:
Amount of bytes per second coming in to a topic.
Bytes out:
Amount of bytes per second going out from a topic (does not account for internal replication traffic).
Out of sync replica count:
Total number of topic partition replicas in a cluster that are in sync with the leader; i.e., sum of each (topic partition * topic replication factor).
Production request count:
Amount of production requests per second to a topic in a cluster.
Under-replicated topic partitions:
Amount of under-replicated topic partitions. A use case for this metric is determining if a Kafka broker crashed while holding a specific topic partition.
- Condition:
The trigger will fire when a Condition is true for the comparison between the value of the metric being monitored and the value of the Value field. Available options are Greater than, Less than, Equal to, or Not equal to.
- Value
The value to which the topic Metric is compared.
Edit an alert trigger
Click the Alerts bell icon in the top banner. The Alerts page opens to the History tab by default.
Click the Triggers tab.
Click the name of the trigger. If the name is grayed out, it is not compatible with the mode in which you are running Control Center (Legacy).
Click Edit.
Make your desired changes to the trigger fields.
Click Save.
Delete an alert trigger
Click the Alerts bell icon in the top banner. The Alerts page opens to the History tab by default.
Click the Triggers tab.
Click the name of the trigger.
Click Delete.
Click OK to confirm that you want to delete the trigger.