View Topic Metrics in Control Center (Legacy)
You can view production, consumption, and consumer lag metrics for a topic if you are running Control Center (Legacy) in Normal mode.
Important
If you are running Control Center (Legacy) in Reduced infrastructure mode, you cannot view topic metrics.
View topic production metrics
View throughput and failed produce requests.
Select a cluster from the navigation bar and click the Topics menu. The Manage Topics with Confluent Control Center (Legacy) opens.
Click the topic name link. The Topic details opens.
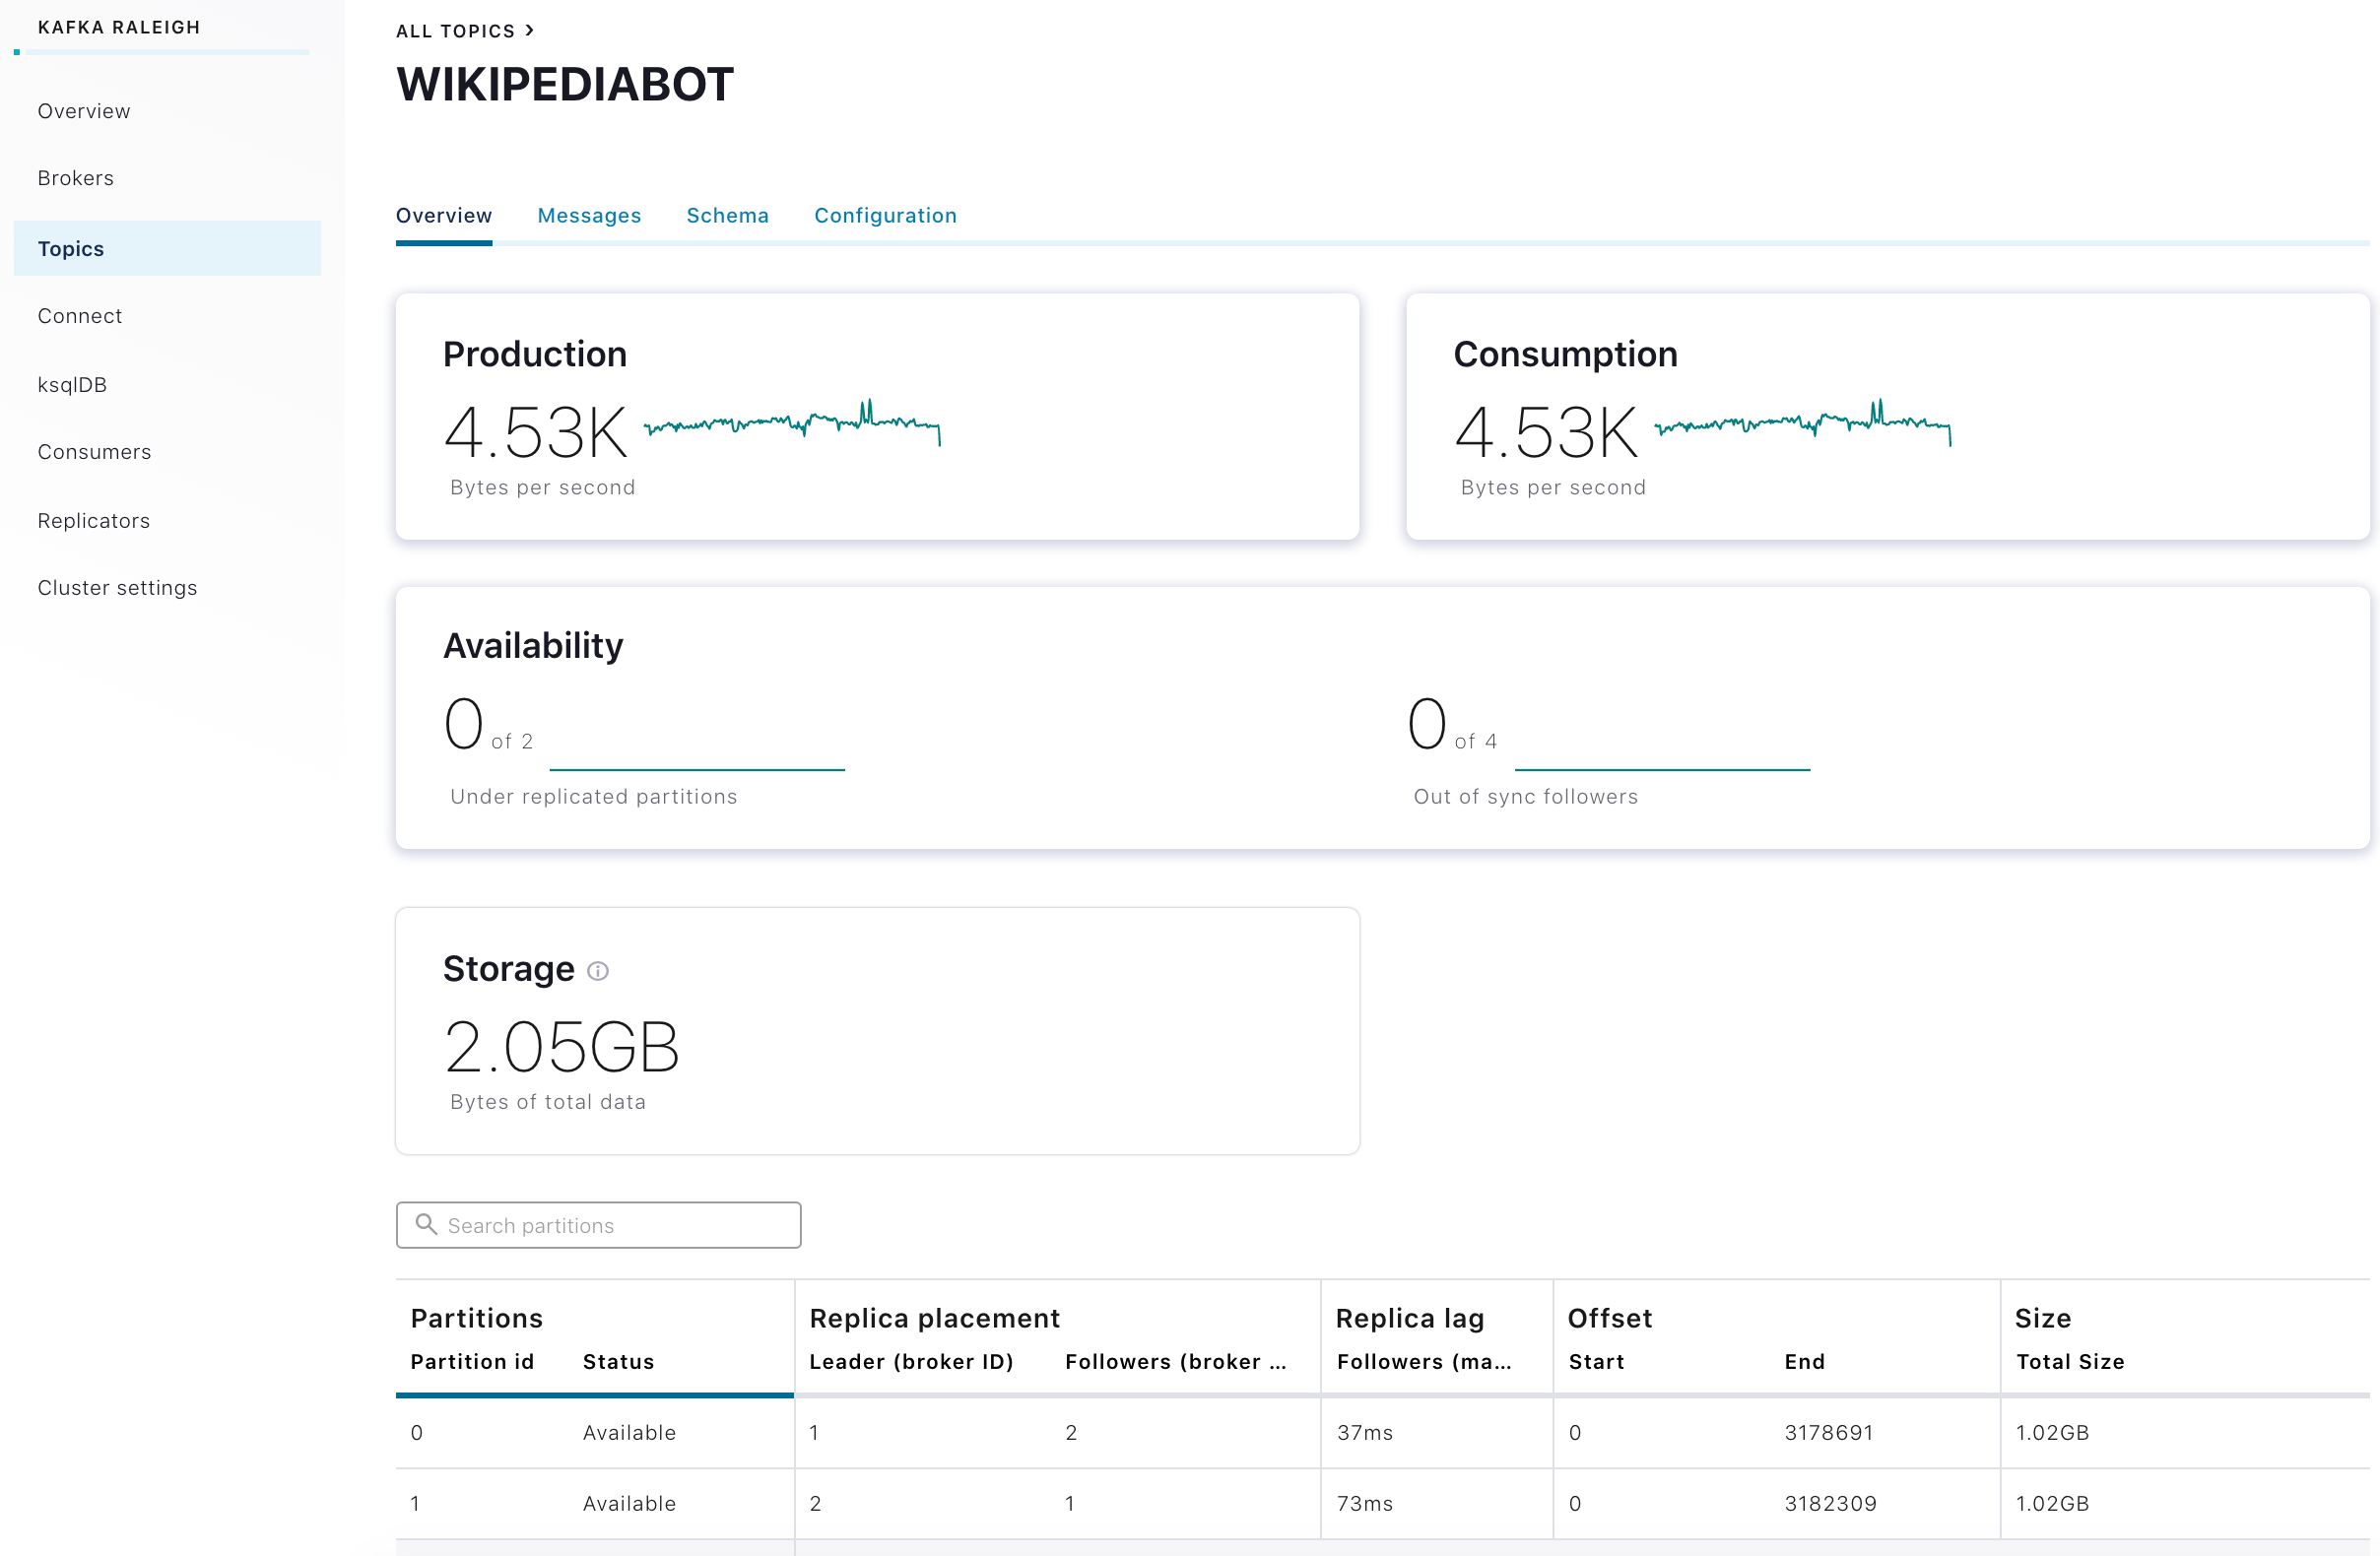
Topics Overview clickable metrics panels
Click the Production panel to access the metrics.
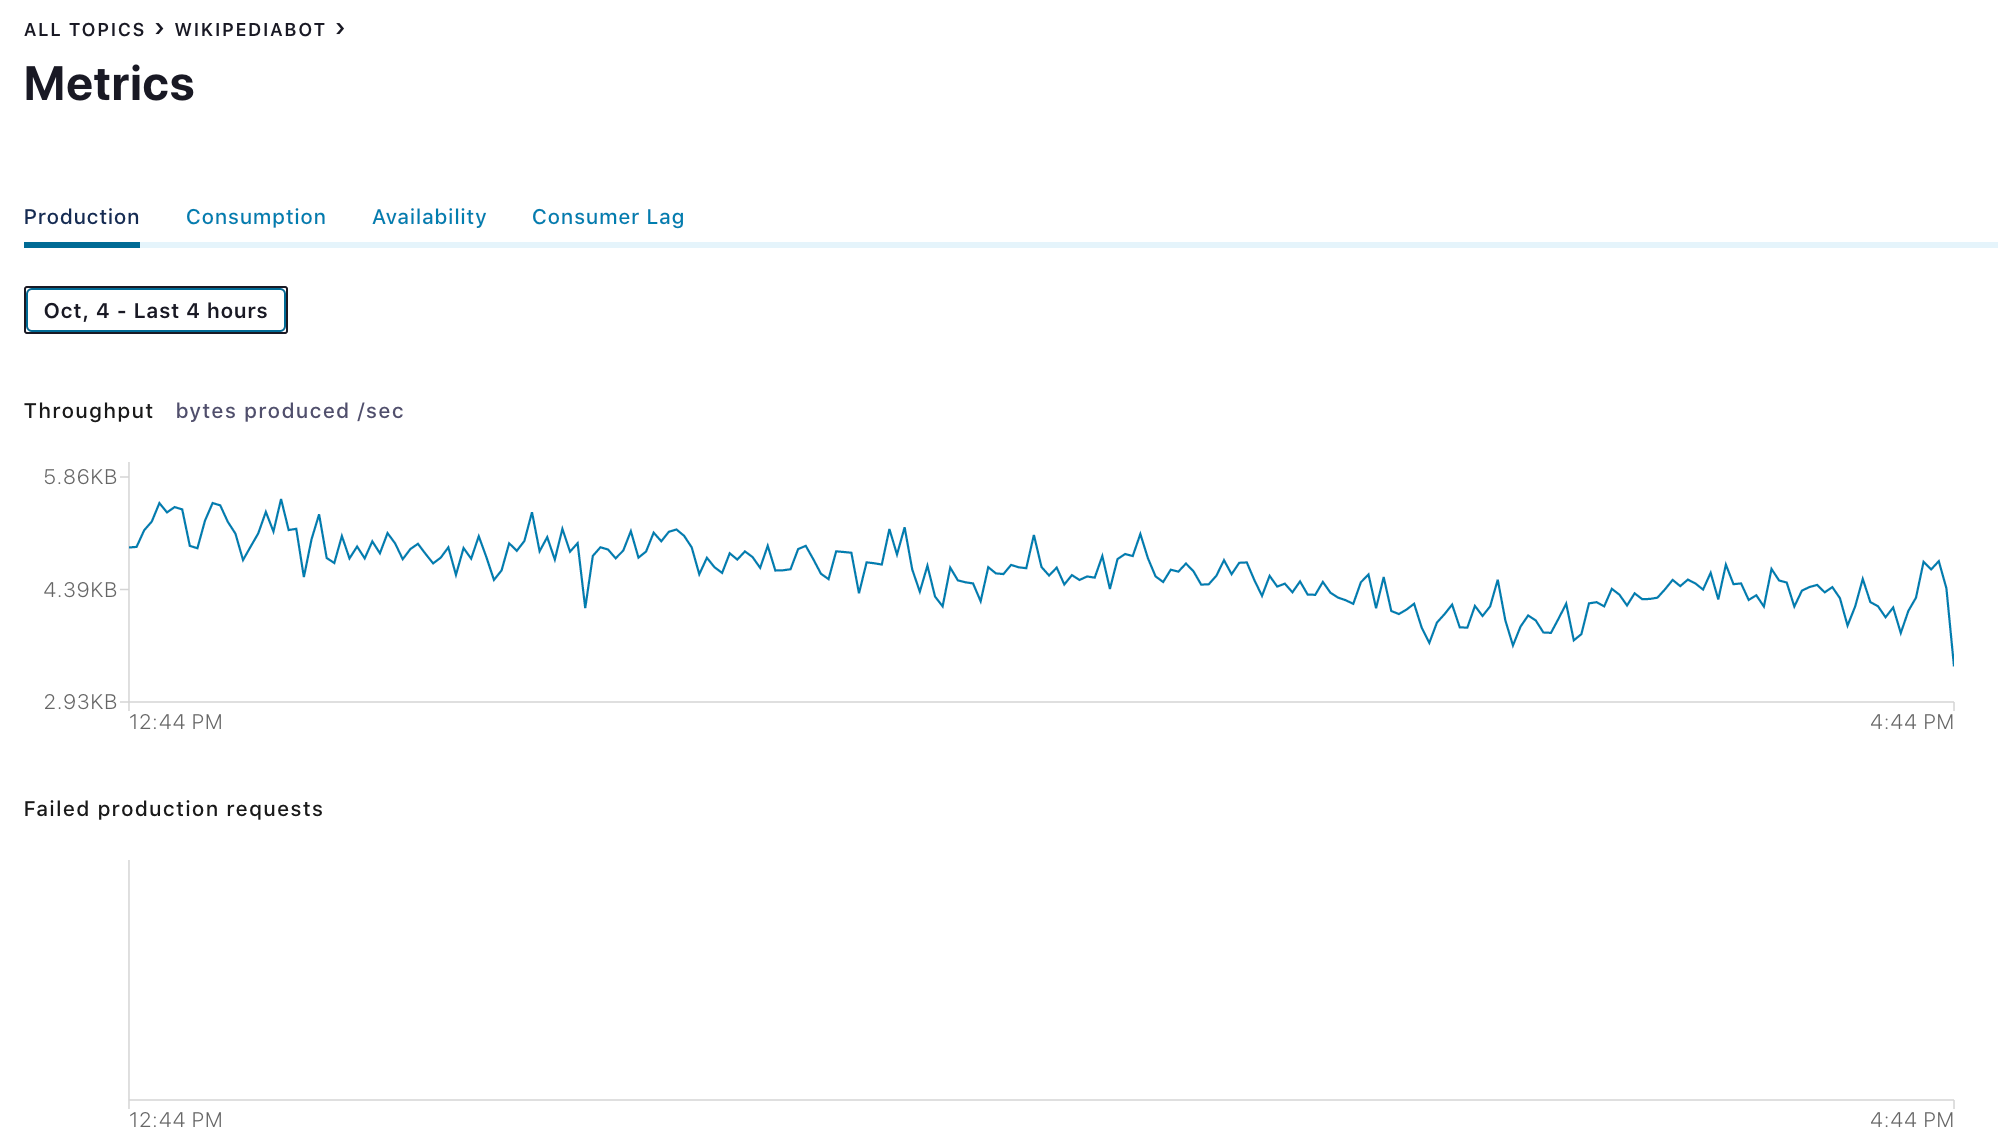
Production metrics for an individual topic
View topic consumption metrics
View throughput, failed consumer requests, percentage of messages consumed, and end-to-end latency.
Select a cluster from the navigation bar and click the Topics menu. The Manage Topics with Confluent Control Center (Legacy) opens.
Click the topic name link. The Topic details opens.
Click the Consumption panel to access the metrics.
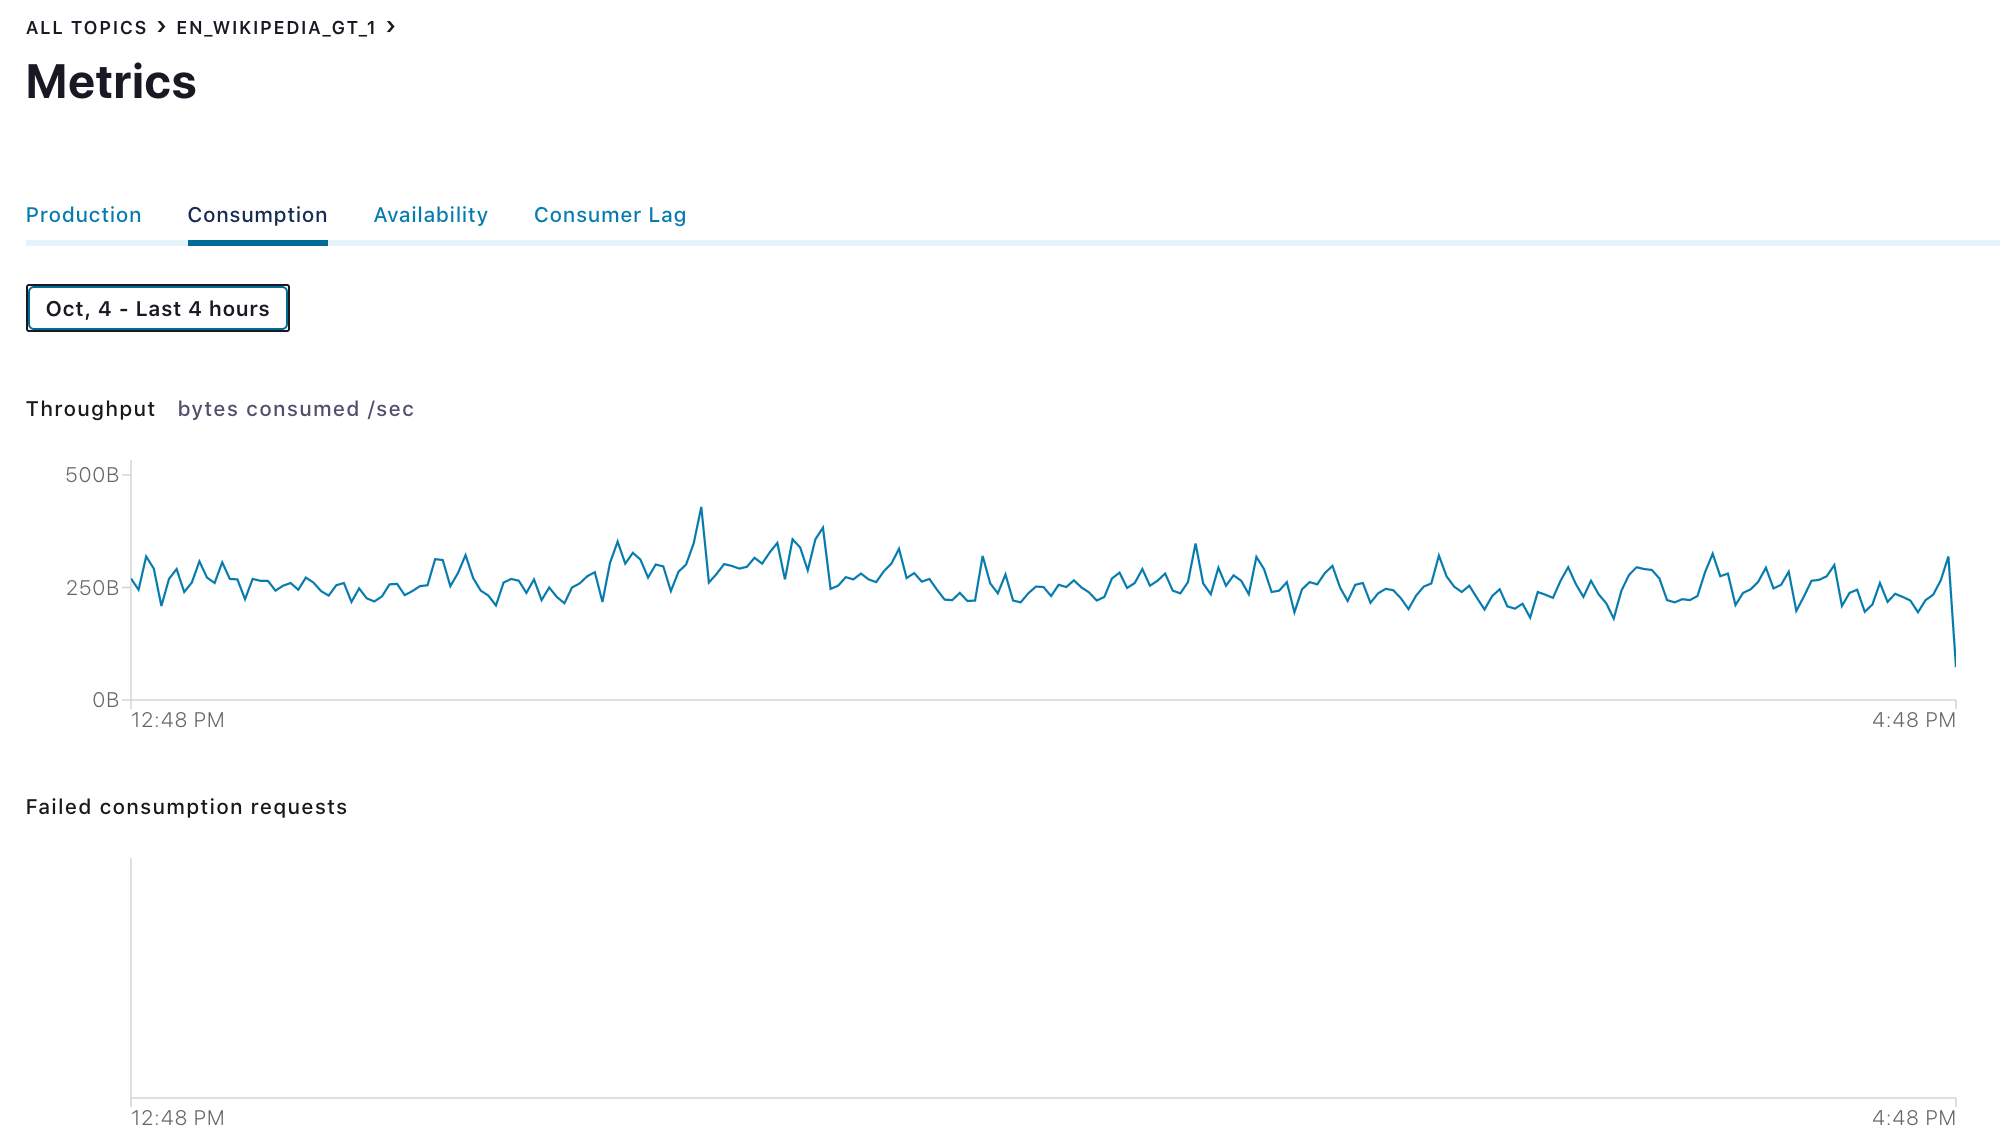
Consumption metrics for an individual topic
View topic availability metrics
View charts of under-replicated partitions and out of sync replicas.
Select a cluster from the navigation bar and click the Topics menu. The Manage Topics with Confluent Control Center (Legacy) opens.
Click the topic name link. The Topic details opens.
Click the Availability panel to access the metrics.

Availability metrics for an individual topic
View consumer lag for a topic
View consumer lag for an individual topic in a consumer group.
Tip
You can view consumer lag for a consumer group from the Consumers menu.
Select a cluster from the navigation bar and click the Topics menu. The Manage Topics with Confluent Control Center (Legacy) opens.
Click the topic name link. The Topic details opens.
Click the Consumption panel.
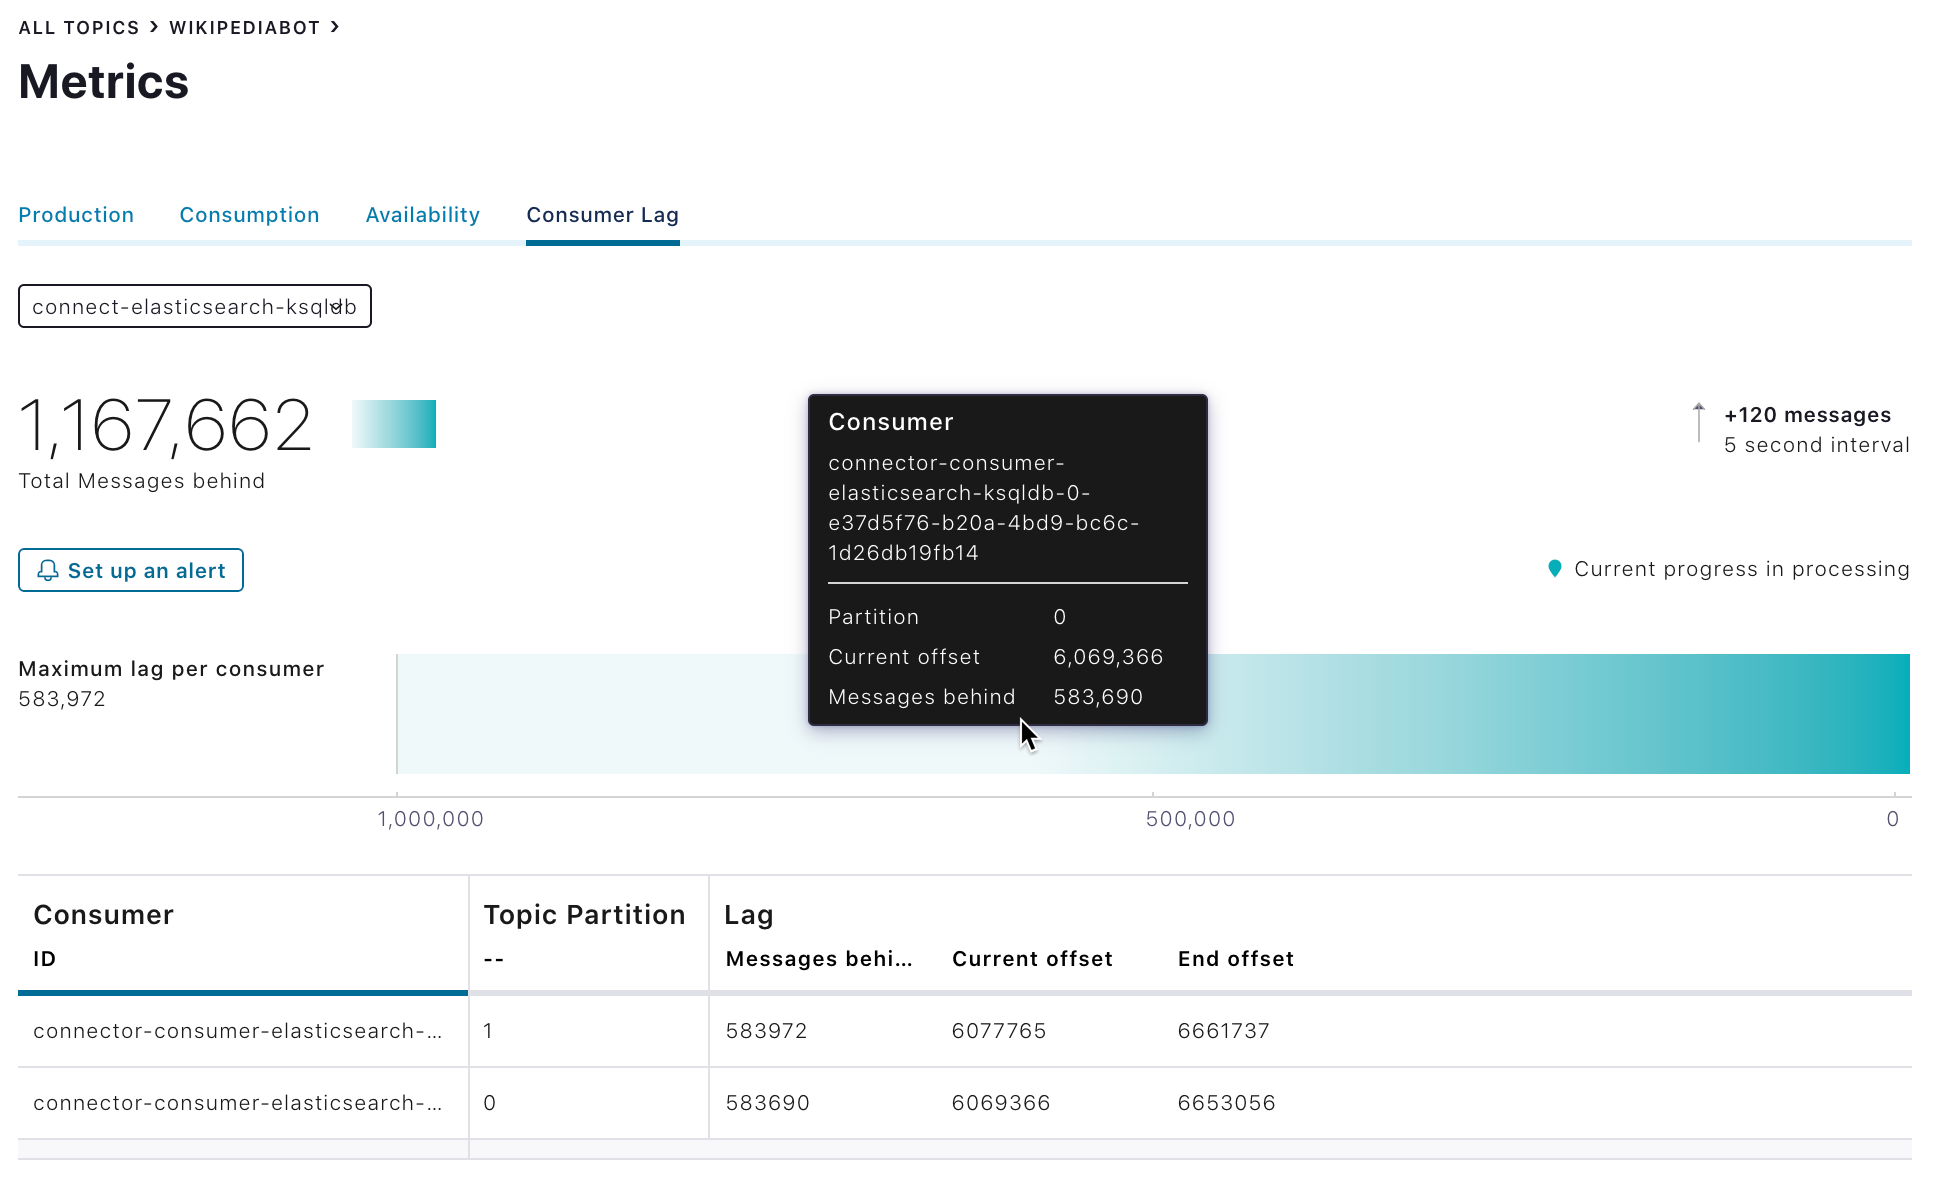
Click the Consumer Lag tab. The consumer lag details are displayed for the topic, including:
Total messages behind and the measured interval.
A visualization of lag. The Maximum lag per consumer graph displays a pin point of each partition in the topic.
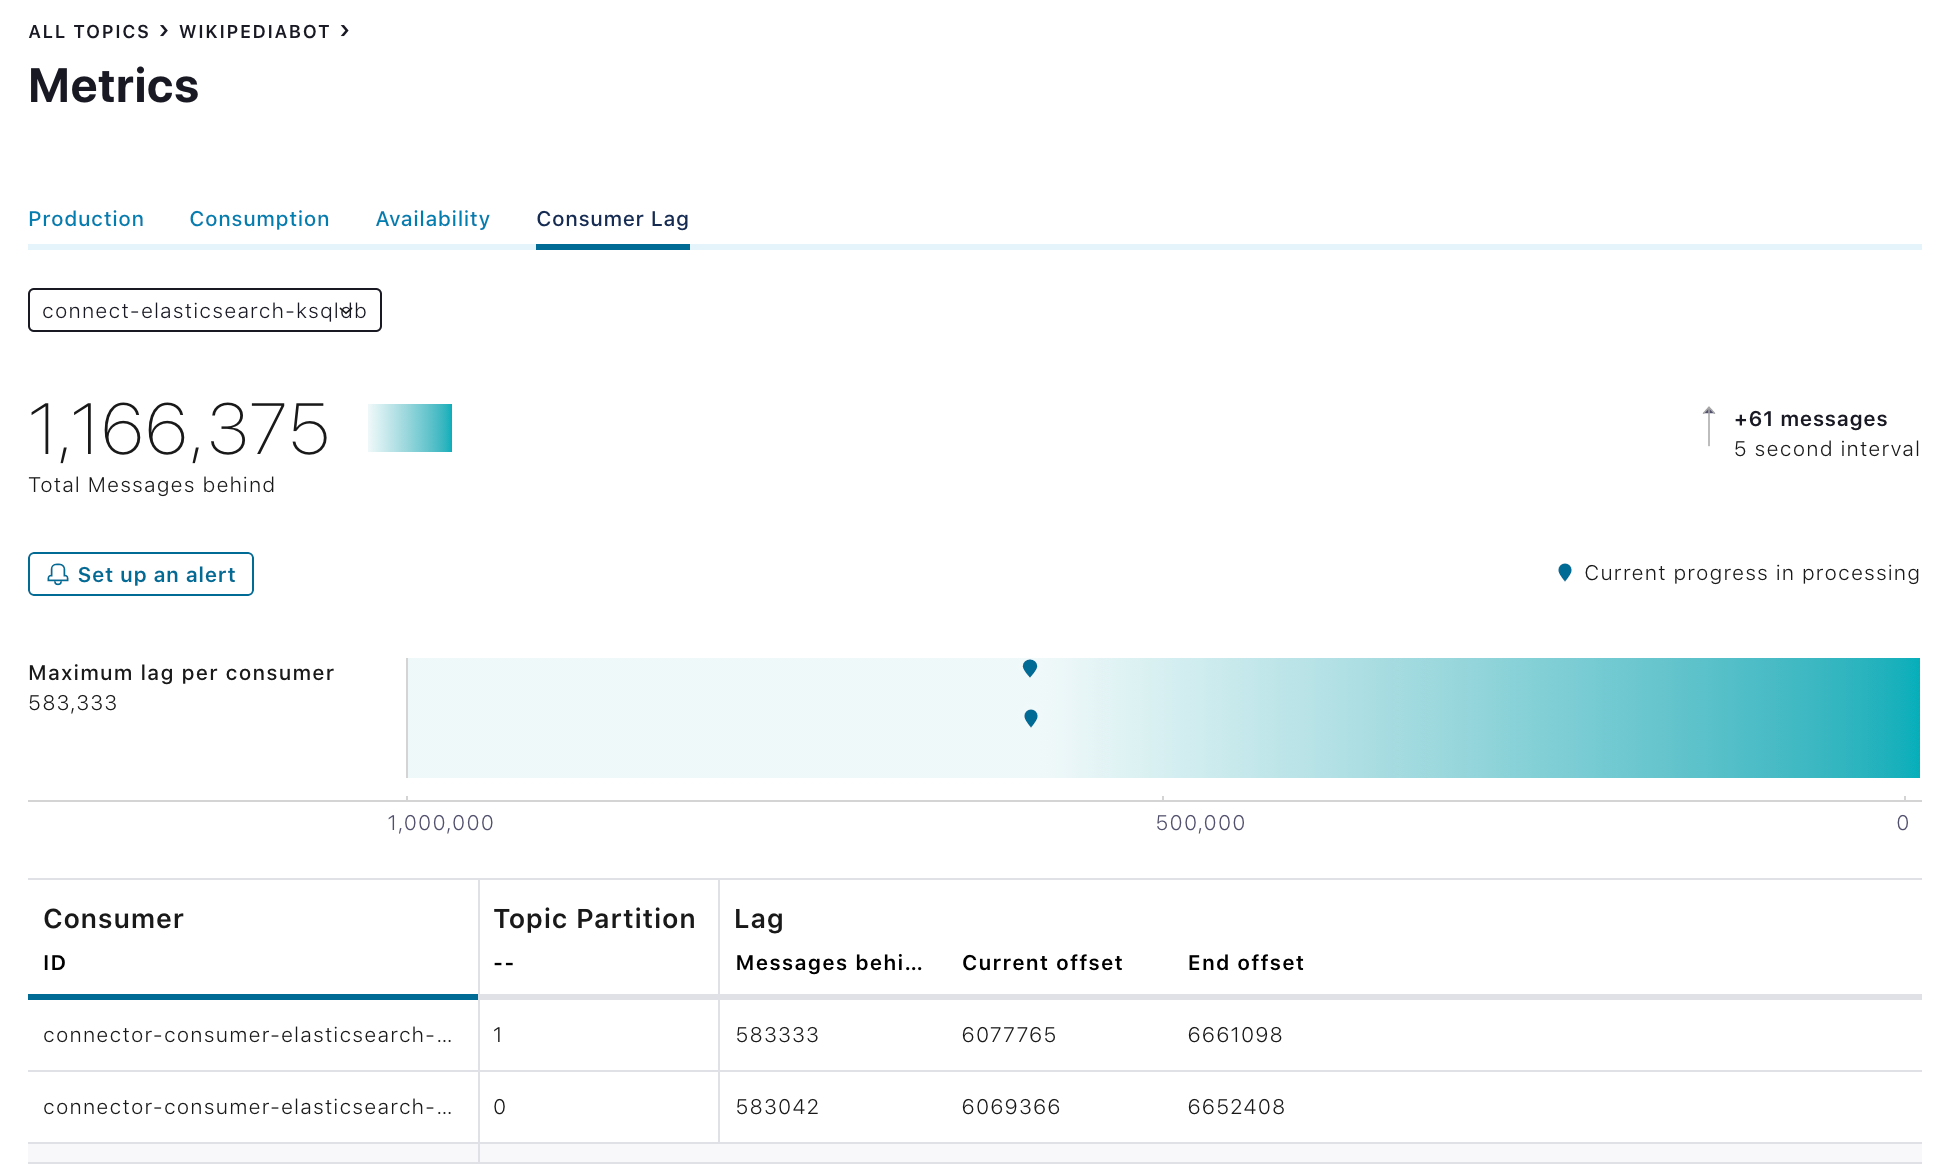
Consumer lag for an individual topic in a consumer group
To view details for a particular point on the graph, click its pin. View the Consumer, Partition, Current offset, and Messages behind for that particular point.
Tip
Click Set up an alert to set up an alert for unacceptable consumer lag. For an example trigger, see Create a consumer group trigger for consumer lag.