
Monitor Using Health+ Dashboard for Confluent Platform
Access the Health+ Monitoring Dashboard with the following steps.
In your on-premises Confluent Platform cluster, enable telemetry for Health+.
Log in to Confluent Cloud.
Navigate to Clusters to open the Health+ clusters page.
Click the cluster tile for your Confluent Platform deployment to open the monitoring dashboard.
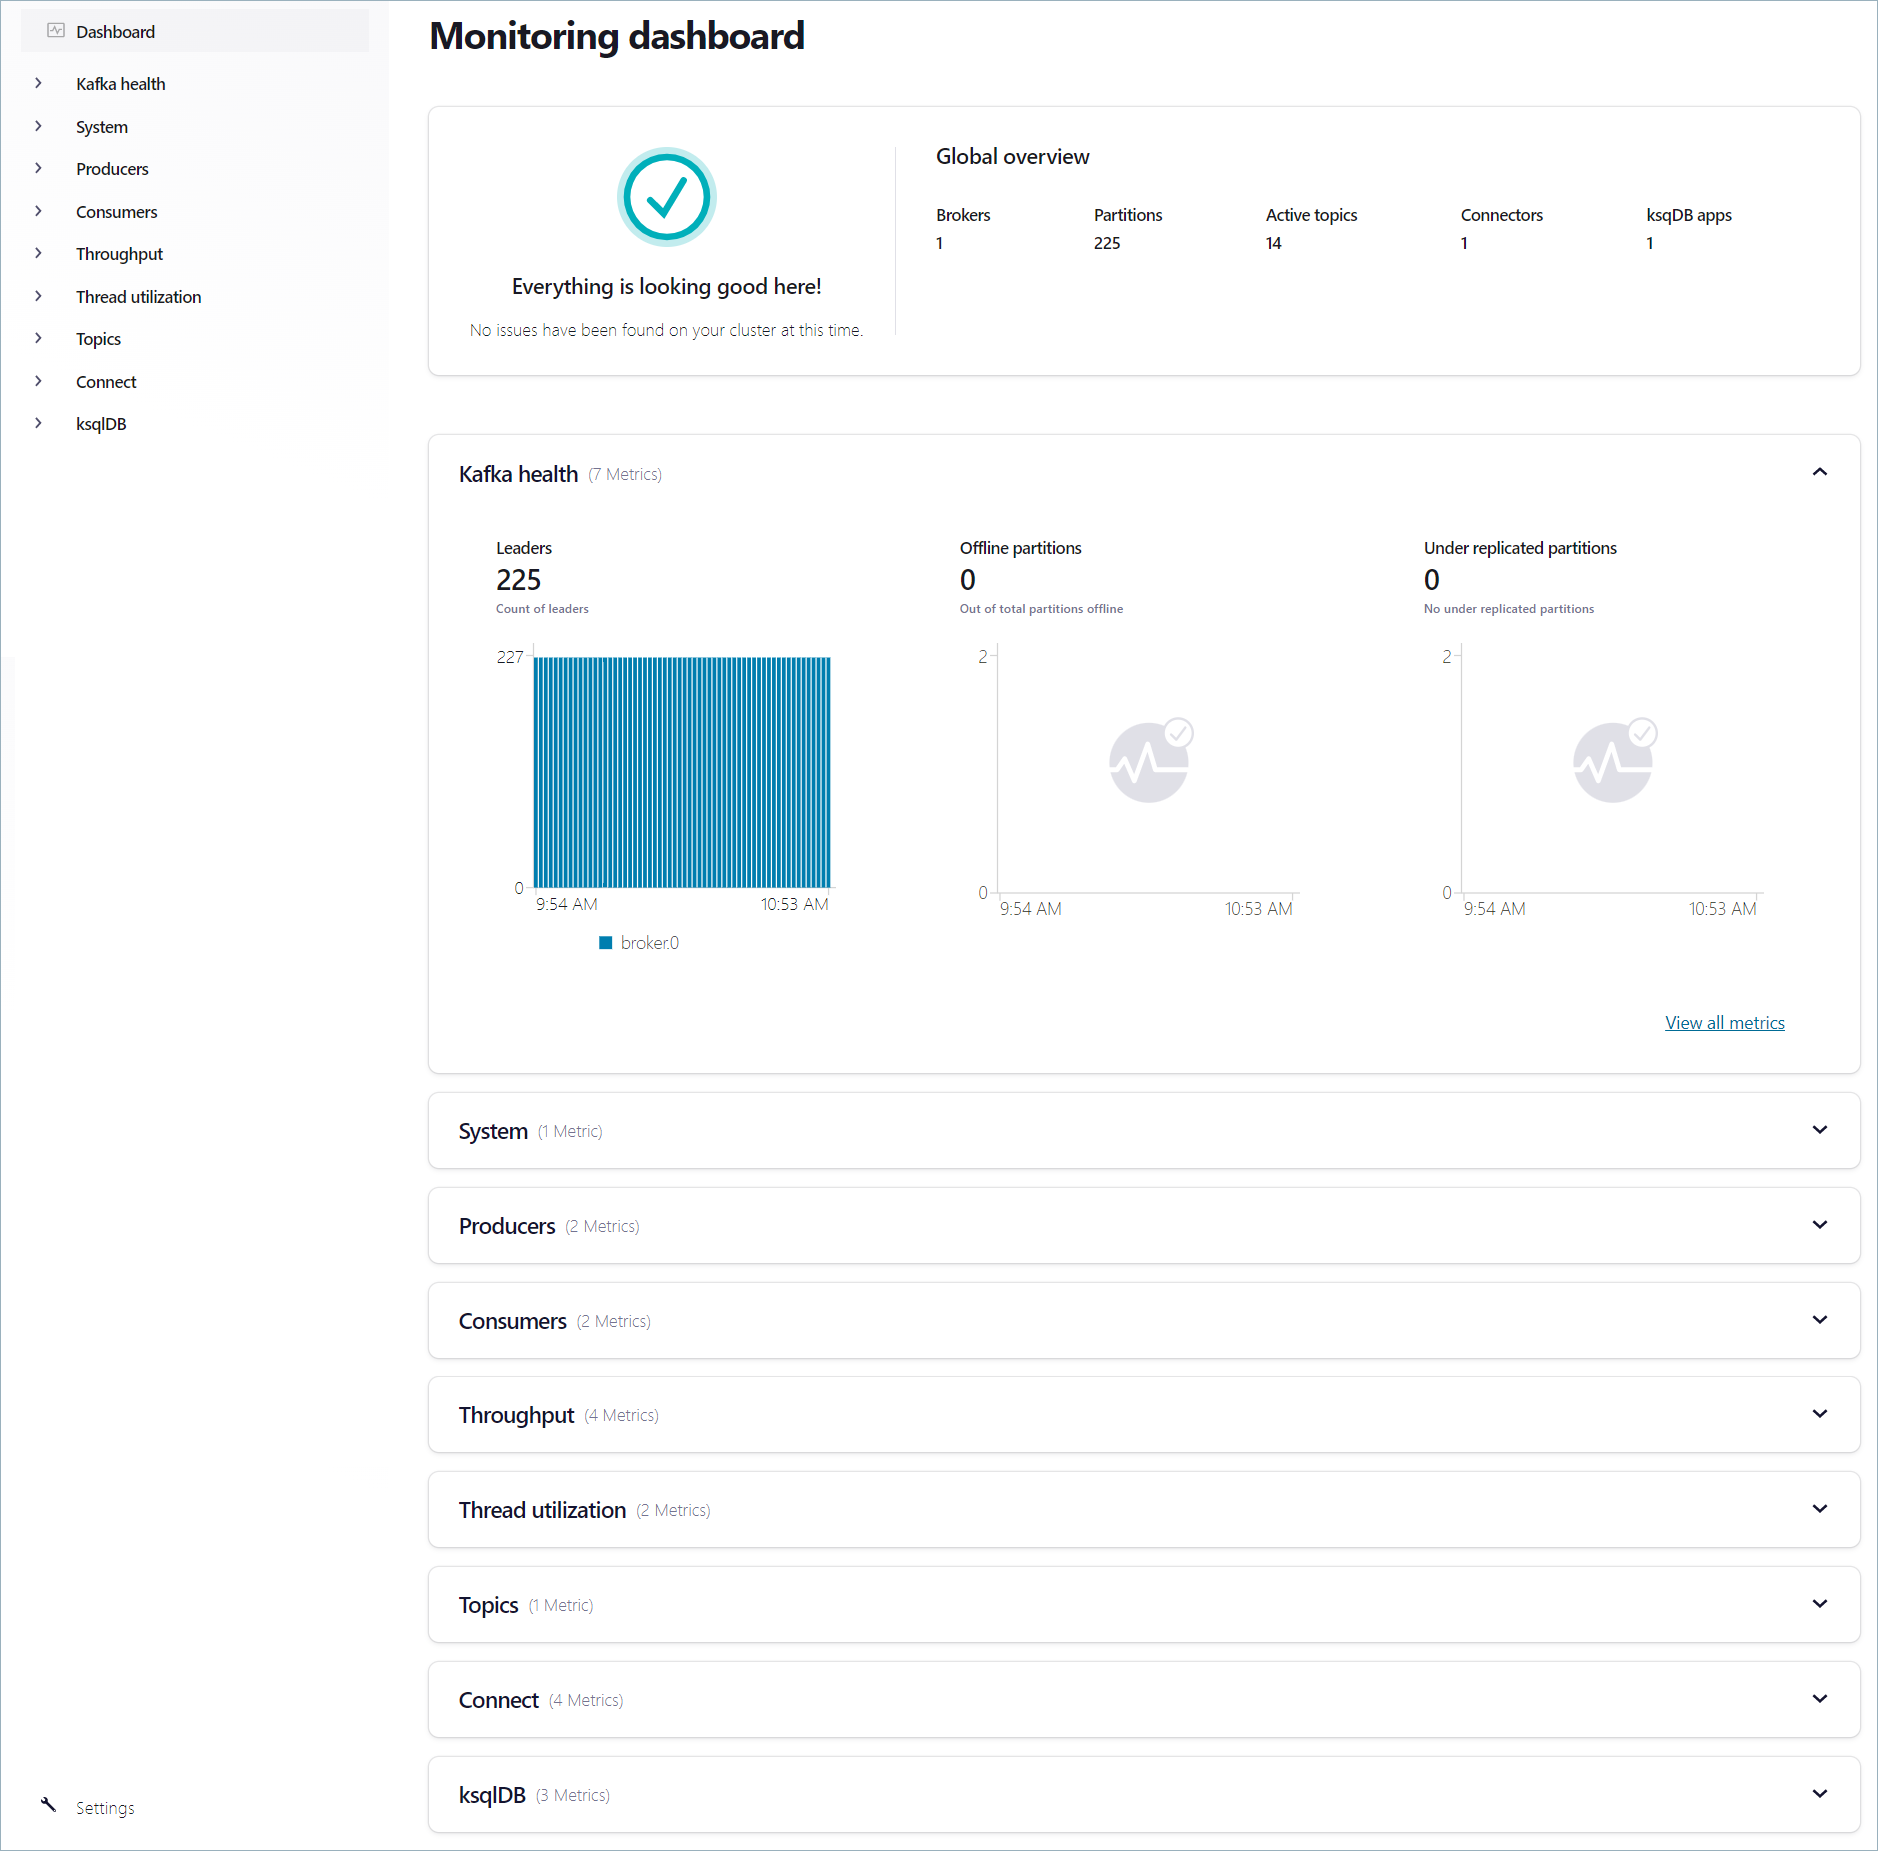
Dashboard features
Your Health+ metrics are organized into a convenient dashboard with the following health categories. Each category has an overview page that you can click into to see details.
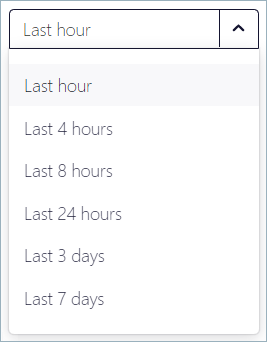
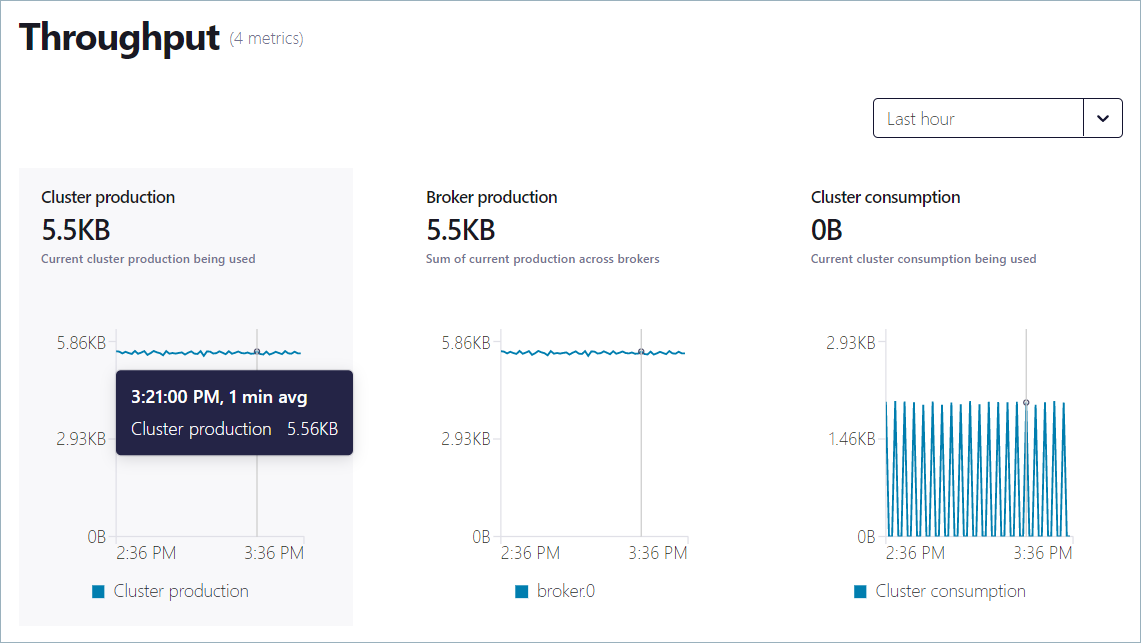
Each metric is displayed as a time-series graph showing the most recent data. Click the dropdown to set the time period you want to view, which can range from the last hour to the last 30 days.
Hover over a graph to see details about the metric at a specific time. If there are multiple graphs, cursor lines indicating the values of other metrics at the same sample time appear.
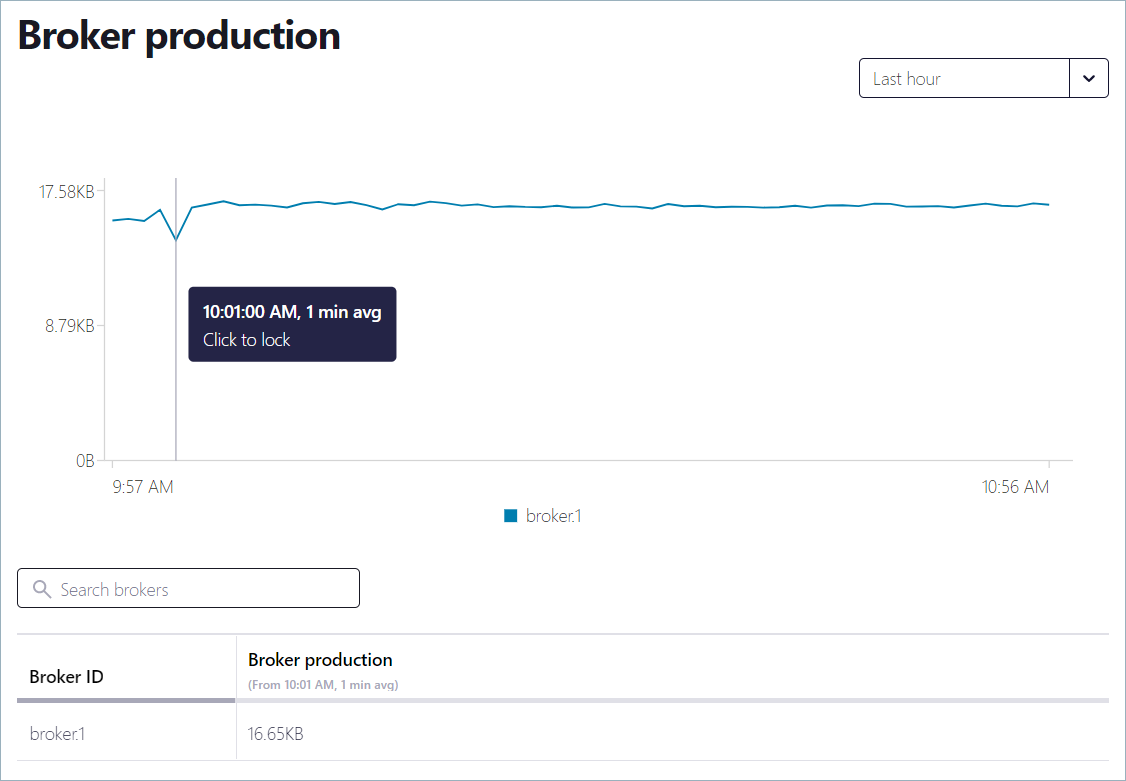
Click a graph to open the details view for the metric. Hover over the graph to show the cursor, and click to lock the cursor to a specific sample time. If you pick a different time window, the locked cursor remains visible at the selected sample time.
Dashboards and metrics
The following sections list the available dashboards and metrics that you can monitor.
Kafka cluster
Metrics for your Kafka cluster deployment.
Leaders: number of leaders on the current broker
Offline partitions: number of partitions that don’t have an active leader
Under replicated partitions: number of under-replicated partitions
Brokers: number of brokers in your cluster
Under min ISR partitions: number of partitions that have an in-sync replicas count less than
minIsrActive controller count: number of active controllers
Unclean leader elections: total number of unclean leader elections
System
Metrics for the system that’s hosting your Kafka cluster.
Volume utilization: percentage of disk usage across brokers
Broker disk usage: sum of disk usage across brokers, in GB
Producers
Metrics for producers on your Kafka Server.
Producer broker latency: maximum producer latency across brokers
Failed produce requests: topic failed produce rate
Consumers
Metrics for consumer groups on your Kafka Server.
Consumer broker latency: maximum consumer latency across brokers
Failed consume requests: topic failed fetch rate
Throughput
Number of bytes produced and consumed per cluster and per broker.
Cluster production: current cluster production being used
Broker production: sum of current production across brokers
Cluster consumption: current cluster consumption being used
Broker consumption: sum of current consumption across brokers
Thread utilization
Network processor pool usage: maximum network pool usage across brokers
Request IO usage: maximum request IO usage across brokers
Topics
Active topics: total active topics in your cluster
Topics with consumer lag total topics presenting consumer lag (only for brokers running Confluent Platform 7.3 or later)
Connect
Metrics about your Connect cluster.
Failed connectors: number of connectors that have failed
Degraded connectors: number of connectors that are running in a degraded state
Running connectors: number of running connectors
Dead letter produce requests: number of DLQ produce requests
ksqlDB
Metrics about your ksqlDB cluster.
Running queries: number of running persistent queries
Error queries: number of persistent queries in an error state
Error rate: number of messages that were consumed but not processed
Settings
Access settings for the Health+ cluster.
Cluster name
Cluster ID
Cluster type