
Monitor Confluent Platform with Health+
Monitor and manage your Confluent Platform environment with Confluent Health+. Ensure the health of your clusters and minimize business disruption with intelligent alerts, monitoring, and proactive support based on best practices created by the inventors Apache Kafka®.
With Confluent Health+, you can:
Identify and avoid issues before they occur with more than fifty intelligent alerts, tuned from years of experience managing more than five thousand Kafka clusters in Confluent Cloud.
Set up alerts to send rule-based notifications to endpoints like Slack, Microsoft Teams and email.
Easily integrate with existing monitoring tools, like Prometheus.
View all of your critical metrics in a single cloud-based dashboard.
Sign up for Confluent Health+
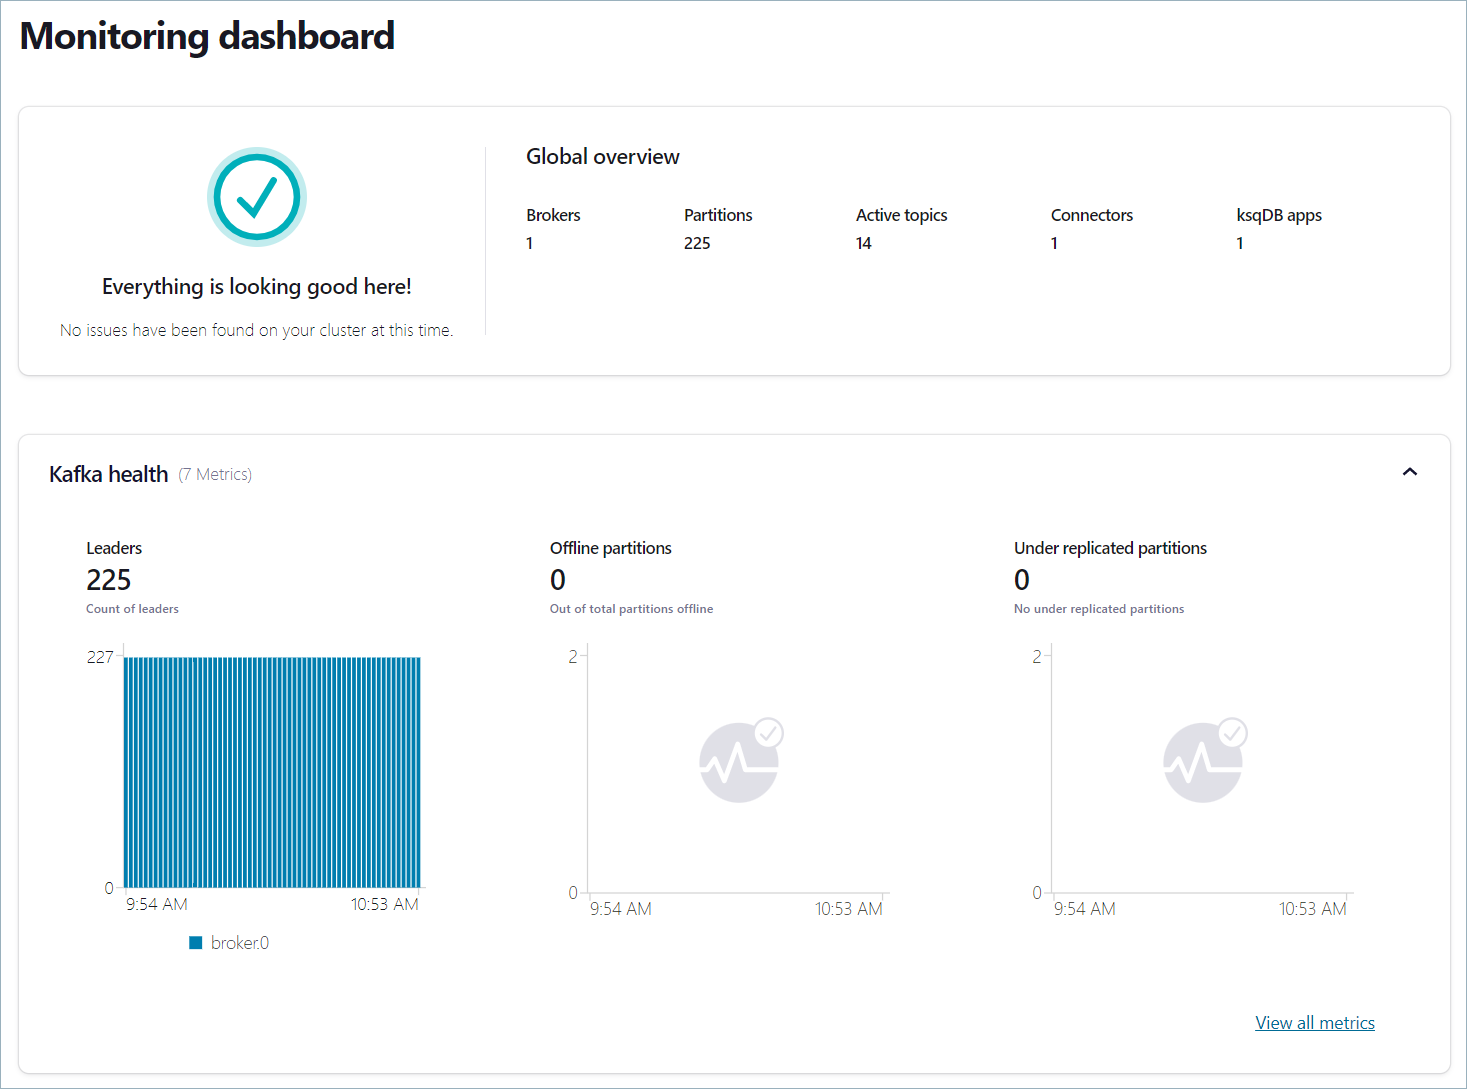
The Health+ Monitoring dashboard.
Health+ Features
- Intelligent alerts
Health+ sets up triggers on certain metrics that alert when thresholds are crossed and notify you of potential issues.
You can set up alerts for email, Slack, Microsoft Teams and other alerting platforms using our generic webhook.
For more information, see Health+ Intelligent Alerts for Confluent Platform.
- Monitoring dashboards
Use Health+ to monitor and visualize multiple metrics over historical time periods, to identify issues. Easily view all of your critical metrics in a single cloud-based dashboard and integrate into existing monitoring tools.
Metrics are displayed in Health+ Monitoring Dashboards and are available using the Metrics API.
- Confluent Telemetry Reporter
The Confluent Telemetry Reporter is a plugin that runs inside each Confluent Platform service to push metadata about the service to Confluent. Telemetry Reporter enables product features based on the metadata, like Health+.
Data is sent over HTTP using an encrypted connection. For more information, see Configure Telemetry Reporter for Confluent Platform.
Tip
For a list of metrics that are collected for Health+, see Telemetry Reporter Metrics Reference for Confluent Platform.
Health+ Pricing
Confluent Health+ is offered as a freemium model. You can use limited features of Health+ for free, and you can upgrade to the paid tier for full Health+ benefits. Contact us to learn more about upgrading to the paid tier of Health+.
- Free alerts
Active Controller Count
Connector is degraded
Connector is failed
ksqlDB queries in error
Offline Partitions
Unclean Leader Elections
Under Replicated Partitions
Under Min In-sync Replicas
- Premium alerts
Disk Usage
Fetch Request Latency
Fetch Follower Request Latency
Network Processor Pool Usage
Produce Request Latency
Request Handler Pool Usage
Pricing Tier | Intelligent Alerts | Monitoring Dashboards |
|---|---|---|
Free |
|
|
Paid |
|
|