Collect Metrics for Confluent Manager for Apache Flink
Apache Flink® provides a metrics system that enables you to expose metrics to external systems with metrics reporters. This topic describes how to configure metrics reporters for your Flink applications deployed with Confluent Manager for Apache Flink (CMF).
Metric reporter properties
You can configure metrics reporters with by specifying the name and port of the metrics reporter:
metrics.reporter.<name>.factory.class: The reporter factory class to use for the reporter named<name>.metrics.reporter.<name>.port:: (optional) the port on which the<name>metrics reporter listens for connections
CMF offers two ways of configuring metric reporters for your deployment.
Option 1. Per application
You can configure metrics reporter by application. The following example code shows how to do this.
---
apiVersion: cmf.confluent.io/v1
kind: FlinkApplication
metadata:
name: basic-example
spec:
image: confluentinc/cp-flink:1.19.1-cp1
flinkVersion: v1_19
flinkConfiguration:
    taskmanager.numberOfTaskSlots: '1'
    # Use prometheus metric report
    metrics.reporter.prom.factory.class: org.apache.flink.metrics.prometheus.PrometheusReporterFactory
    metrics.reporter.prom.port: 9249-9250
serviceAccount: flink
# Custom logging configuration this application
jobManager:
    resource:
    memory: 1048m
    cpu: 1
taskManager:
    resource:
    memory: 1048m
    cpu: 1
job:
    jarURI: local:///opt/flink/examples/streaming/StateMachineExample.jar
    state: running
    parallelism: 3
    upgradeMode: stateless
Option 2: The same metrics reporter for every application in your environment
You can also configure metrics reporters at the environment level. The following example code shows how to apply the same metrics reporter configuration to every application in your environment.
---
name: default
kubernetesNamespace: staging-shared
flinkApplicationDefaults:
metadata:
    annotations:
    fmc.platform.confluent.io/intra-cluster-ssl: 'false'
spec:
    flinkConfiguration:
    # Use prometheus metric report for all applications in this environment
    metrics.reporter.prom.factory.class: org.apache.flink.metrics.prometheus.PrometheusReporterFactory
    metrics.reporter.prom.port: 9249-9250
    taskmanager.numberOfTaskSlots: '2'
    rest.profiling.enabled: 'true'
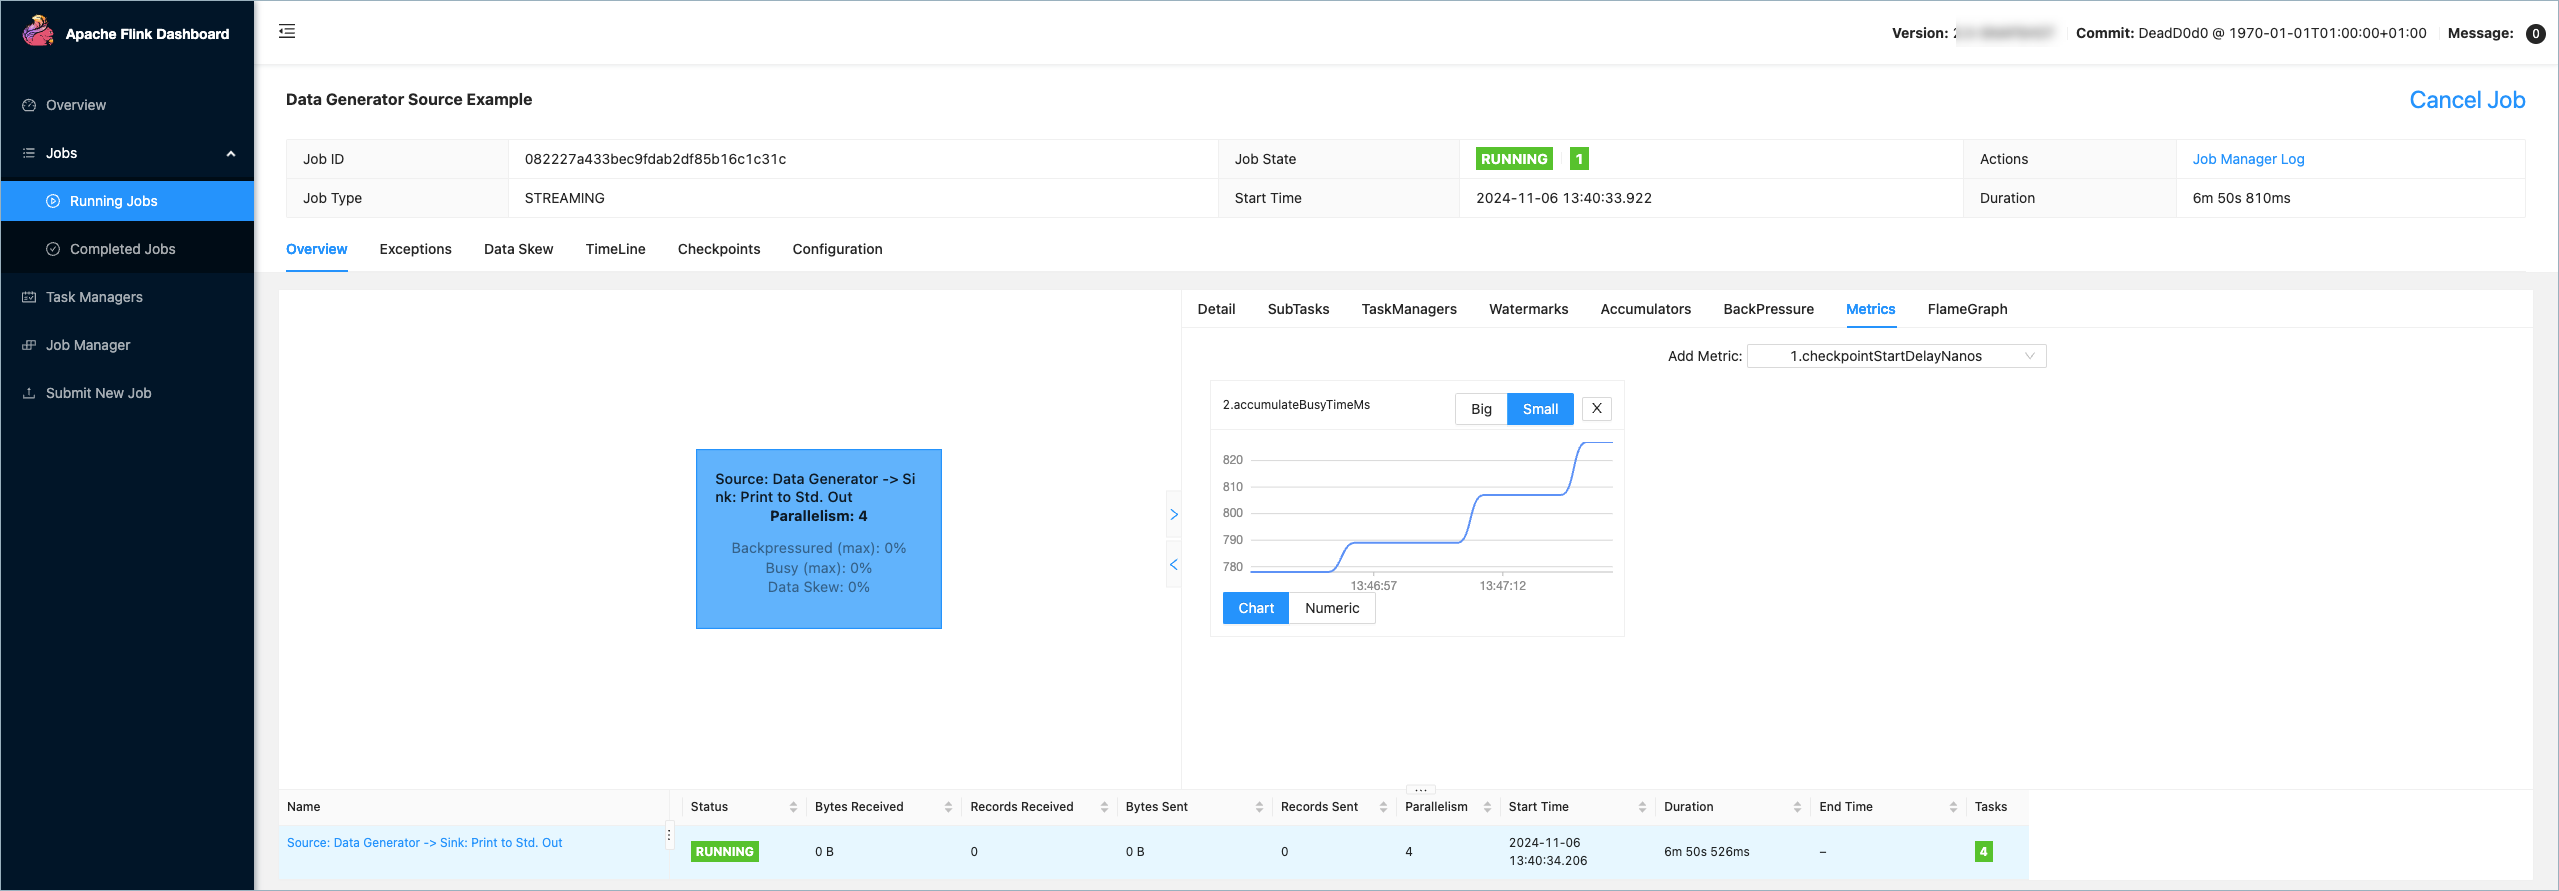
Metrics in the Flink WebUI
Accessing the Flink WebUI enables you to observe your application’s live metrics by task. For more information, see Access the Flink Web UI for the application.
The following image shows an example of viewing metrics in the Flink WebUI.