
Configure JMX for Monitoring
This topic describes how to configure Java Management Extensions (JMX) to monitor Kafka and Confluent Platform components. JMX is the standard method for exposing internal metrics from Java applications.
JMX environment variables
You can use the following JVM environment variables to configure JMX monitoring when you start Kafka or use Java system properties to enable remote JMX programmatically.
JMX_PORT: The port that JMX listens on for incoming connections.JMX_HOSTNAME: The hostname associated with locally created remote objects.KAFKA_JMX_OPTS: JMX options. Use this variable to override default JMX options, such as authentication.The default options are set as follows:
-Djava.rmi.server.hostname=127.0.0.1 -Dcom.sun.management.jmxremote=true -Dcom.sun.management.jmxremote.authenticate=false -Dcom.sun.management.jmxremote.ssl=falseserver.hostname: Specifies the host a JMX client connects to. The default islocalhost(127.0.0.1).jmxremote=true: Enables the JMX remote agent and enables the connector to listen through a specific port.jmxremote.authenticate=false: Indicates that authentication is off by default.jmxremote.ssl=false: Indicates that TLS/SSL is off by default.
For example, to start Kafka and specify a JMX port, use the following command:
JMX_PORT=2020 ./bin/kafka-server-start ./etc/kafka/server.properties
For details on JMX configuration, see Monitoring and Management using JMX technology.
View MBeans with JConsole
To see JMX monitoring in action, you can use JConsole, a utility provided with Java.
Start JConsole using the
jconsolecommand.Connect to the Kafka process:
If Kafka is running locally, select it from Local Process.
If Kafka is running remotely (such as in Docker), select Remote Process, enter the hostname and port, and click Connect.
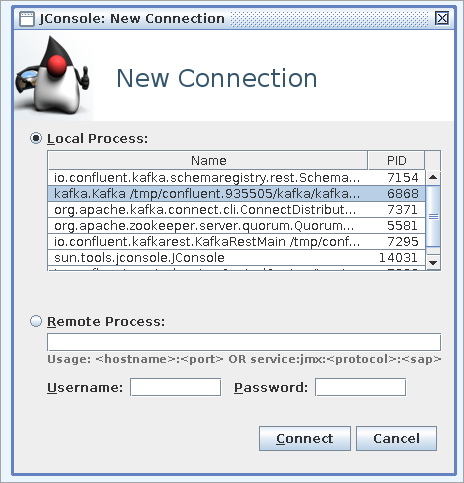
Enter a valid username and password, or accept an Insecure connection if authentication is not configured.
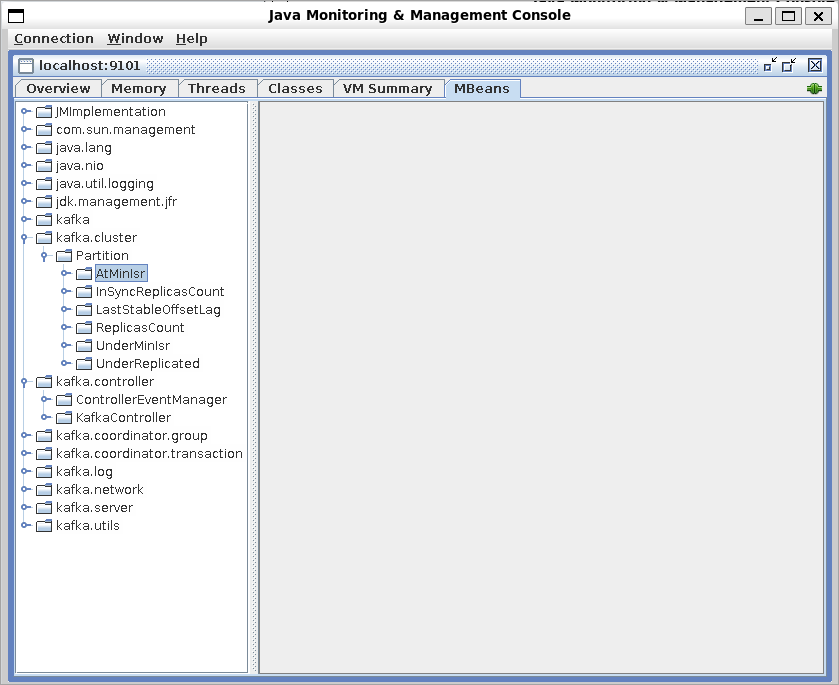
Select the MBeans tab and expand the folders to see JMX events and attributes.
Note
You will only see MBeans for features enabled on your nodes. If you don’t see an expected MBean for a feature or component, verify the feature is enabled and you’re viewing the correct process.
You can also view JMX metrics with console tools such as Jmxterm or export JMX metrics to other monitoring tools such as Prometheus. For a demo on how to use popular monitoring tools with Confluent products, see JMX Monitoring Stacks on GitHub.
Configure security
By default, password authentication and TLS/SSL are disabled for JMX in Kafka. However, in a production environment, enable authentication and TLS/SSL to prevent unauthorized users from accessing your brokers.
To enable security for JMX, override the default JMX settings to enable authentication and SSL.
For details on how to secure JMX, refer to the TLS/SSL and authentication sections in Monitoring and Management Using JMX Technology.
Configure other Confluent Platform components
Use the following environment variables to override the default JMX options such as authentication settings for other Confluent Platform components.
Component | Environment variable |
|---|---|
Confluent Control Center | CONTROL_CENTER_JMX_OPTS |
REST Proxy | KAFKAREST_JMX_OPTS |
ksqlDB | KSQL_JMX_OPTS |
Rebalancer | REBALANCER_JMX_OPTS |
Schema Registry | SCHEMA_REGISTRY_JMX_OPTS |