Important
You are viewing documentation for an older version of Confluent Platform. For the latest, click here.
Kafka Event Streaming Application
This demo shows users how to deploy a Kafka event streaming application using KSQL for stream processing. All the components in the Confluent platform have security enabled end-to-end.
Overview
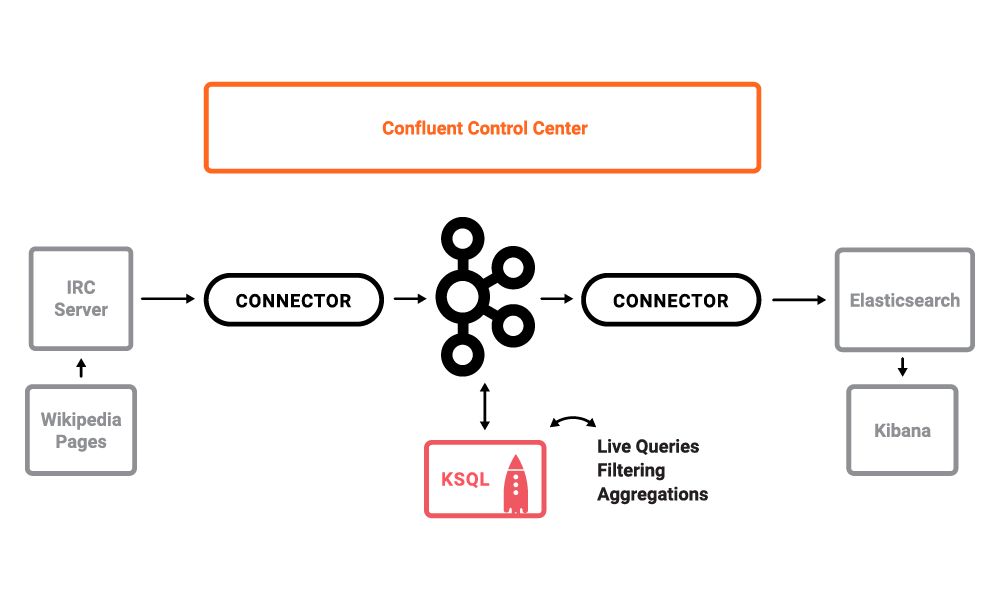
The use case is a Kafka event streaming application for real-time edits to real Wikipedia
pages. Wikimedia Foundation has IRC channels that publish edits
happening to real wiki pages (e.g. #en.wikipedia, #en.wiktionary) in
real time. Using Kafka
Connect, a
Kafka source connector
kafka-connect-irc
streams raw messages from these IRC channels, and a custom Kafka Connect
transform
kafka-connect-transform-wikiedit
transforms these messages and then the messages are written to a Kafka
cluster. This demo uses KSQL
for data enrichment, or you can optionally develop and run your own
Kafka Streams
application. Then a Kafka sink connector
kafka-connect-elasticsearch
streams the data out of Kafka, applying another custom Kafka Connect
transform called NullFilter. The data is materialized into
Elasticsearch for
analysis by Kibana.
Use Confluent Control Center for management and monitoring.
Note
This is a Docker environment and has all services running on one host. Do not use this demo in production. It is meant exclusively to easily demo the Confluent Platform. In production, Confluent Control Center should be deployed with a valid license and with its own dedicated metrics cluster, separate from the cluster with production traffic. Using a dedicated metrics cluster is more resilient because it continues to provide system health monitoring even if the production traffic cluster experiences issues.
If you are completely new to Confluent Control Center, watch a brief video overview Monitoring Kafka Like a Pro video.
Run demo
Demo validated with:
- Docker version 17.06.1-ce
- Docker Compose version 1.14.0 with Docker Compose file format 2.1
- Java version 1.8.0_92
- MacOS 10.12
- git
- jq
Note
If you prefer a non-Docker version and have Elasticsearch and Kibana running on your local machine, please follow these instructions.
Clone the cp-demo GitHub repository:
git clone https://github.com/confluentinc/cp-demo
In Docker’s advanced settings, increase the memory dedicated to Docker to at least 8GB (default is 2GB).
From the
cp-demodirectory, start the entire demo by running a single command that generates the keys and certificates, brings up the Docker containers, and configures and validates the environment. This will take less than 5 minutes to complete../scripts/start.sh
Use Google Chrome to view the Confluent Control Center GUI at http://localhost:9021. Click on the top right button that shows the current date, and change
Last 4 hourstoLast 30 minutes.View the data in the Kibana dashboard at http://localhost:5601/app/kibana#/dashboard/Wikipedia
Playbook
Confluent Control Center Tour
Follow along with the Demo 2: Tour video.
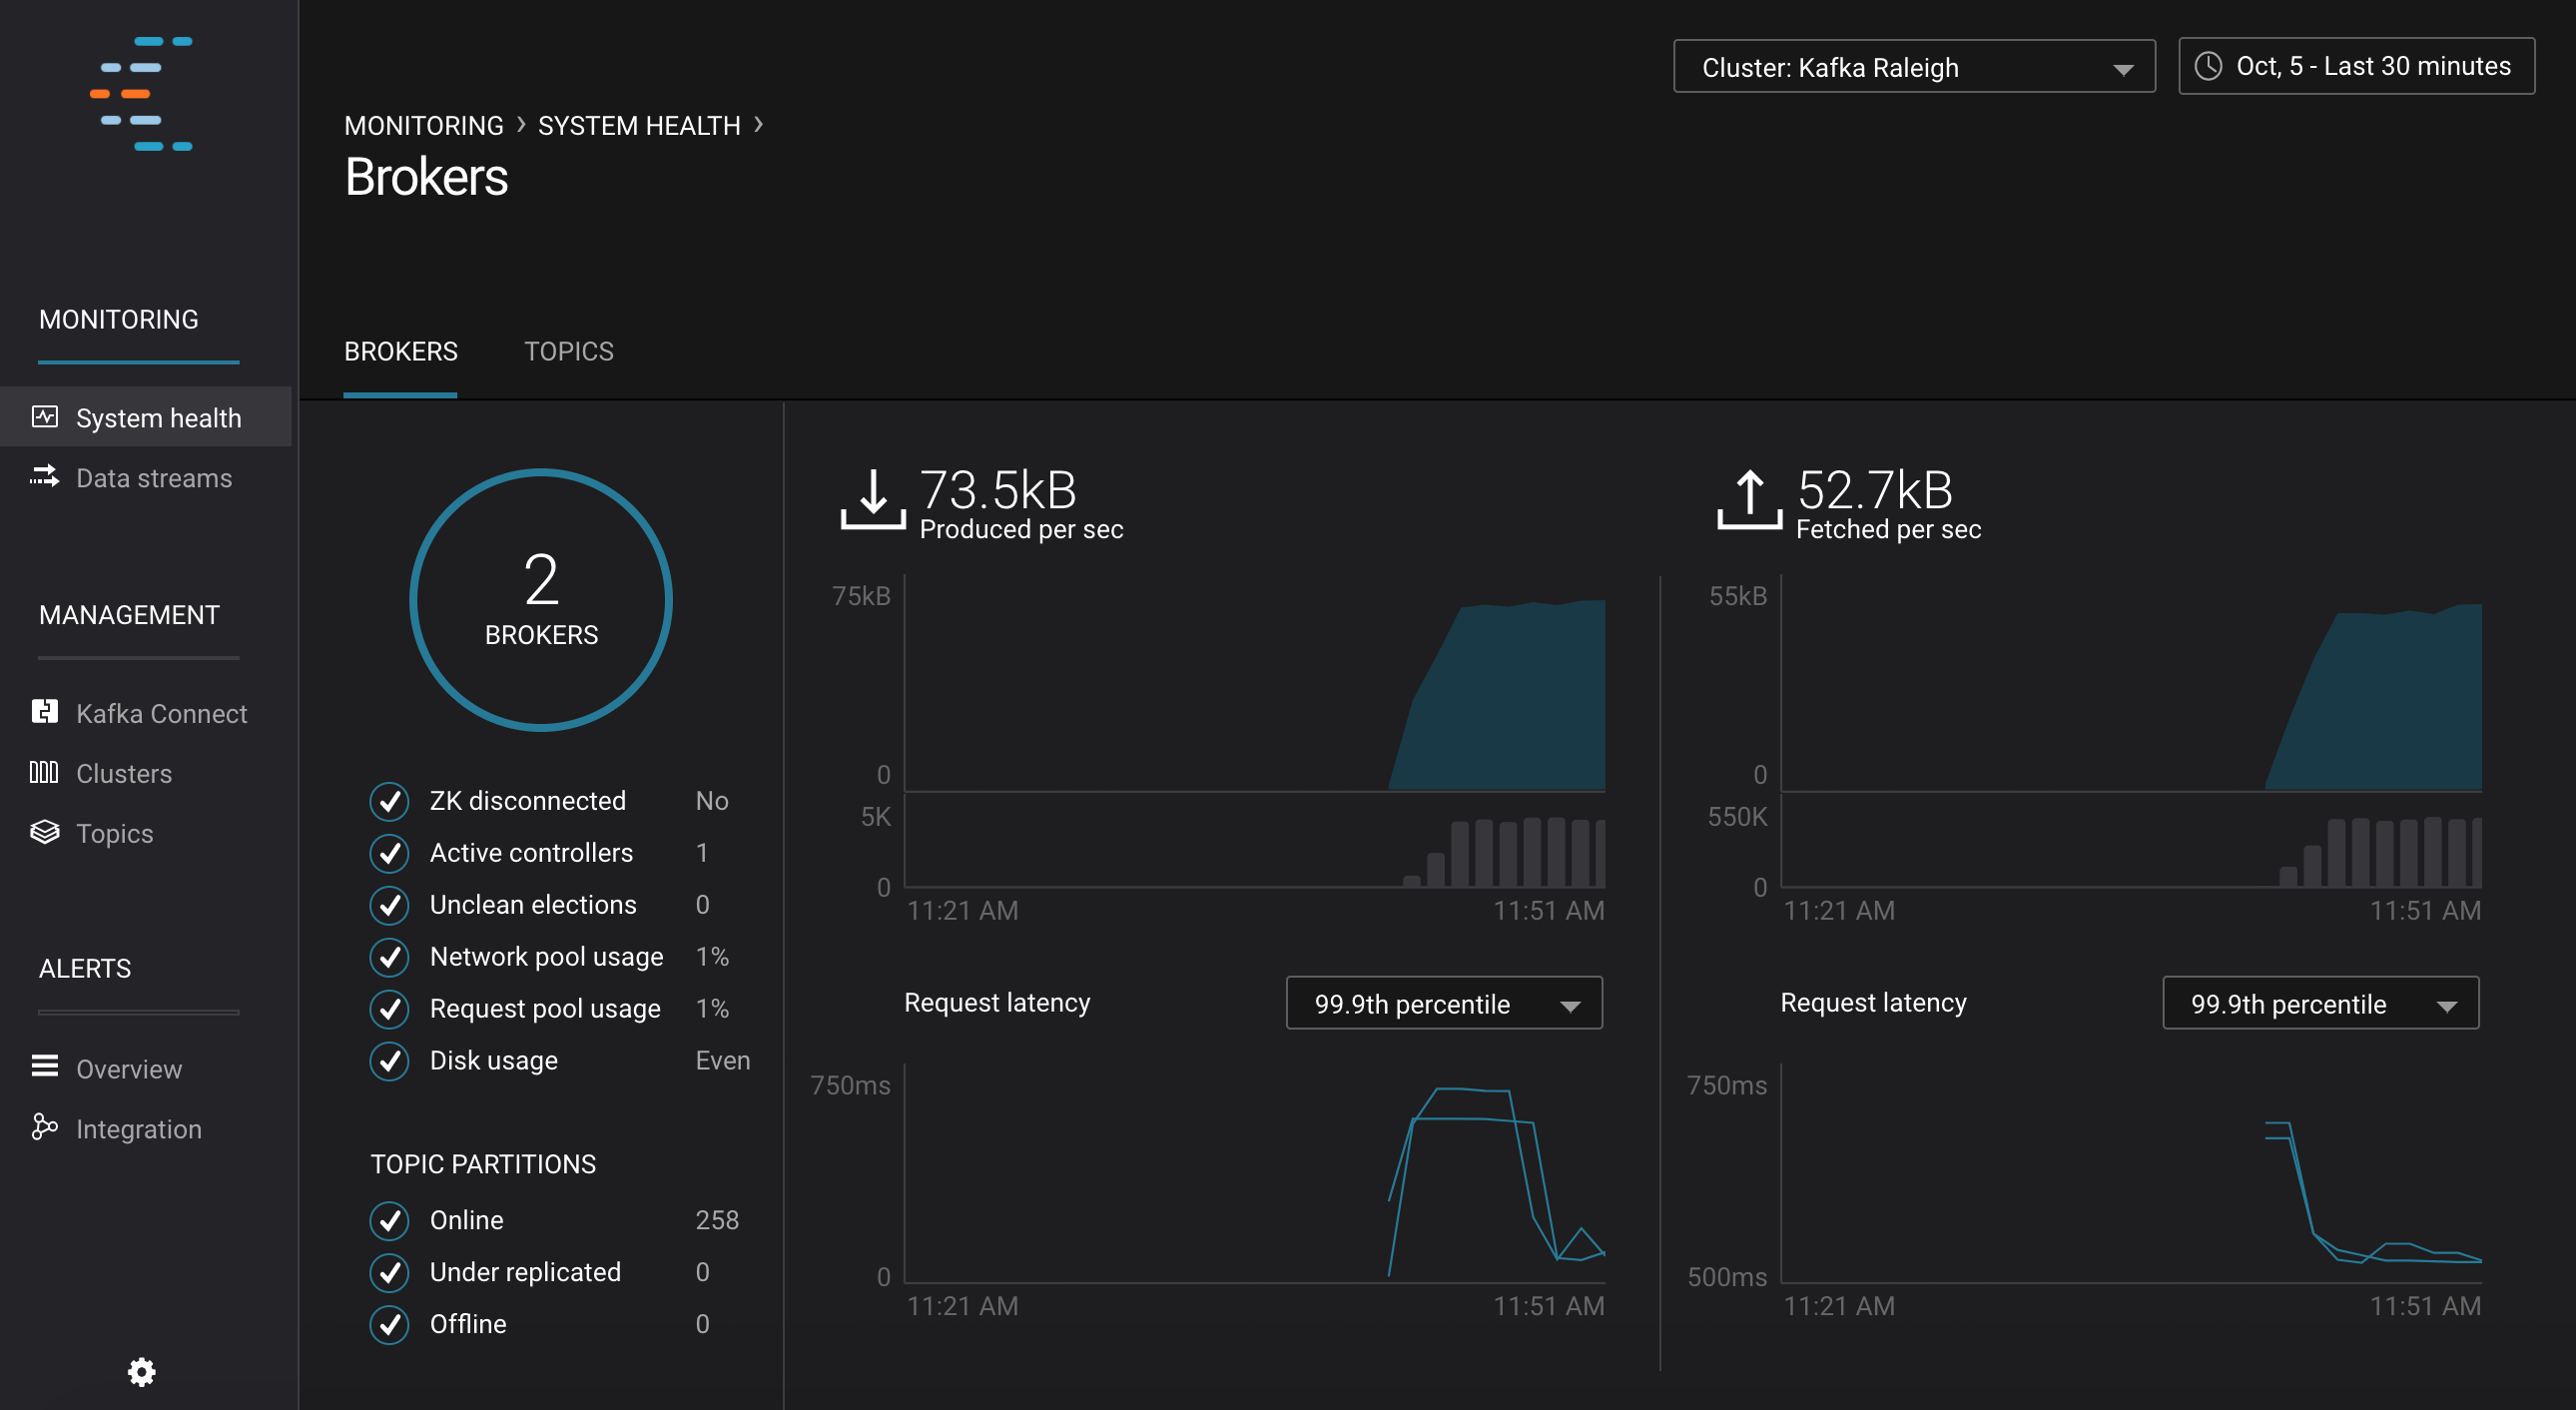
MONITORING –> System Health: Confluent Control Center landing page shows the overall system health of a given Kafka cluster. For capacity planning activities, view cluster utilization:
- CPU: look at network and thread pool usage, produce and fetch request latencies
- Network utilization: look at throughput per broker or per cluster
- Disk utilization: look at disk space used by all log segments, per broker
MANAGEMENT –> Kafka Connect: Confluent Control Center uses the Kafka Connect API to manage Kafka connectors.
Kafka Connect Sources tab shows the connectors
wikipedia-ircandreplicate-topic. ClickEditto see the details of the connector configuration and custom transforms.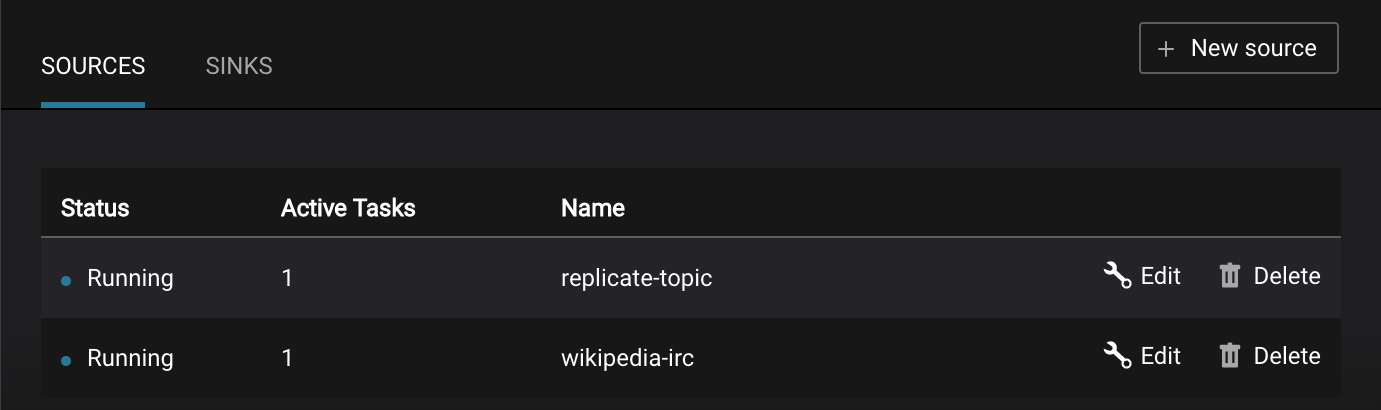
Kafka Connect Sinks tab shows the connector
elasticsearch-ksql. ClickEditto see the details of the connector configuration and custom transforms.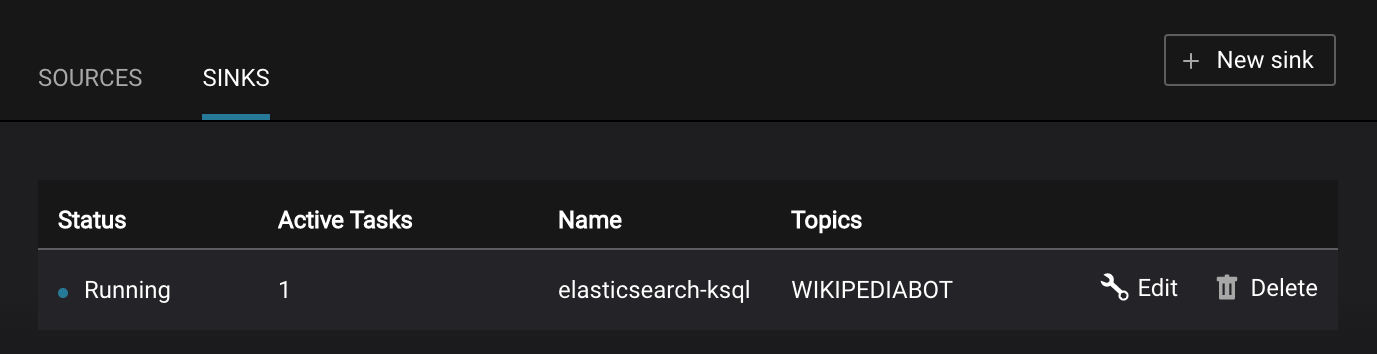
MONITORING –> Data Streams –> Message Delivery: hover over any chart to see number of messages and average latency within a minute time interval.
The Kafka Connect sink connectors have corresponding consumer groups
connect-elasticsearch-ksqlandconnect-replicator. These consumer groups will be in the consumer group statistics in the stream monitoring charts.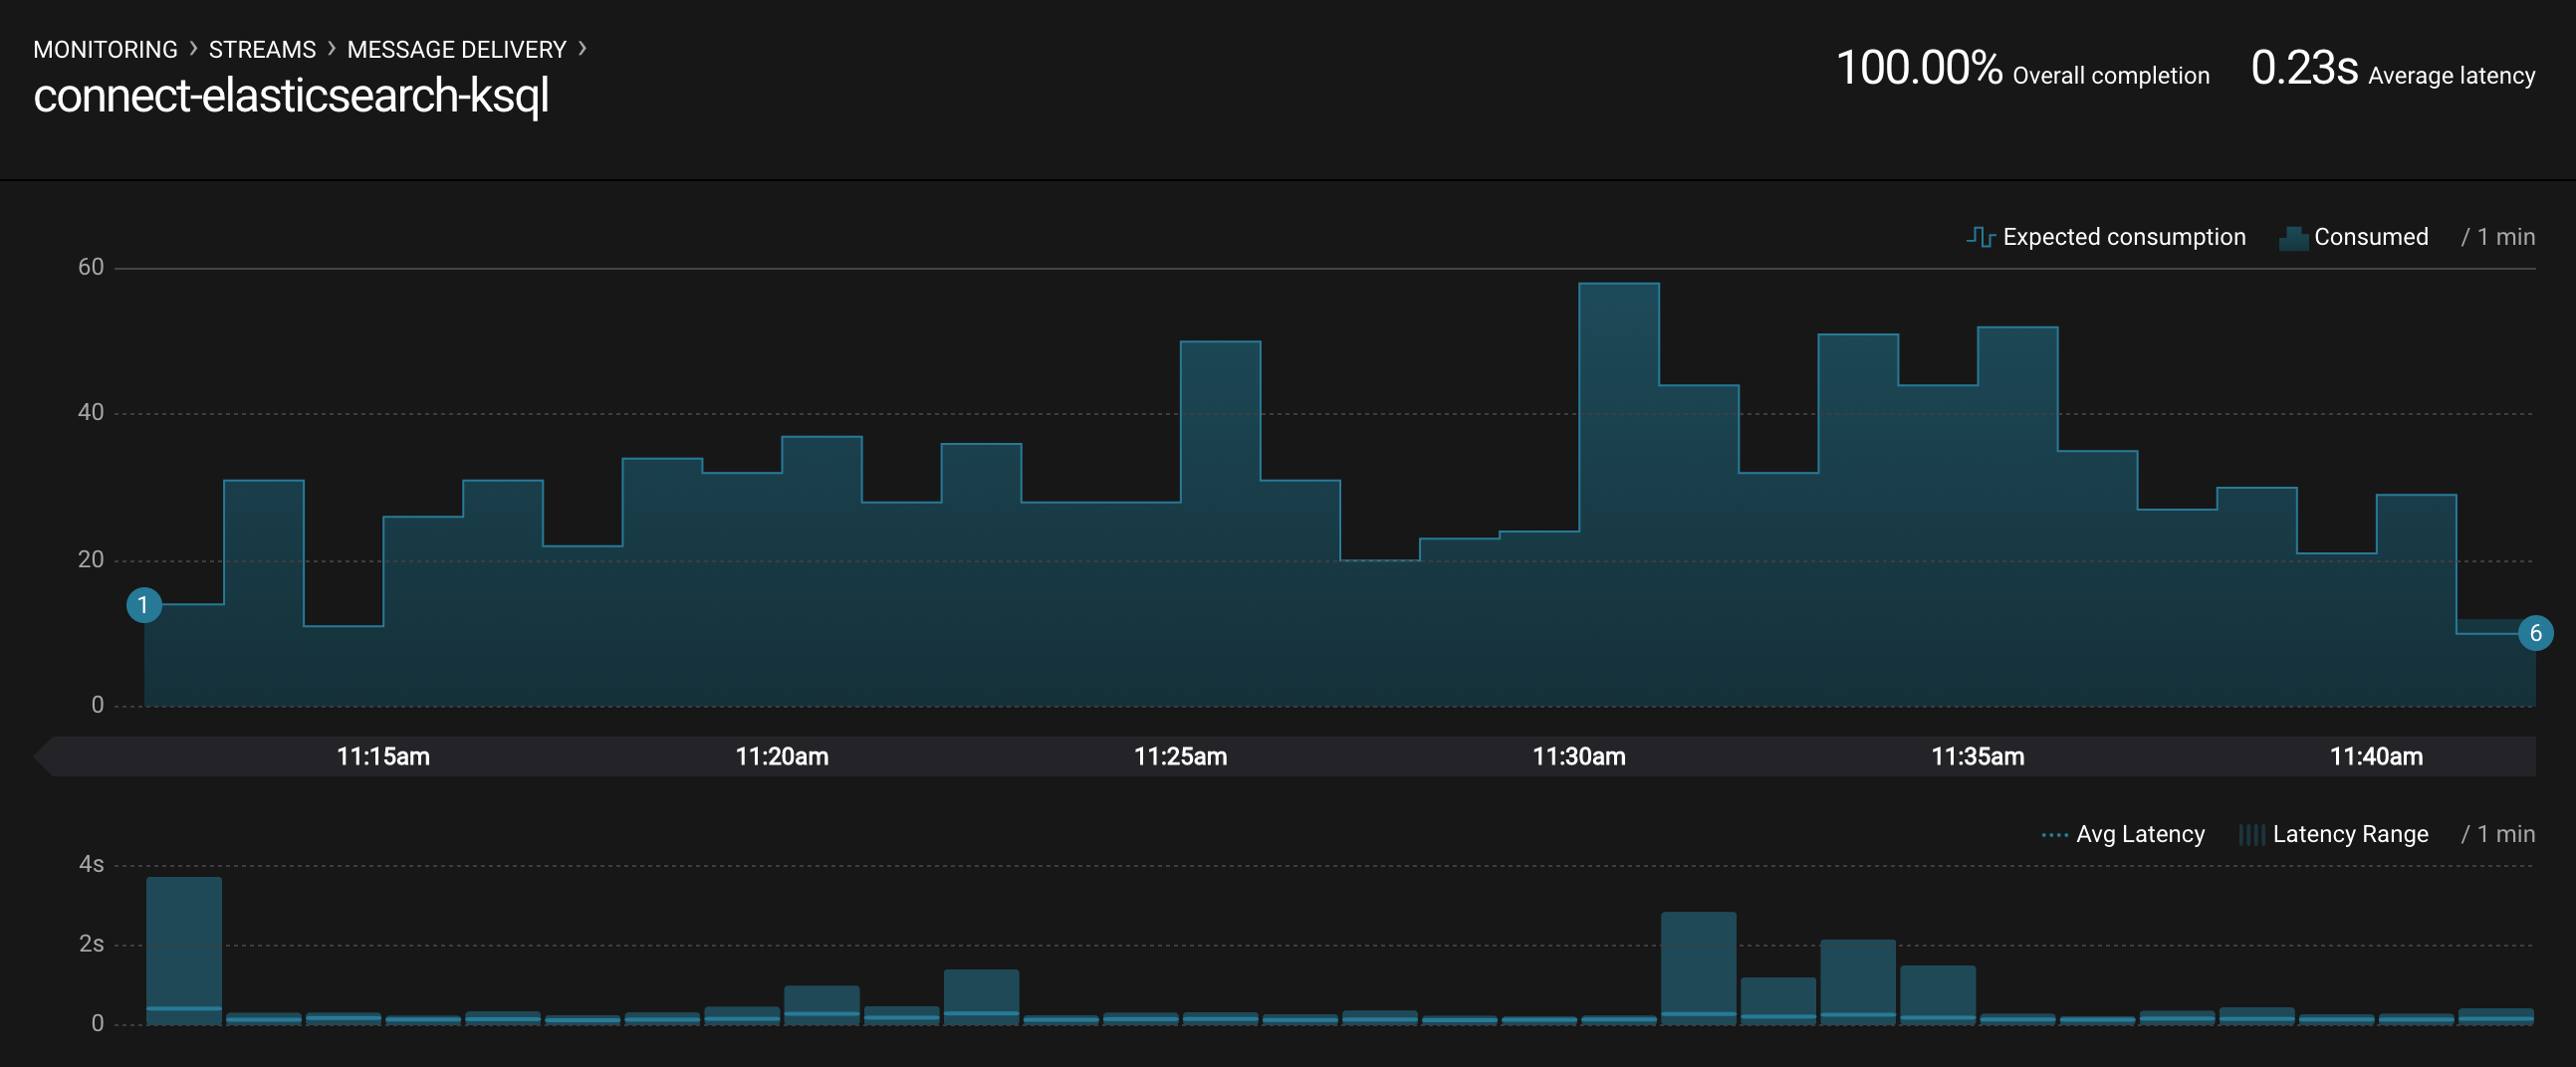
MONITORING –> System Health: to identify bottlenecks, you can see a breakdown of produce and fetch latencies through the entire request lifecycle. Click on the line graph in the
Request latencychart. The request latency values can be shown at the median, 95th, 99th, or 99.9th percentile. Depending on where the bottlenecks are, you can tune your brokers and clients appropriately.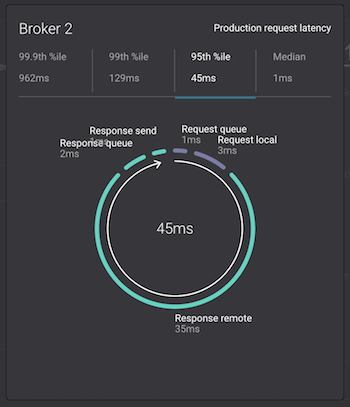
Topic Management
Confluent Control Center has a useful interface to manage topics in a Kafka cluster.
MANAGEMENT –> Topics: Scroll down to and click on the topic wikipedia.parsed.

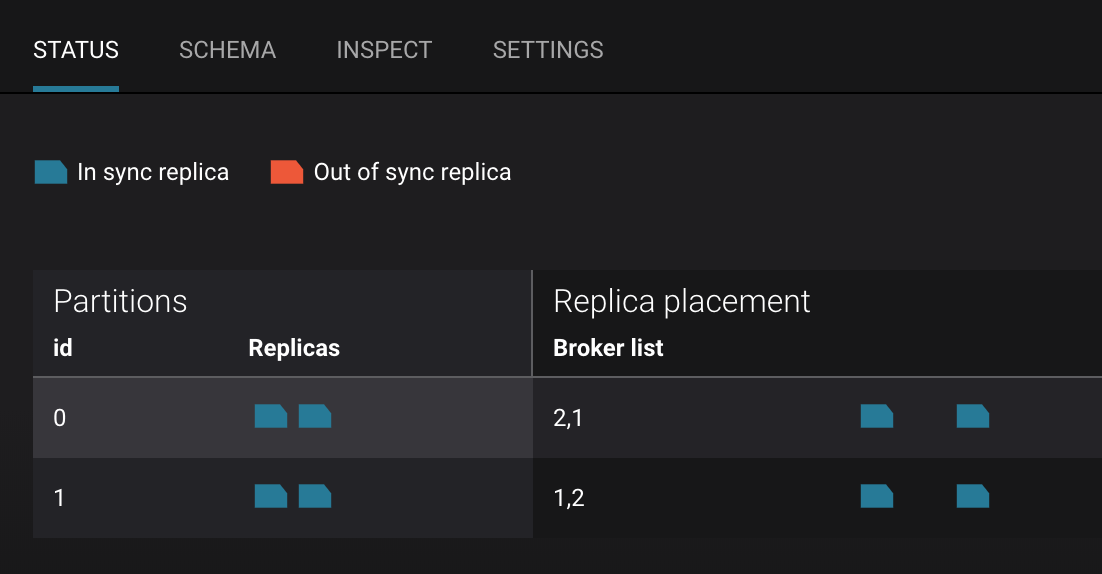
MANAGEMENT –> Topics -> Status: View which brokers are leaders for which partitions and where all partitions reside.
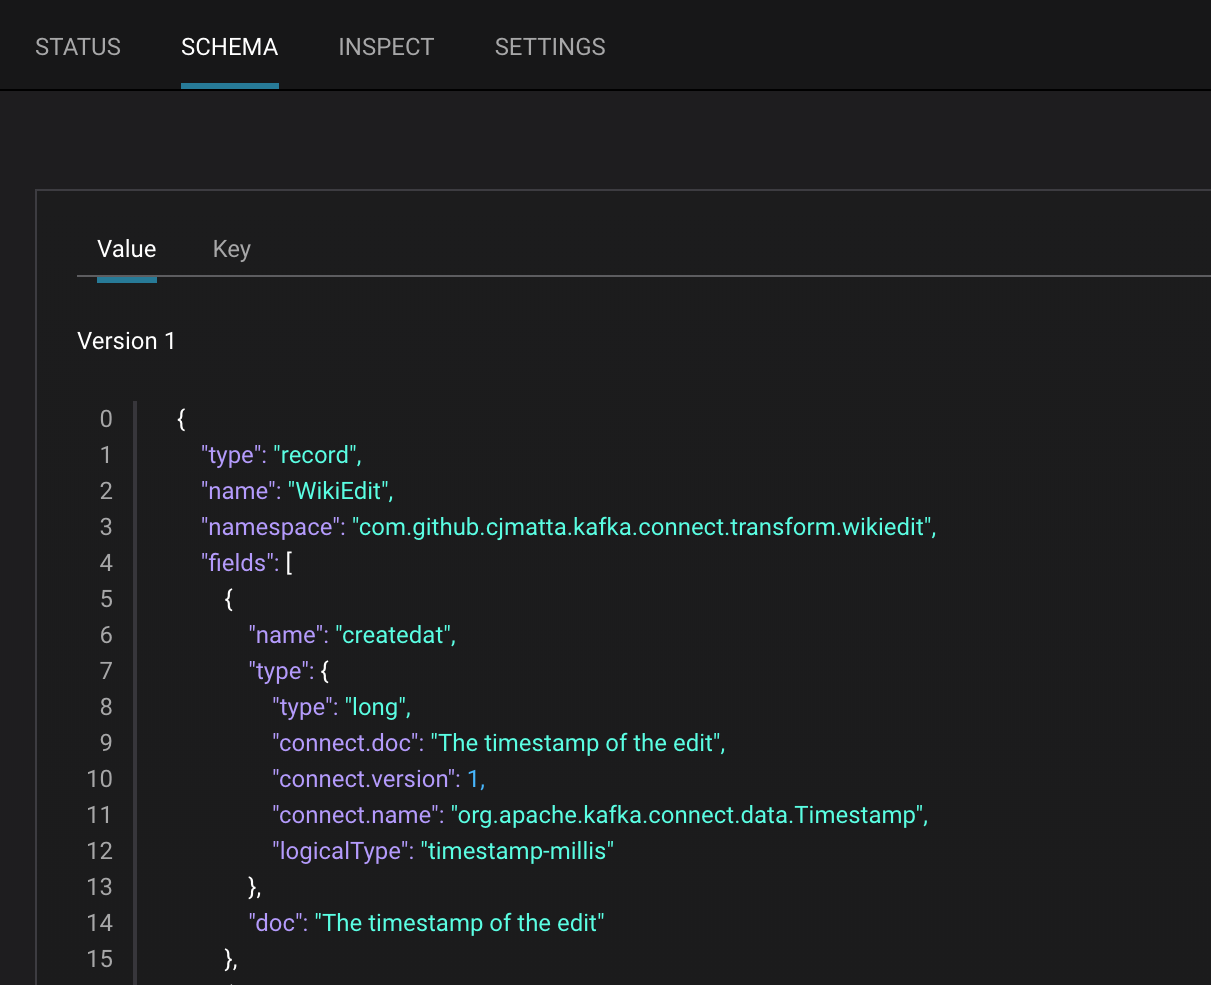
MANAGEMENT –> Topics -> Schema: View the schema for this topic. For wikipedia.parsed, the topic value is using a Schema registered with Schema Registry (the topic key is just a string).
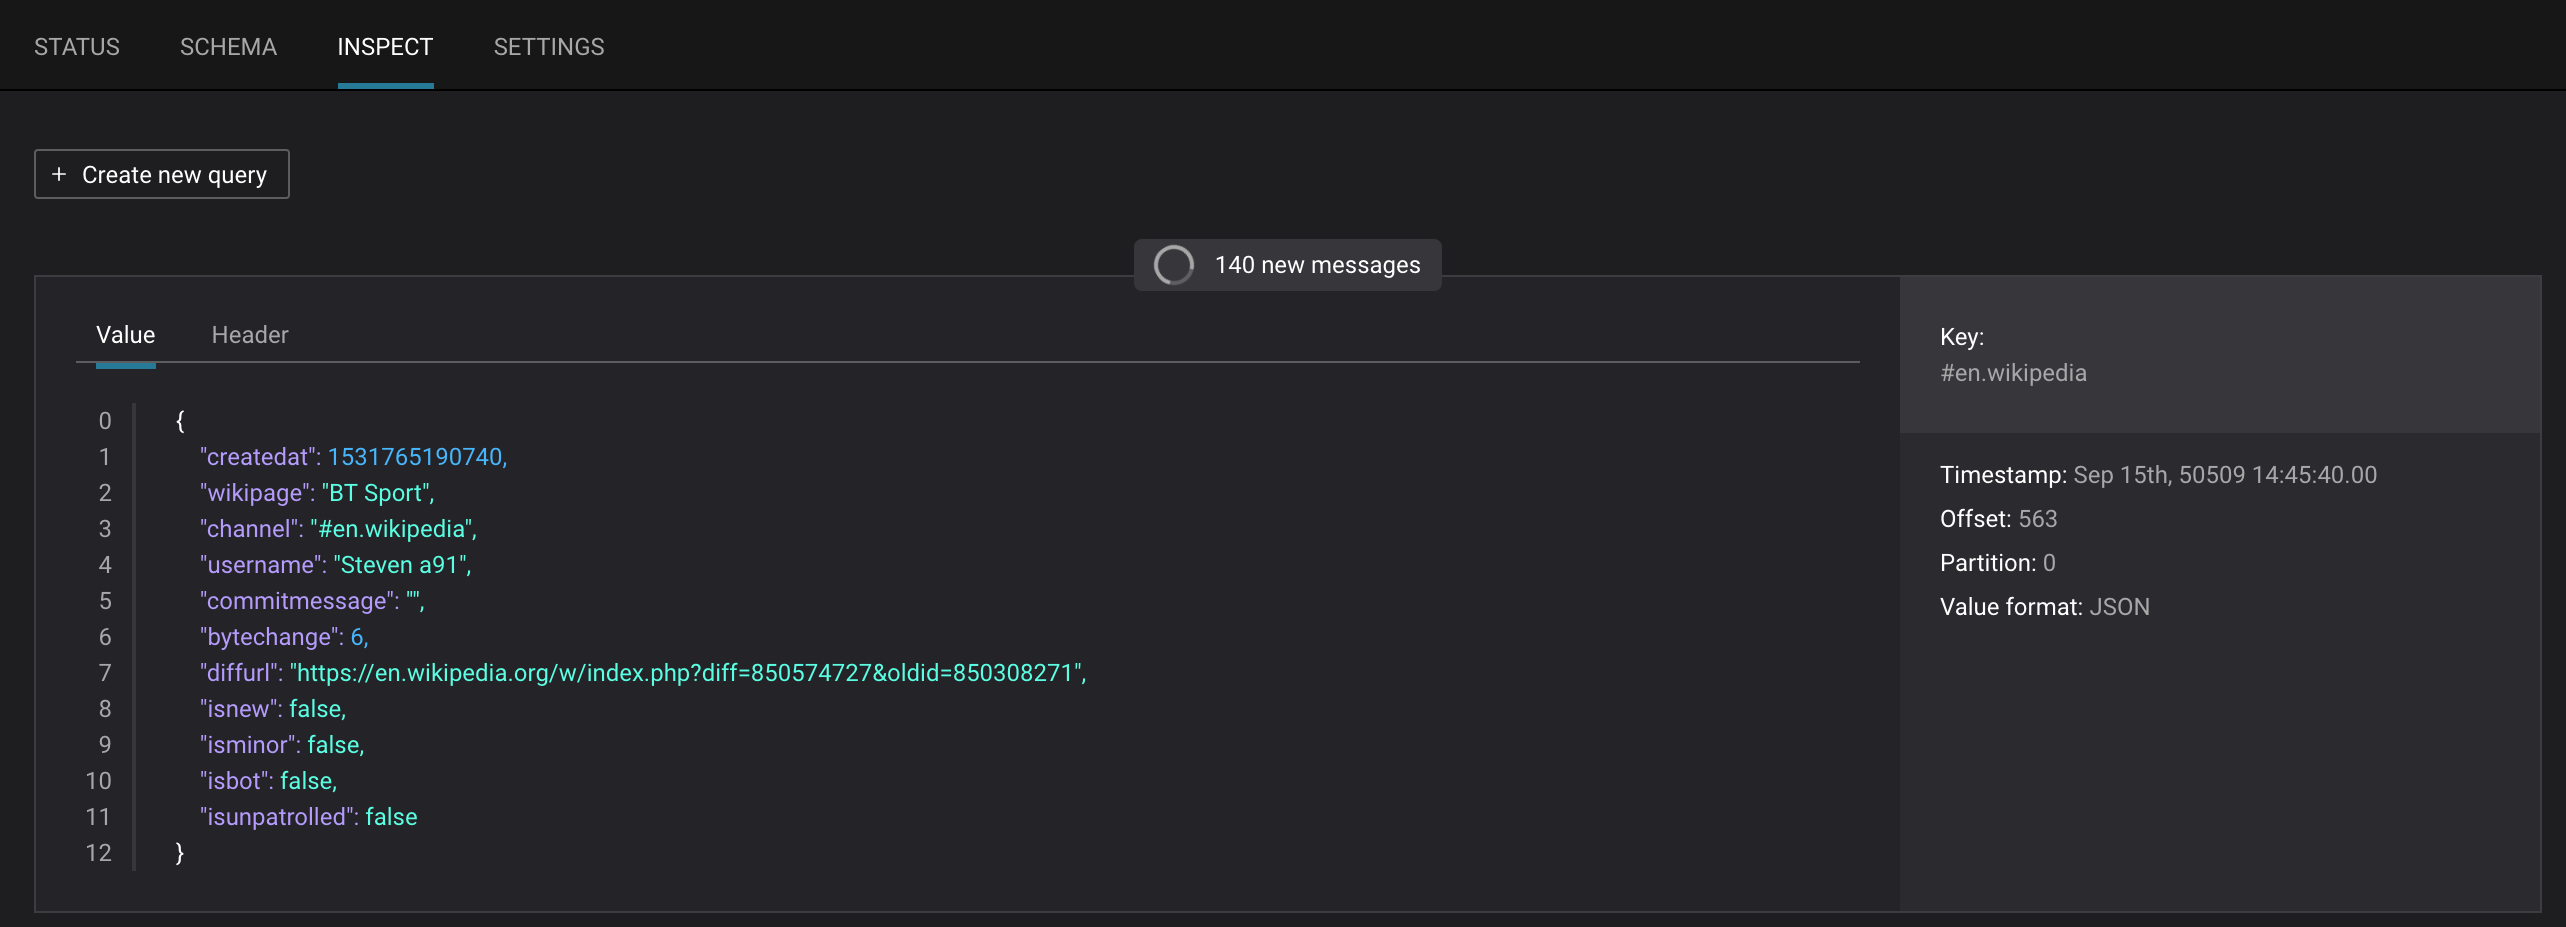
MANAGEMENT –> Topics -> Inspect: View messages for this topic, in real-time.
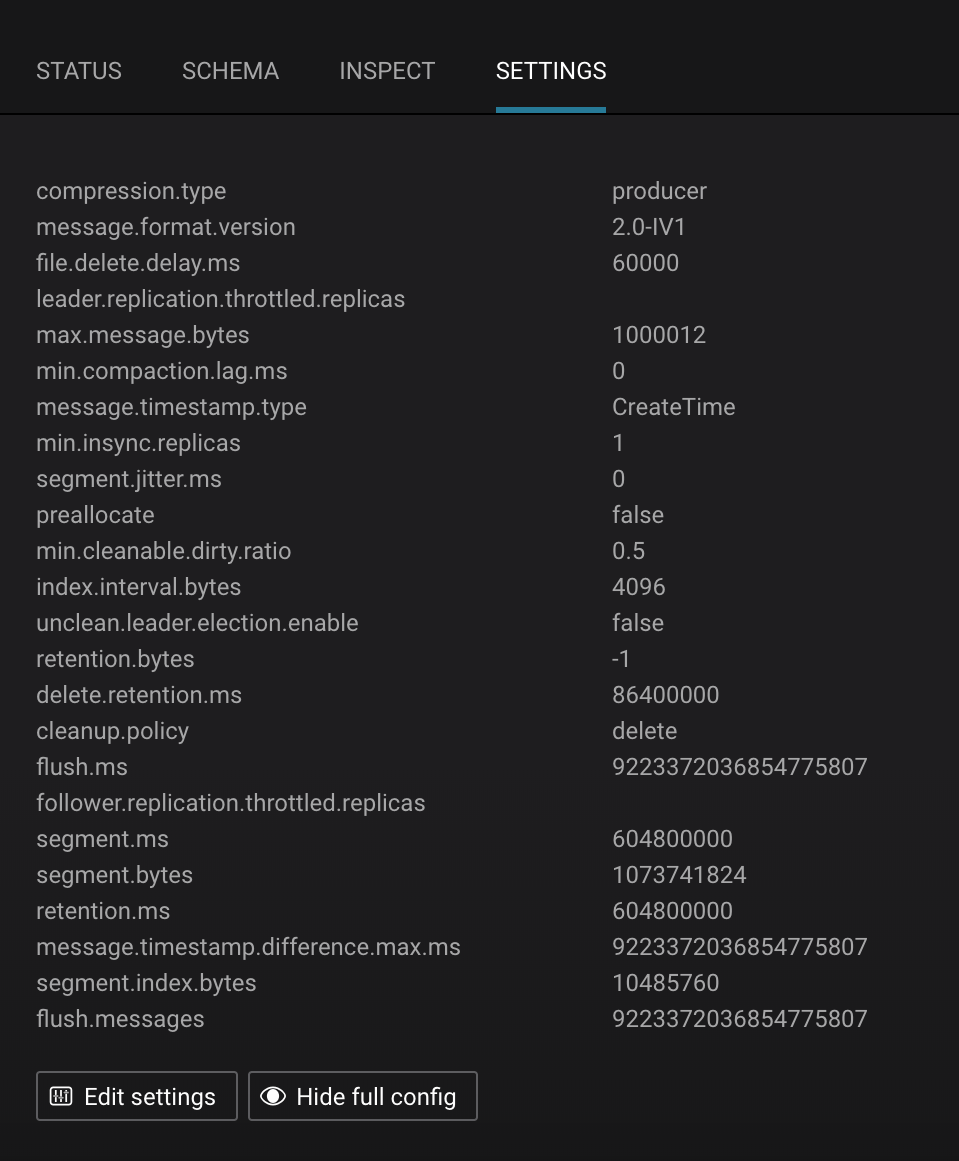
MANAGEMENT –> Topics -> Settings: View configuration settings for this topic.
MANAGEMENT -> Topics: click the
+ Createbutton on the top right to create a new topic in your Kafka cluster. You can also view and edit settings of Kafka topics in the cluster. Read more on Confluent Control Center topic management.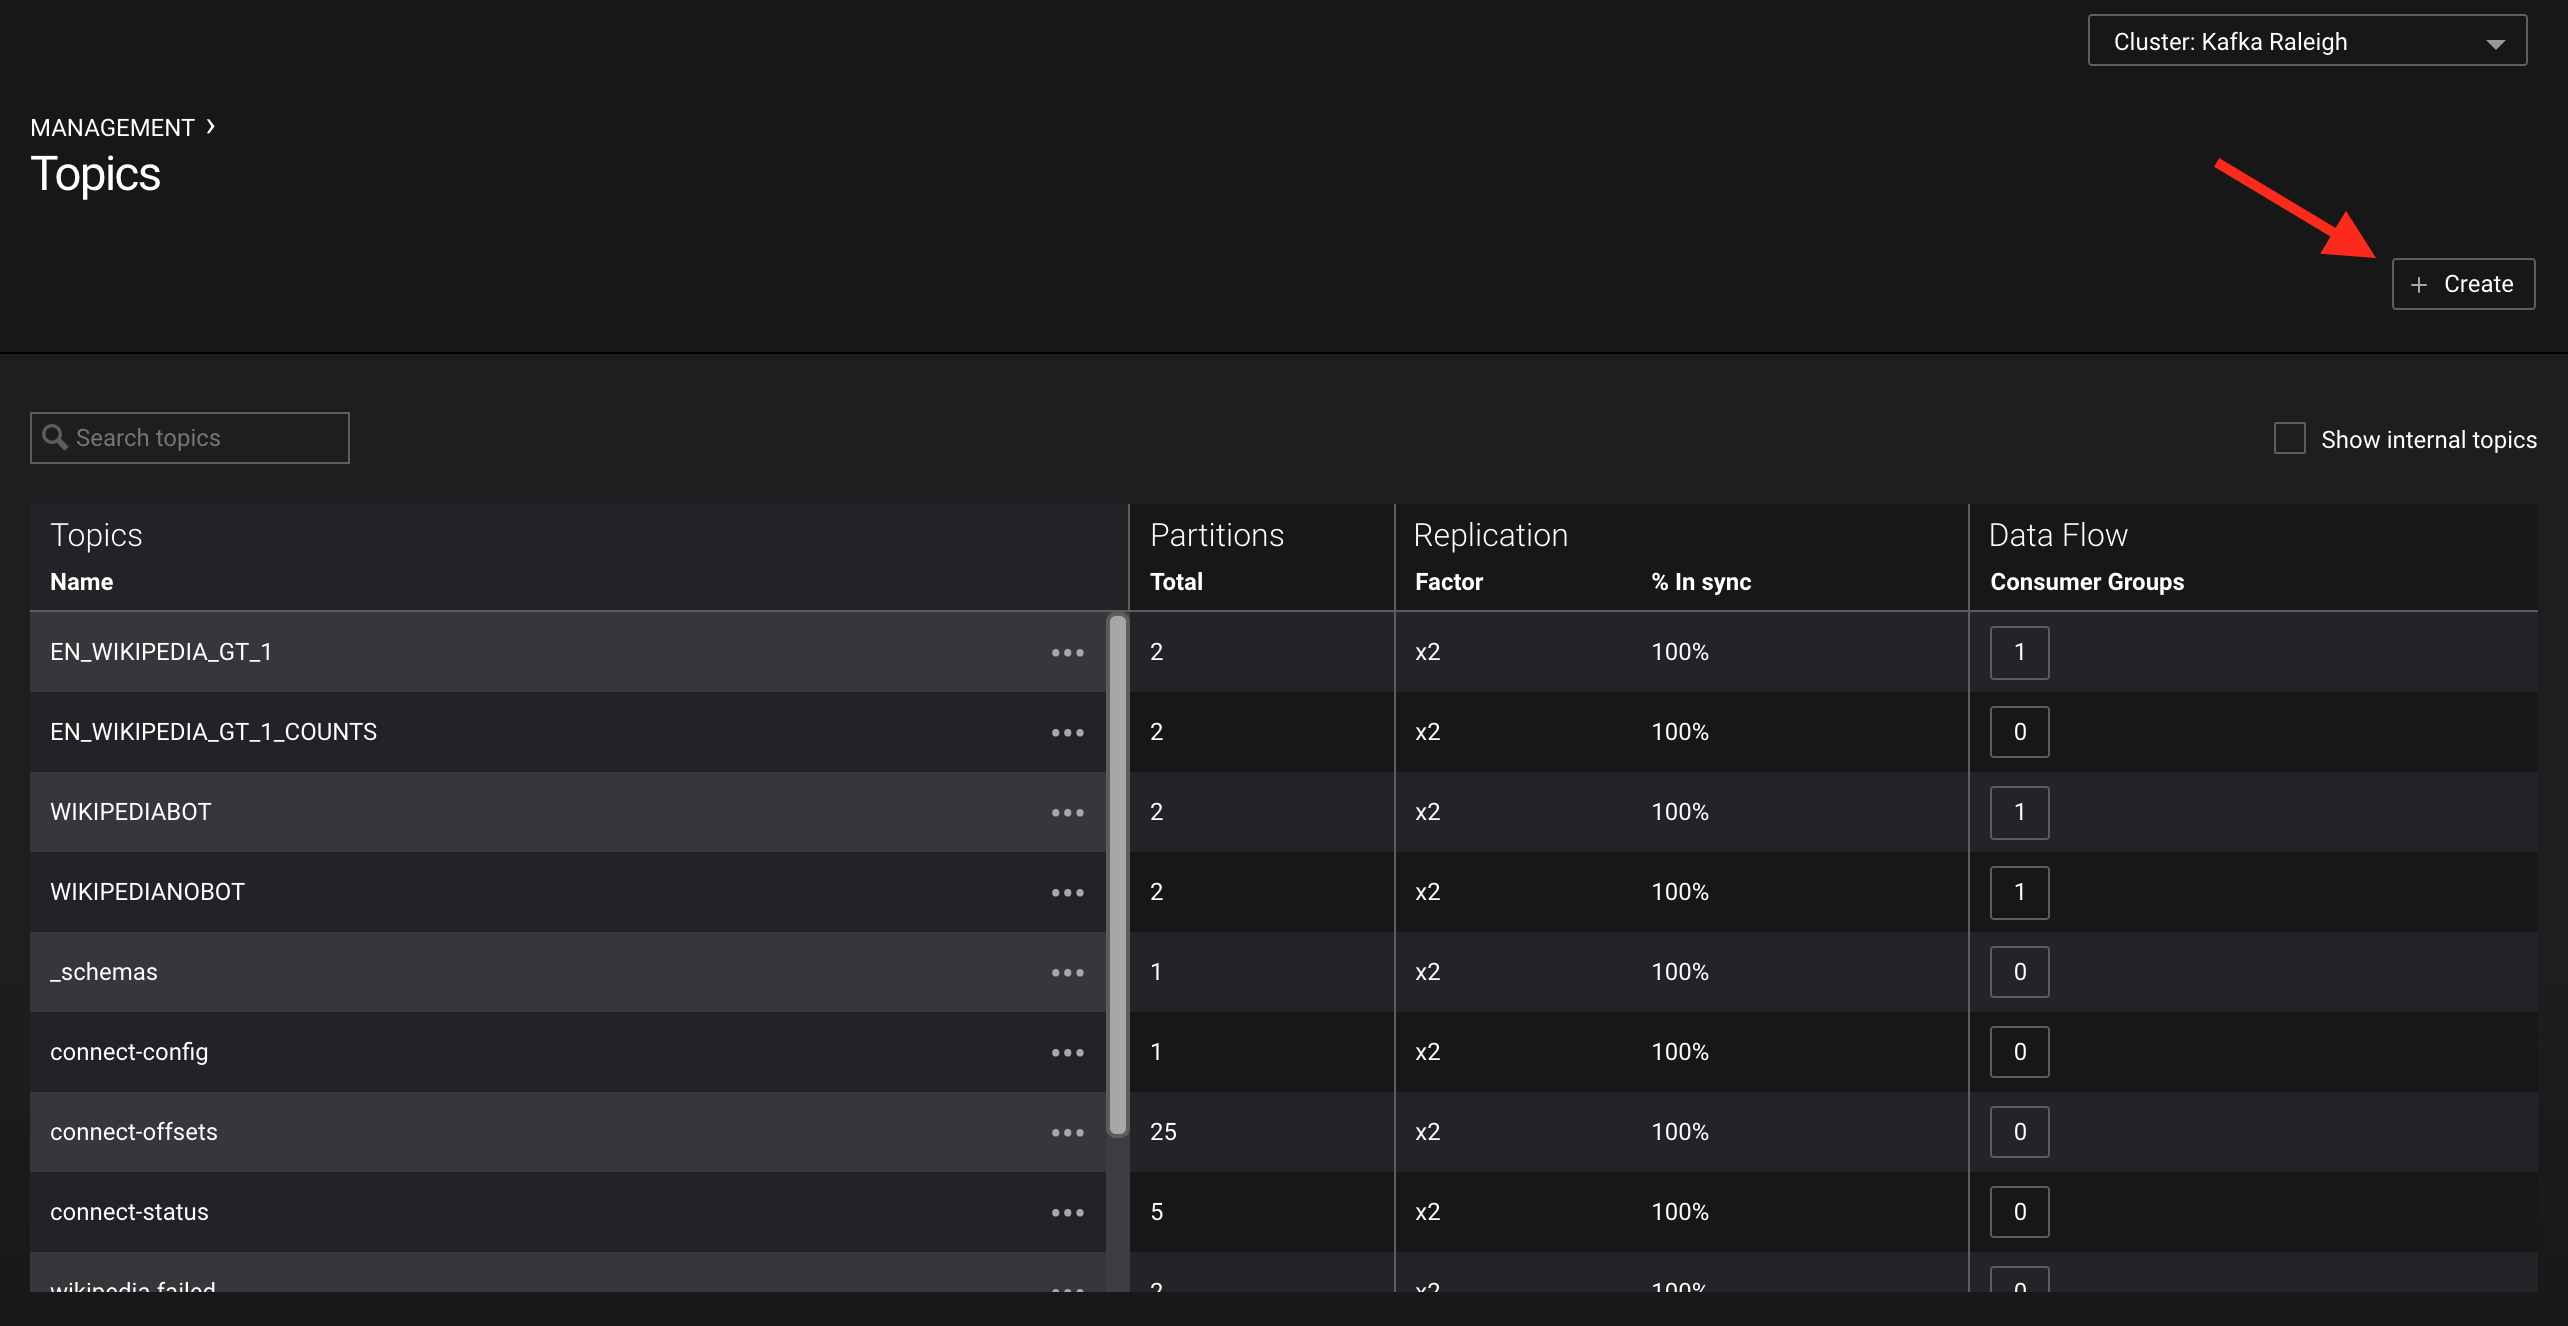
When Confluent Monitoring Interceptors are configured on Kafka clients, they write metadata to a topic called
_confluent-monitoring. Kafka clients include any application that uses the Apache Kafka client API to connect to Kafka brokers, such as custom client code or any service that has embedded producers or consumers, such as Kafka Connect, KSQL, or a Kafka Streams application. Confluent Control Center uses that topic to ensure that all messages are delivered and to provide statistics on throughput and latency performance. From that same topic, you can also derive which producers are writing to which topics and which consumers are reading from which topics, and an example script is provided with the repo (note: this is for demo purposes only, not suitable for production).$ ./scripts/app/map_topics_clients.py Reading topic _confluent-monitoring for 60 seconds...please wait EN_WIKIPEDIA_GT_1 producers _confluent-ksql-default_query_CTAS_EN_WIKIPEDIA_GT_1_2-84e85189-4f37-460c-991f-bb7bbb4b5a58-StreamThread-12-producer _confluent-ksql-default_query_CTAS_EN_WIKIPEDIA_GT_1_2-84e85189-4f37-460c-991f-bb7bbb4b5a58-StreamThread-9-producer consumers _confluent-ksql-default_query_CSAS_EN_WIKIPEDIA_GT_1_COUNTS_3 EN_WIKIPEDIA_GT_1_COUNTS producers _confluent-ksql-default_query_CSAS_EN_WIKIPEDIA_GT_1_COUNTS_3-df19ff7e-4d42-4b40-8133-a3632c86e42d-StreamThread-13-producer _confluent-ksql-default_query_CSAS_EN_WIKIPEDIA_GT_1_COUNTS_3-df19ff7e-4d42-4b40-8133-a3632c86e42d-StreamThread-14-producer consumers EN_WIKIPEDIA_GT_1_COUNTS-consumer WIKIPEDIABOT producers _confluent-ksql-default_query_CSAS_WIKIPEDIABOT_1-7d47ae21-e734-43da-9782-bae3191fc85a-StreamThread-7-producer _confluent-ksql-default_query_CSAS_WIKIPEDIABOT_1-7d47ae21-e734-43da-9782-bae3191fc85a-StreamThread-8-producer consumers connect-elasticsearch-ksql WIKIPEDIANOBOT producers _confluent-ksql-default_query_CSAS_WIKIPEDIANOBOT_0-6f29b3fb-abf8-4c3e-bb8d-266cb5aa65c6-StreamThread-2-producer _confluent-ksql-default_query_CSAS_WIKIPEDIANOBOT_0-6f29b3fb-abf8-4c3e-bb8d-266cb5aa65c6-StreamThread-3-producer consumers WIKIPEDIANOBOT-consumer _confluent-ksql-default_query_CTAS_EN_WIKIPEDIA_GT_1_2-KSTREAM-AGGREGATE-STATE-STORE-0000000007-changelog producers _confluent-ksql-default_query_CTAS_EN_WIKIPEDIA_GT_1_2-84e85189-4f37-460c-991f-bb7bbb4b5a58-StreamThread-12-producer _confluent-ksql-default_query_CTAS_EN_WIKIPEDIA_GT_1_2-84e85189-4f37-460c-991f-bb7bbb4b5a58-StreamThread-9-producer _confluent-ksql-default_query_CTAS_EN_WIKIPEDIA_GT_1_2-KSTREAM-AGGREGATE-STATE-STORE-0000000007-repartition producers _confluent-ksql-default_query_CTAS_EN_WIKIPEDIA_GT_1_2-84e85189-4f37-460c-991f-bb7bbb4b5a58-StreamThread-11-producer consumers _confluent-ksql-default_query_CTAS_EN_WIKIPEDIA_GT_1_2 wikipedia.parsed producers connect-worker-producer consumers _confluent-ksql-default_query_CSAS_WIKIPEDIABOT_1 _confluent-ksql-default_query_CSAS_WIKIPEDIANOBOT_0 _confluent-ksql-default_query_CTAS_EN_WIKIPEDIA_GT_1_2 connect-replicator wikipedia.parsed.replica producers connect-worker-producer
KSQL
Follow along with the Demo 3: KSQL video.
In this demo, KSQL is authenticated and authorized to connect to the secured Kafka cluster, and it is already running queries as defined in the KSQL command file.
The KSQL server is listening on port 8088. You have two options for interfacing with KSQL:
Use Control Center’s integrated KSQL UI. From the Confluent Control Center UI, click DEVELOPMENT –> KSQL:

Run KSQL CLI to get to the KSQL CLI prompt.
docker-compose exec ksql-cli ksql http://ksql-server:8088
DEVELOPMENT -> KSQL -> STREAMS: View the existing KSQL streams. (If you are using the KSQL CLI, at the
ksql>prompt typeSHOW STREAMS;).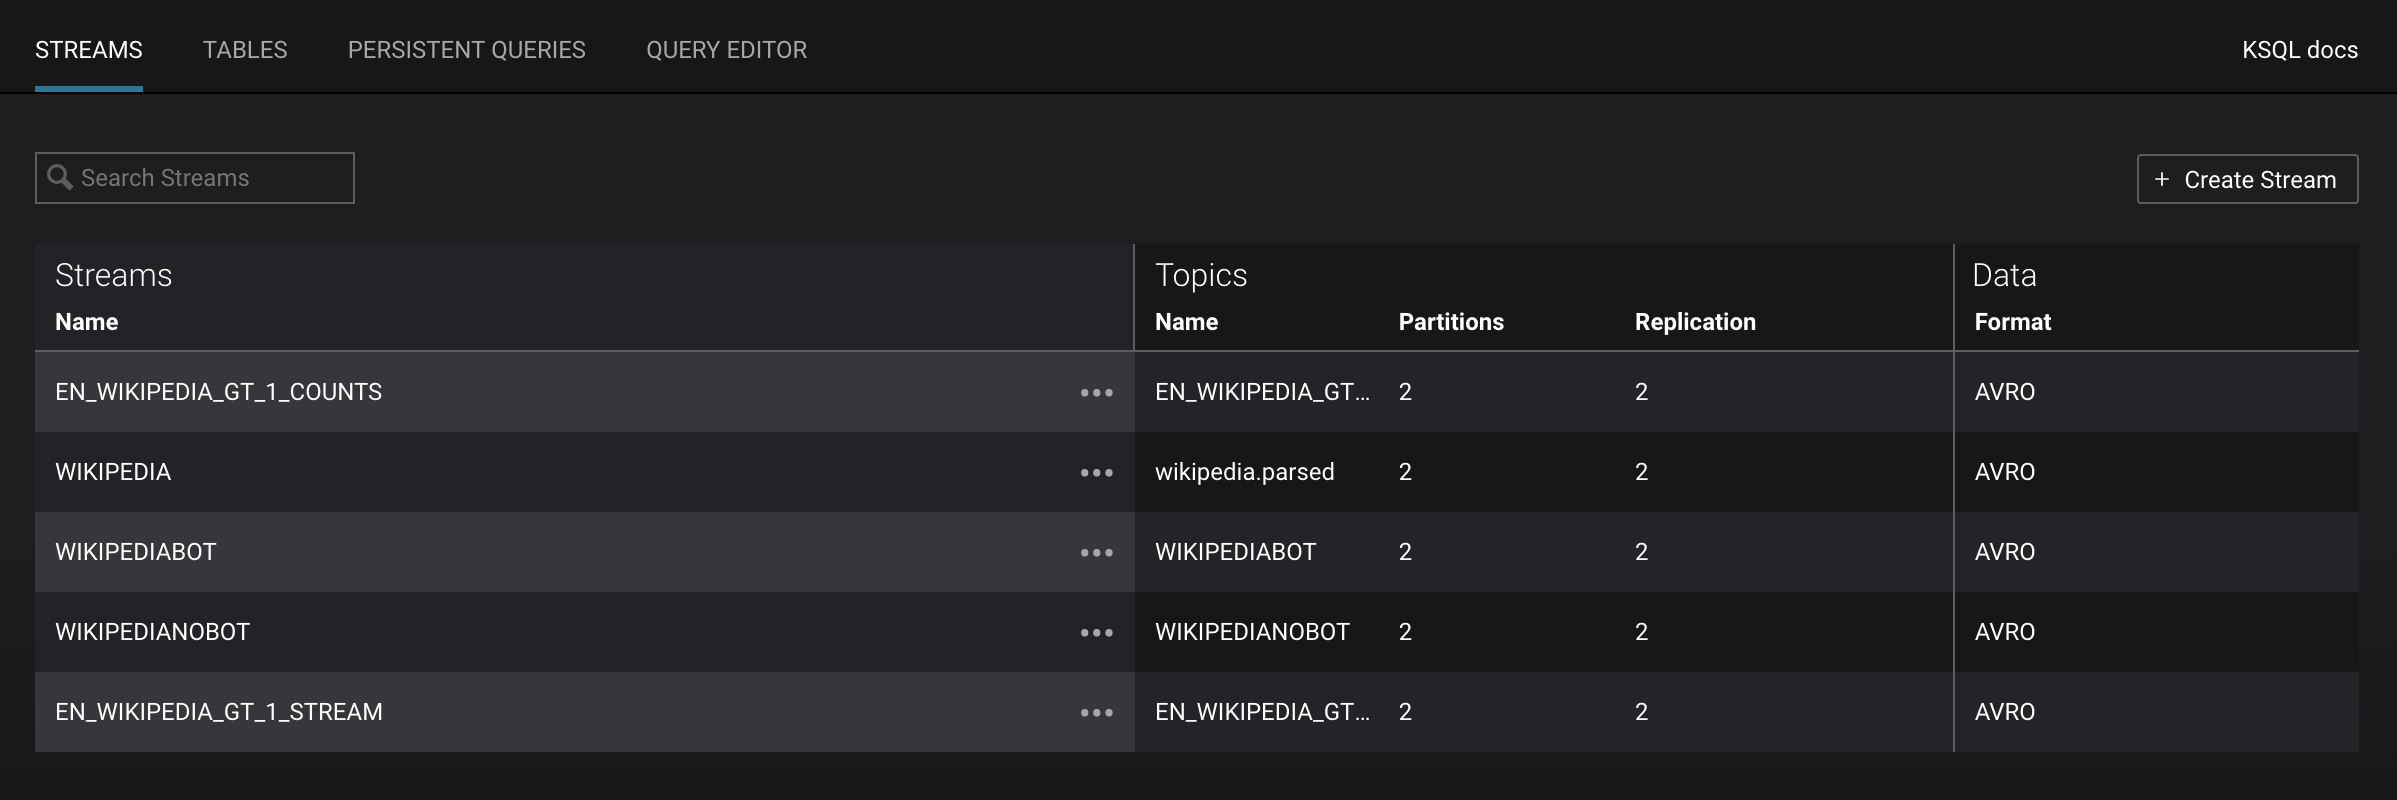
DEVELOPMENT -> KSQL -> STREAMS: Describe the schema (fields or columns) and source and sink of an existing KSQL stream. Click on
WIKIPEDIA.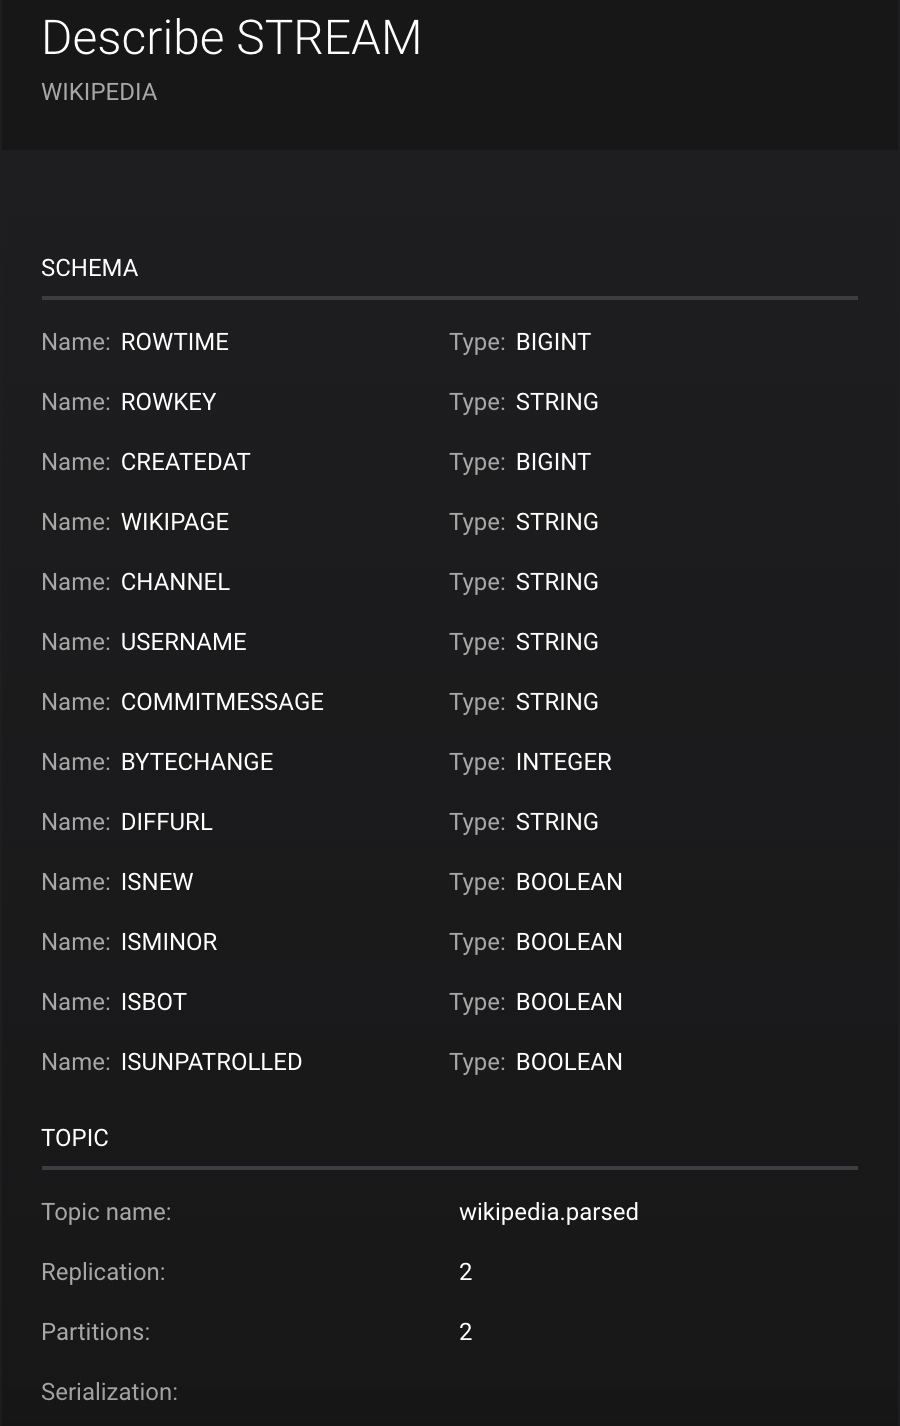
DEVELOPMENT -> KSQL -> TABLES: View the existing KSQL tables. (If you are using the KSQL CLI, at the
ksql>prompt typeSHOW TABLES;).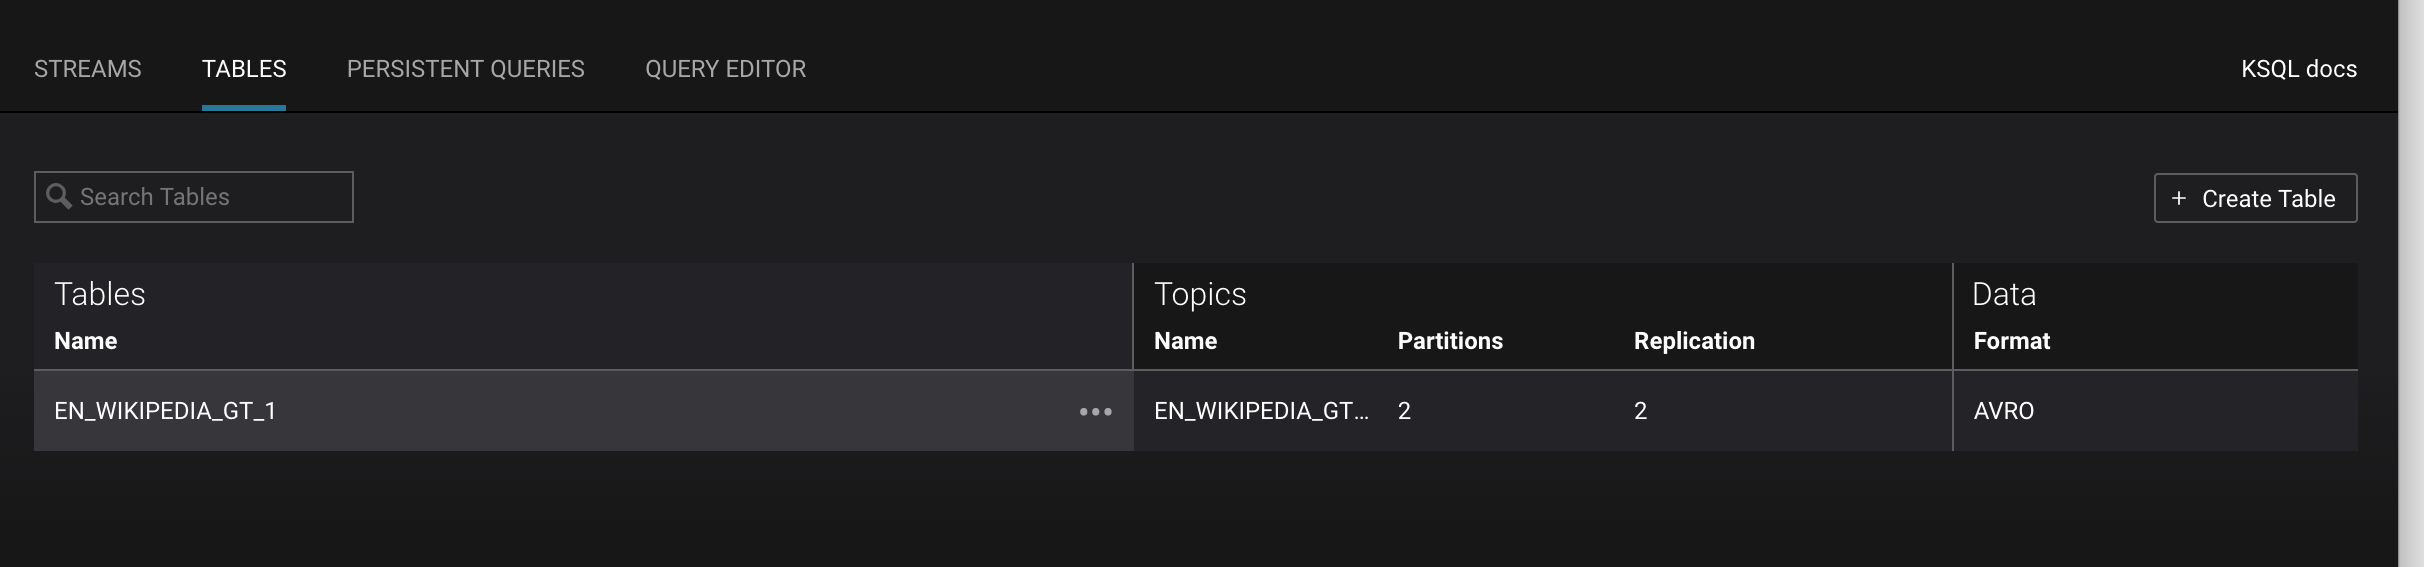
DEVELOPMENT -> KSQL -> PERSISTENT QUERIES: View the existing KSQL queries, which are continuously running. (If you are using the KSQL CLI, at the
ksql>prompt typeSHOW QUERIES;).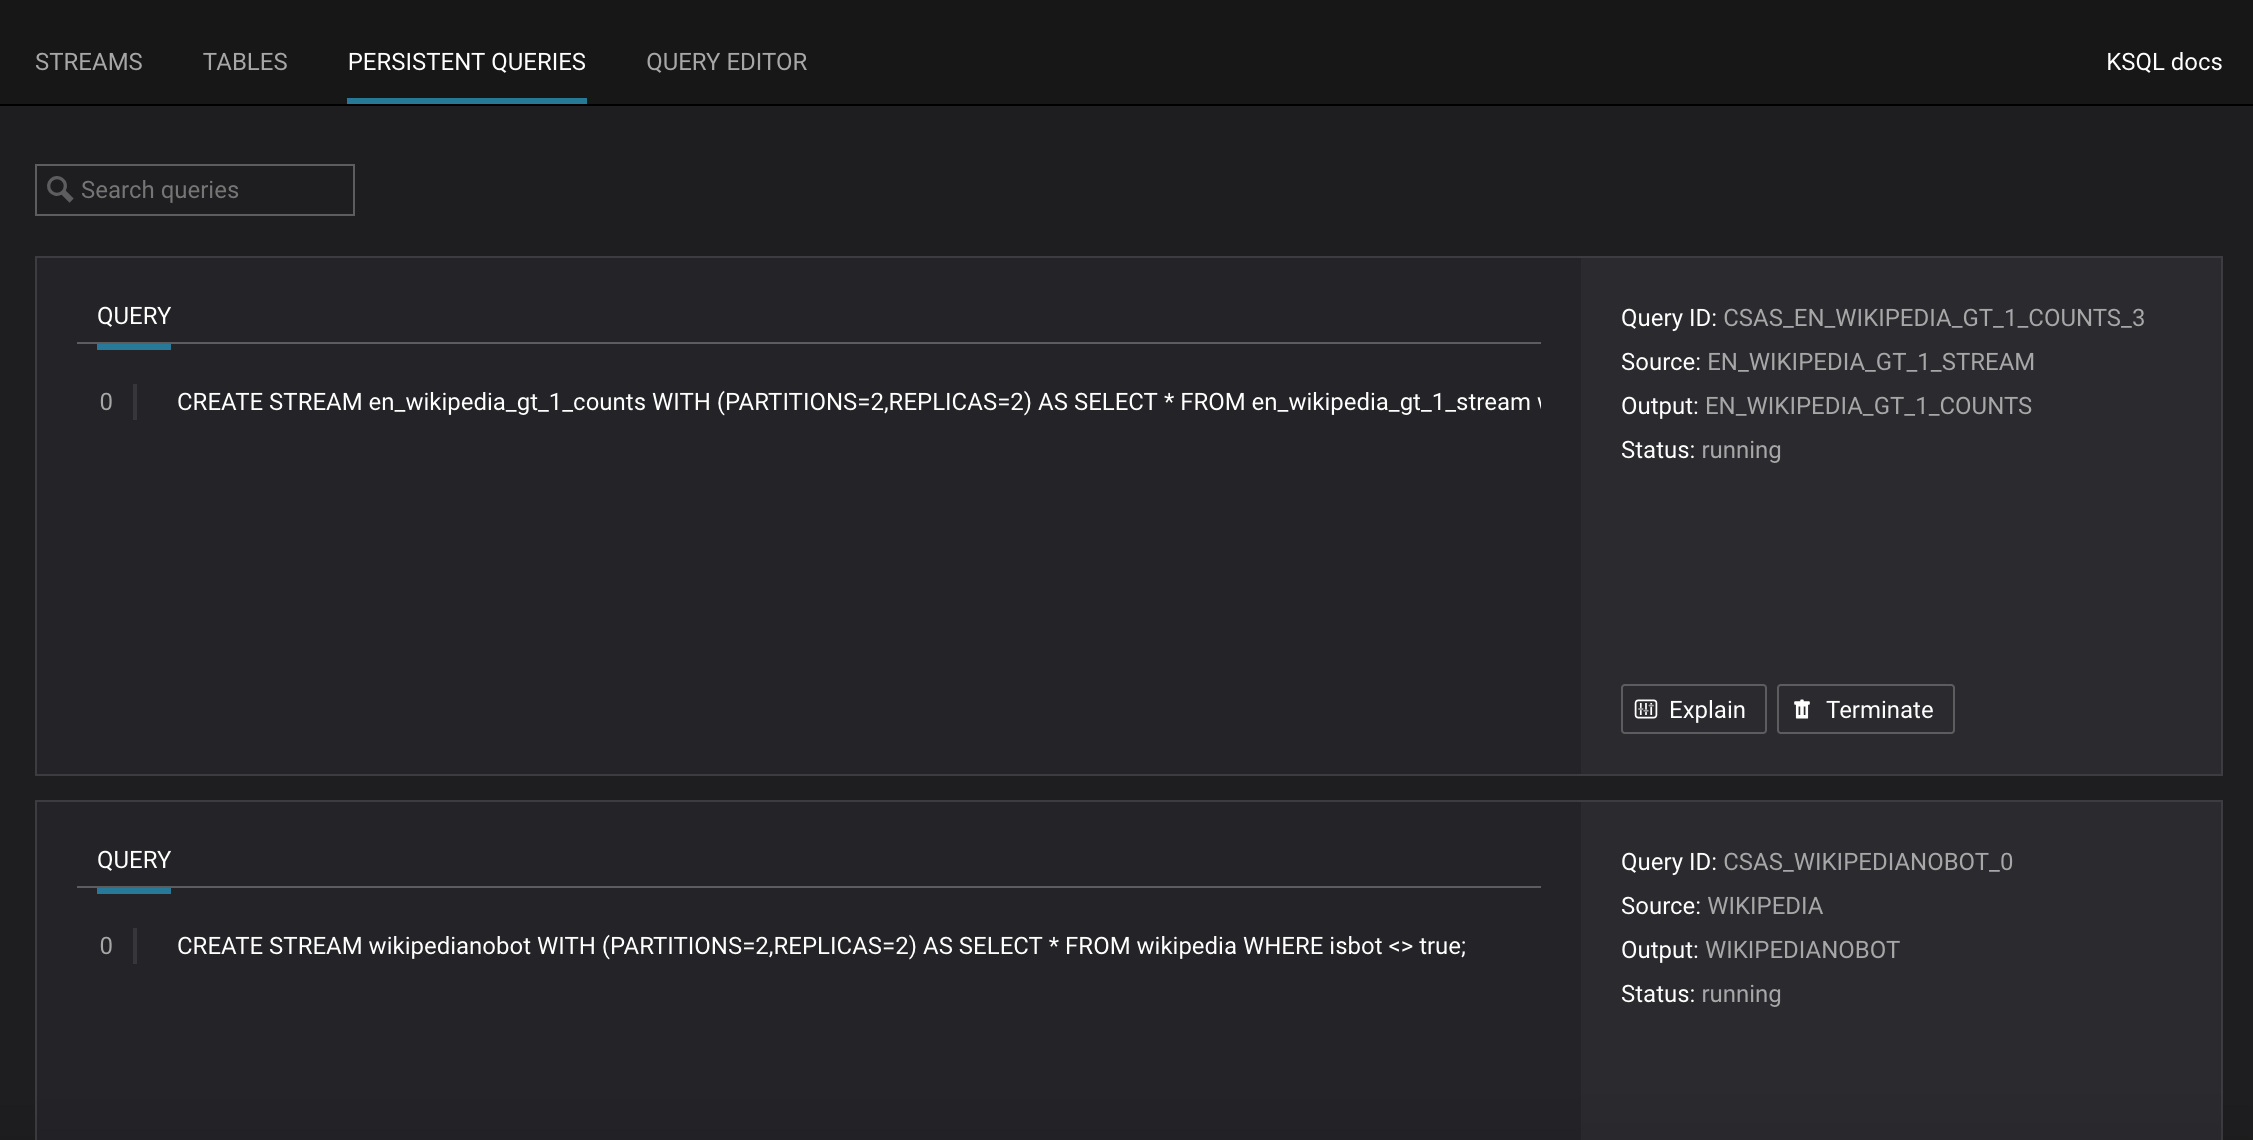
DEVELOPMENT -> KSQL -> STREAMS: View messages from different KSQL streams and tables. Right click on your stream of choice, select
Querywhich takes you to the Query Editor with a pre-populated query such asselect * from WIKIPEDIA limit 5;. Click on theRun querybutton to run.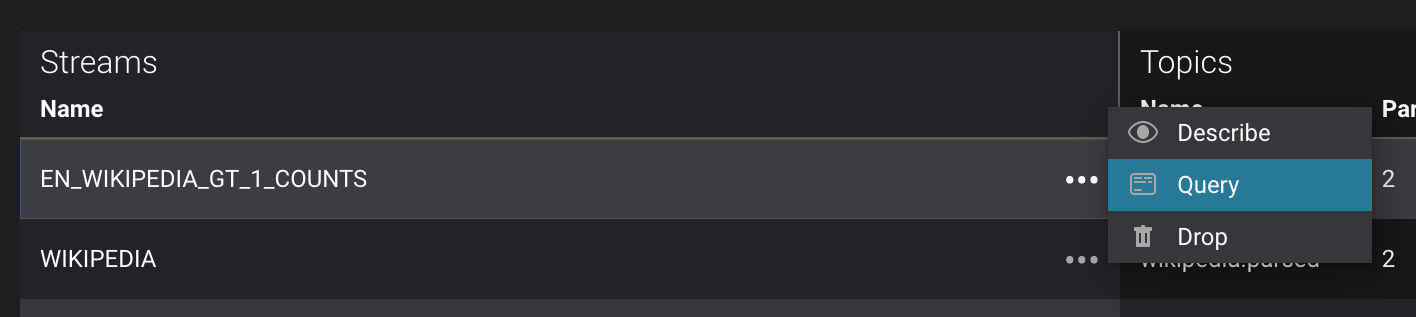
DEVELOPMENT -> KSQL -> STREAMS: Create a new stream from an existing topic. Click on the button
Create Streamand follow the prompts.DEVELOPMENT -> KSQL -> QUERY EDITOR: View the configured KSQL server properties set in the docker-compose.yml file. In the query editor, type
SHOW PROPERTIES;and then click on theRun querybutton.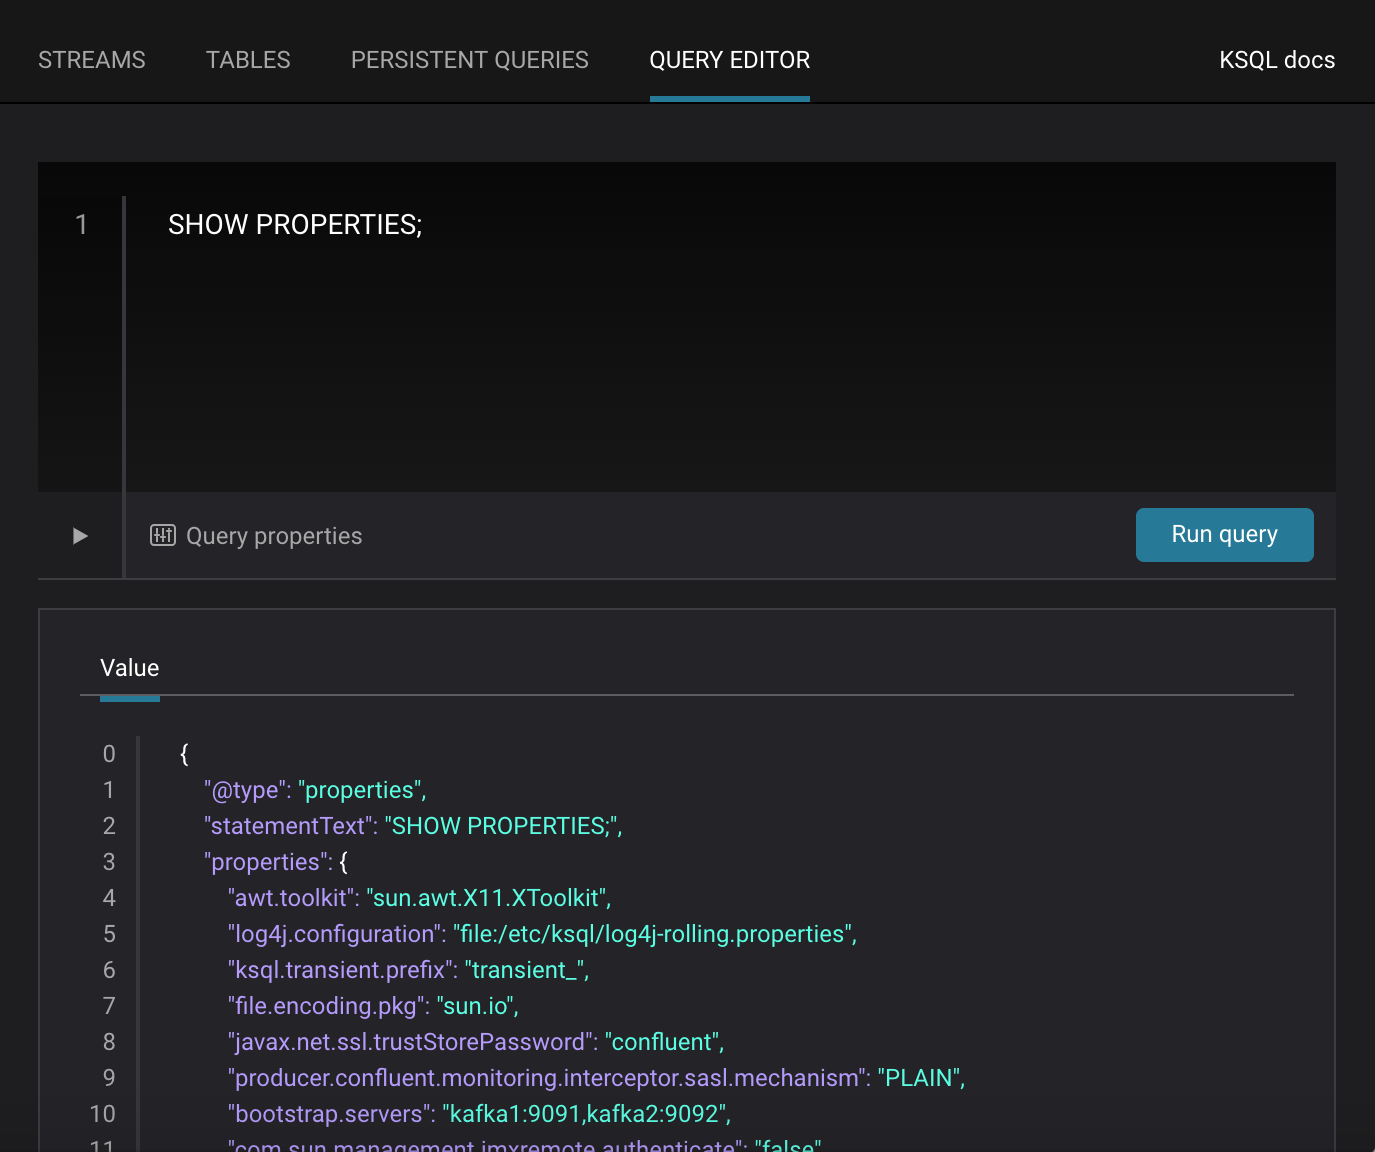
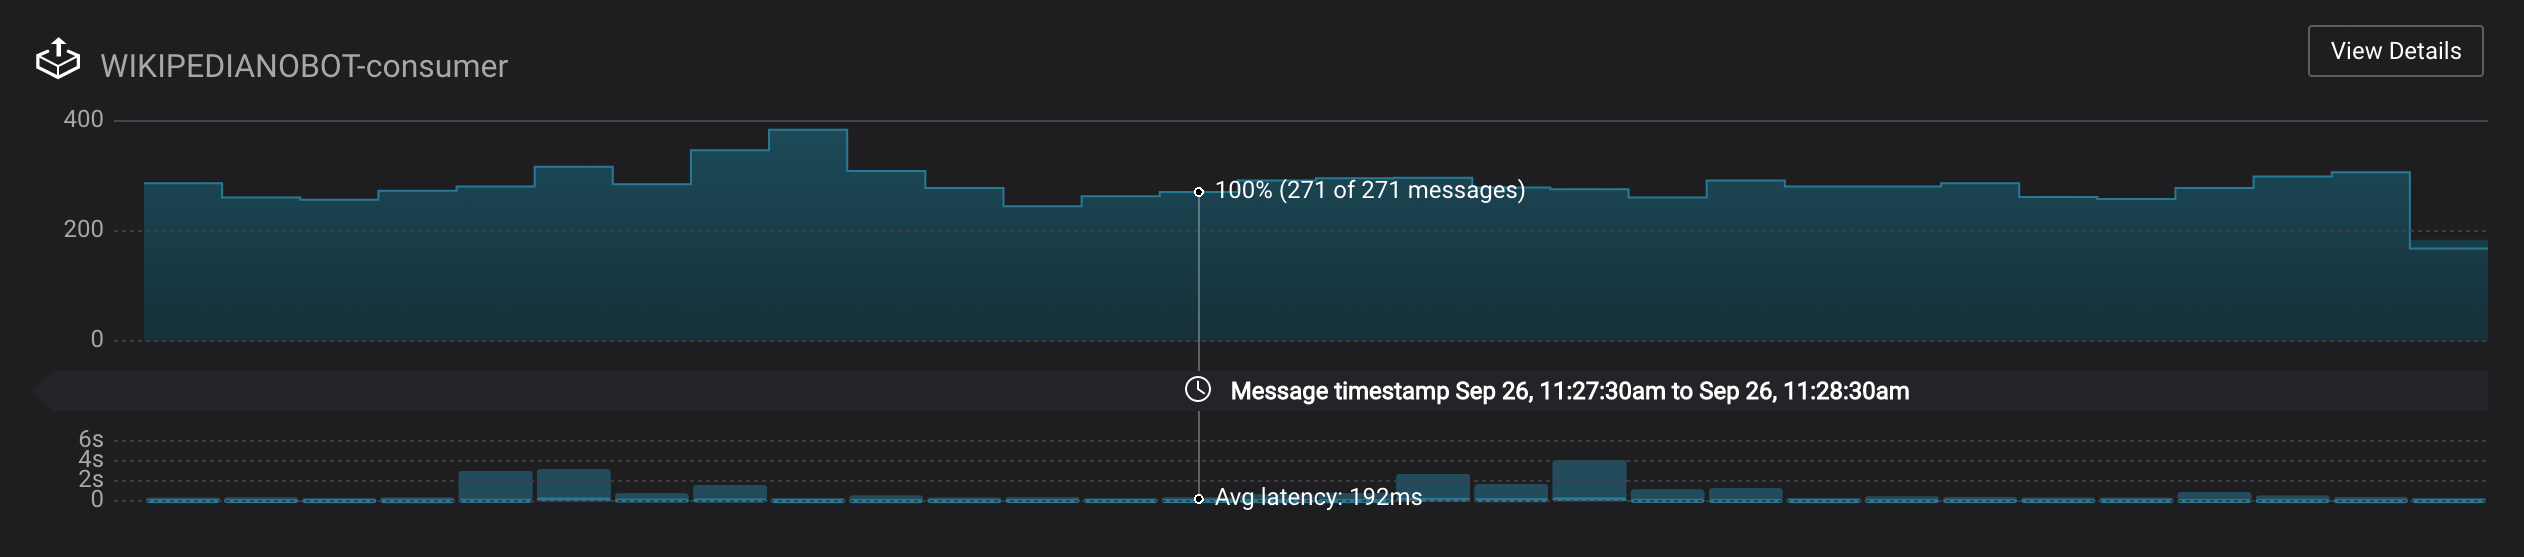
In this demo, KSQL is run with Confluent Monitoring Interceptors configured which enables Confluent Control Center Data Streams to monitor KSQL queries. The consumer group names
ksql_query_correlate to the KSQL query names above, and Confluent Control Center is showing the records that are incoming to each query.
View throughput and latency of the incoming records for the persistent KSQL “Create Stream As Select” query
CSAS_WIKIPEDIABOT, which is displayed asksql_query_CSAS_WIKIPEDIABOTin Confluent Control Center.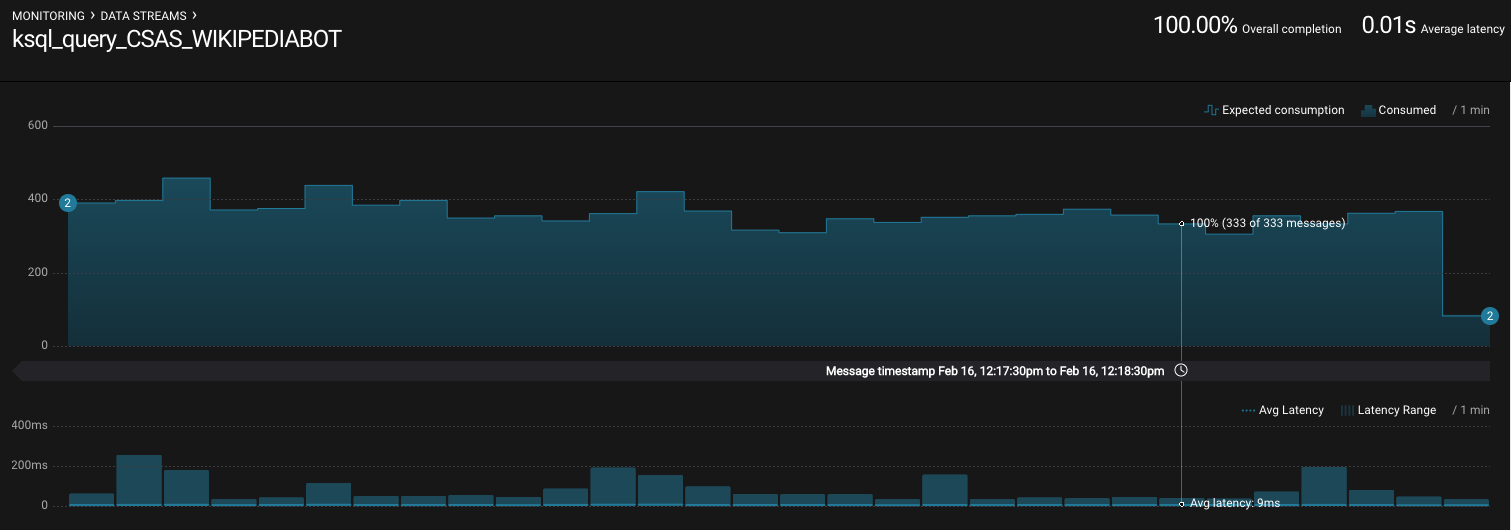
View throughput and latency of the incoming records for the persistent KSQL “Create Table As Select” query
CTAS_EN_WIKIPEDIA_GT_1, which is displayed asksql_query_CTAS_EN_WIKIPEDIA_GT_1in Confluent Control Center.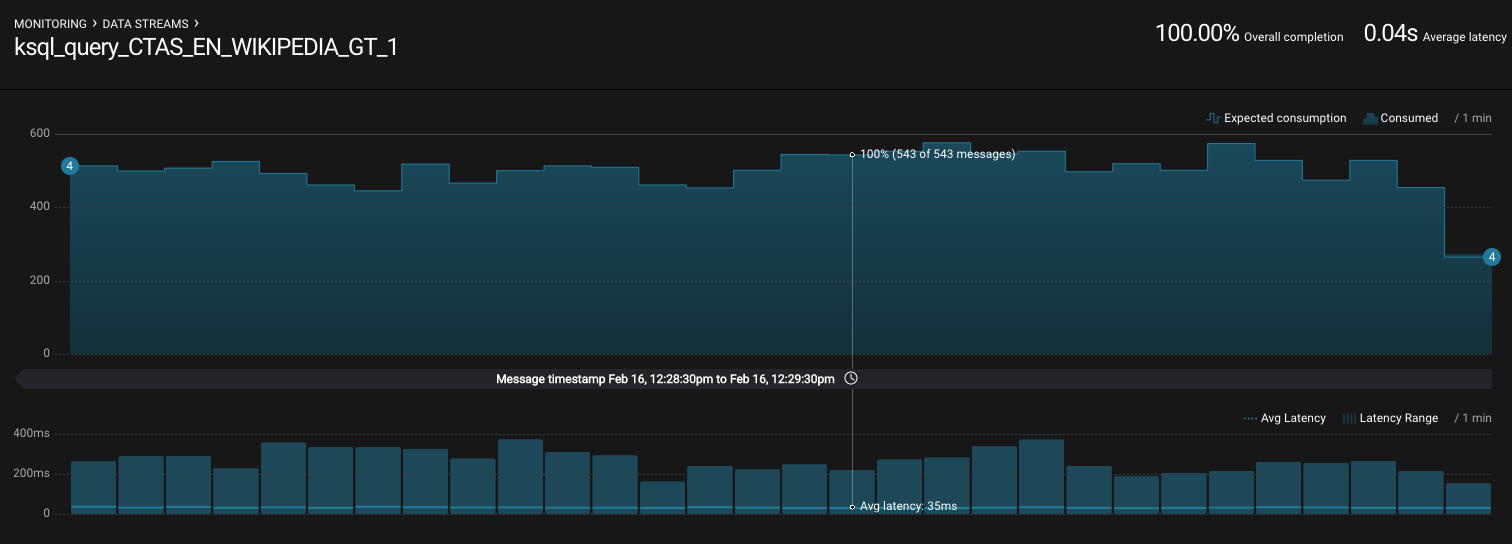
View throughput and latency of the incoming records for the persistent KSQL “Create Stream As Select” query
CTAS_EN_WIKIPEDIA_GT_1_COUNTS, which is displayed asksql_query_CSAS_EN_WIKIPEDIA_GT_1_COUNTSin Confluent Control Center.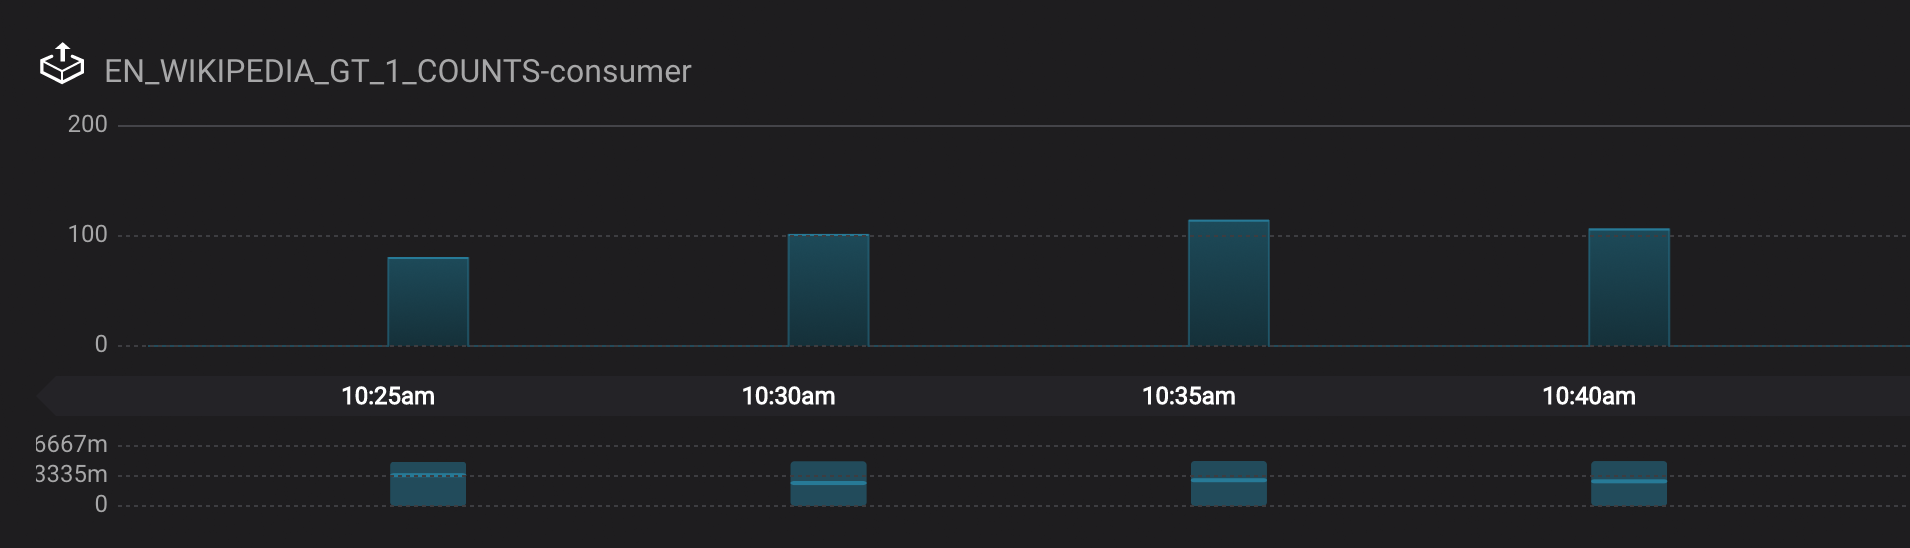
Note
In Confluent Control Center the stream monitoring graphs for consumer groups
ksql_query_CSAS_EN_WIKIPEDIA_GT_1_COUNTSandEN_WIKIPEDIA_GT_1_COUNTS-consumerare displaying data at 5-minute intervals instead of smoothly like the other consumer groups. This is because Confluent Control Center displays data based on message timestamps, and the incoming stream for these consumer groups is a tumbling window with a window size of 5 minutes. Thus all its messages are timestamped to the beginning of each 5-minute window. This is also why the latency for these streams appears to be high. Kafka streaming tumbling windows are working as designed, and Confluent Control Center is reporting them accurately.
- This demo creates two streams
EN_WIKIPEDIA_GT_1andEN_WIKIPEDIA_GT_1_COUNTS, and the reason is to demonstrate how KSQL windows work.EN_WIKIPEDIA_GT_1counts occurences with a tumbling window, and for a given key it writes a null into the table on the first seen message. The underlying Kafka topic forEN_WIKIPEDIA_GT_1does not filter out those nulls, but since we want to send downstream just the counts greater than one, there is a separate Kafka topic for``EN_WIKIPEDIA_GT_1_COUNTSwhich does filter out those nulls (e.g., the query has a clausewhere ROWTIME is not null). From the bash prompt, view those underlying Kafka topics.
  docker exec connect kafka-avro-console-consumer --bootstrap-server kafka1:9091 --topic EN_WIKIPEDIA_GT_1 \
  --property schema.registry.url=https://schemaregistry:8085 \
  --consumer.config /etc/kafka/secrets/client_without_interceptors.config --max-messages 10
null
{"USERNAME":"Atsme","WIKIPAGE":"Wikipedia:Articles for deletion/Metallurg Bratsk","COUNT":2}
null
null
null
{"USERNAME":"7.61.29.178","WIKIPAGE":"Tandem language learning","COUNT":2}
{"USERNAME":"Attar-Aram syria","WIKIPAGE":"Antiochus X Eusebes","COUNT":2}
...

  docker exec connect kafka-avro-console-consumer --bootstrap-server kafka1:9091 --topic EN_WIKIPEDIA_GT_1_COUNTS \
  --property schema.registry.url=https://schemaregistry:8085 \
  --consumer.config /etc/kafka/secrets/client_without_interceptors.config --max-messages 10
{"USERNAME":"Atsme","COUNT":2,"WIKIPAGE":"Wikipedia:Articles for deletion/Metallurg Bratsk"}
{"USERNAME":"7.61.29.178","COUNT":2,"WIKIPAGE":"Tandem language learning"}
{"USERNAME":"Attar-Aram syria","COUNT":2,"WIKIPAGE":"Antiochus X Eusebes"}
{"USERNAME":"RonaldB","COUNT":2,"WIKIPAGE":"Wikipedia:Open proxy detection"}
{"USERNAME":"Dormskirk","COUNT":2,"WIKIPAGE":"Swindon Designer Outlet"}
{"USERNAME":"B.Bhargava Teja","COUNT":3,"WIKIPAGE":"Niluvu Dopidi"}
...
Consumer rebalances
Follow along with the Demo 4: Consumer Rebalances video.
Control Center shows which consumers in a consumer group are consuming from which partitions and on which brokers those partitions reside. Control Center updates as consumer rebalances occur in a consumer group.
Start consuming from topic
wikipedia.parsedwith a new consumer groupappwith one consumerconsumer_app_1. It will run in the background../scripts/app/start_consumer_app.sh 1Let this consumer group run for 2 minutes until Control Center stream monitoring shows the consumer group
appwith steady consumption. Click on the boxView Detailsabove the bar graph to drill down into consumer group details. This consumer groupapphas a single consumerconsumer_app_1consuming all of the partitions in the topicwikipedia.parsed. The first bar may be red because the consumer started in the middle of a time window and did not receive all messages produced during that window. This does not mean messages were lost.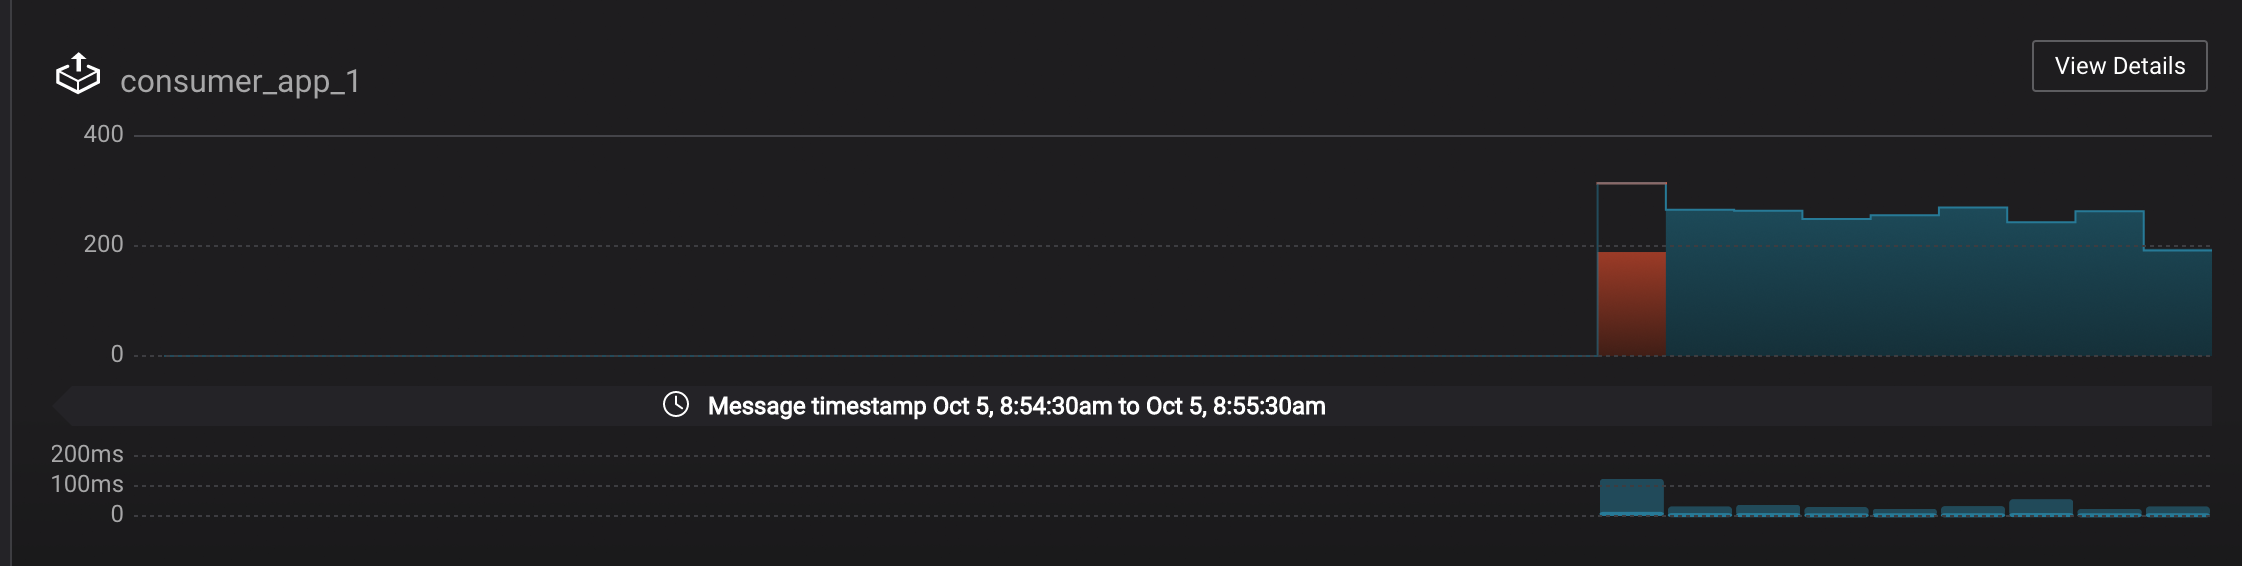
Add a second consumer
consumer_app_2to the existing consumer groupapp../scripts/app/start_consumer_app.sh 2Let this consumer group run for 2 minutes until Control Center stream monitoring shows the consumer group
appwith steady consumption. Notice that the consumersconsumer_app_1andconsumer_app_2now share consumption of the partitions in the topicwikipedia.parsed. When the second consumer was added, that bar may be red for both consumers because a consumer rebalance occurred during that time window. This does not mean messages were lost, as you can confirm at the consumer group level.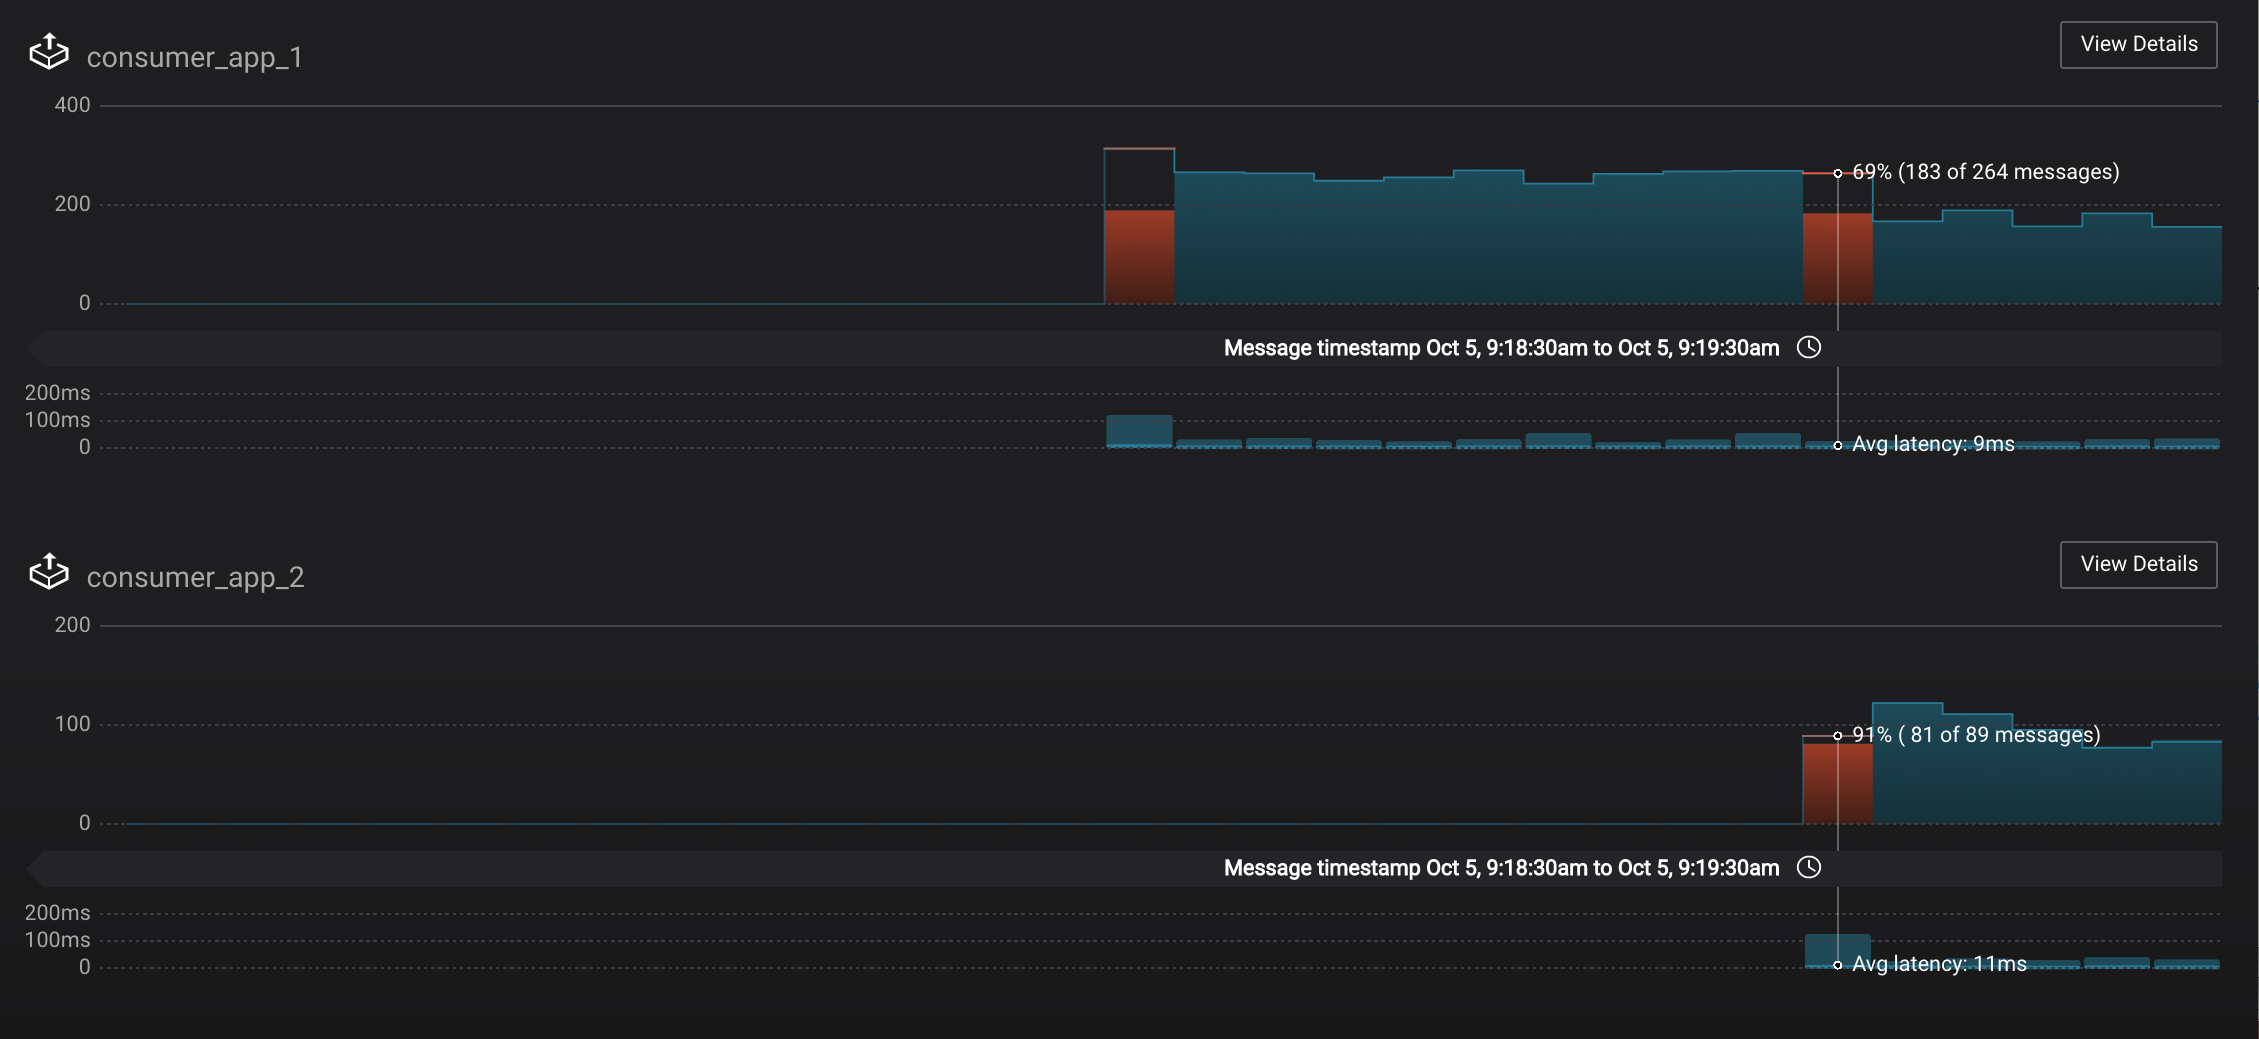
Slow consumers
Follow along with the Demo 5: Slow Consumers video.
Streams monitoring in Control Center can highlight consumers that are slow to keep up with the producers. This is critial to monitor for real-time applications where consumers should consume produced messages with as low latency as possible. To simulate a slow consumer, we will use Kafka’s quota feature to rate-limit consumption from the broker side, for just one of two consumers in a consumer group.
Click on
Data streams, andView Detailsfor the consumer groupapp. Click on the left-hand blue circle on the consumption line to verify there are two consumersconsumer_app_1andconsumer_app_2, that were created in an earlier section. If these two consumers are not running, start them as described in the section consumer rebalances.Let this consumer group run for 2 minutes until Control Center stream monitoring shows the consumer group
appwith steady consumption.Add a consumption quota for one of the consumers in the consumer group
app../scripts/app/throttle_consumer.sh 1 addNote
You are running a Docker demo environment with all services running on one host, which you would never do in production. Depending on your system resource availability, sometimes applying the quota may stall the consumer (KAFKA-5871), thus you may need to adjust the quota rate. See the
./scripts/app/throttle_consumer.shscript for syntax on modifying the quota rate.- If consumer group
appdoes not increase latency, decrease the quota rate - If consumer group
appseems to stall, increase the quota rate
- If consumer group
View the details of the consumer group
appagain,consumer_app_1now shows high latency, andconsumer_app_2shows normal latency.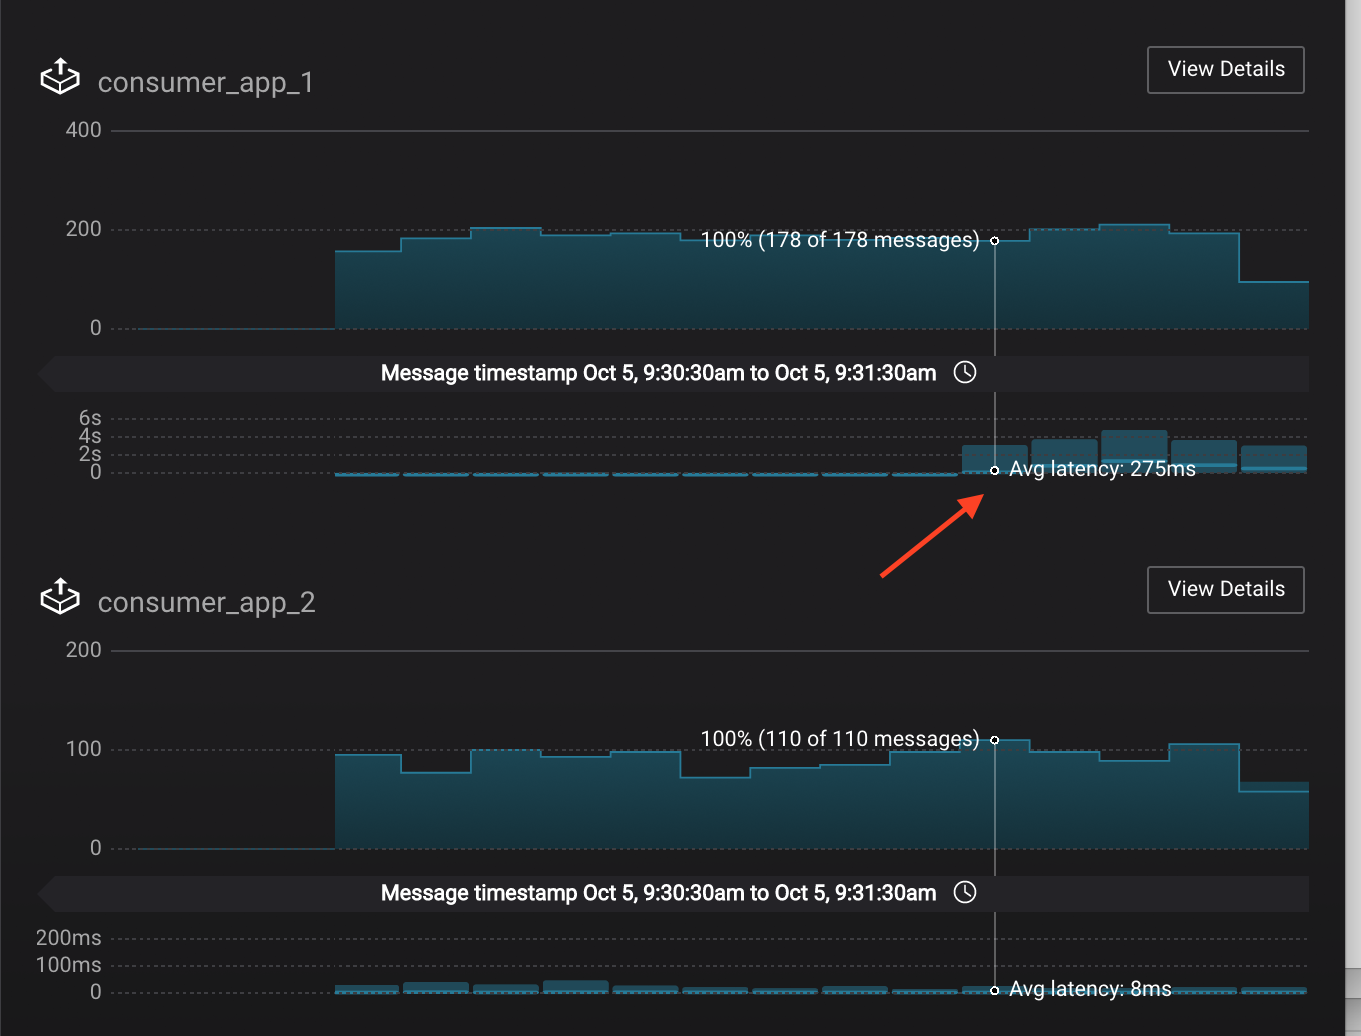
In the System Health dashboard, you see that the fetch request latency has likewise increased. This is the because the broker that has the partition that
consumer_app_1is consuming from is taking longer to service requests.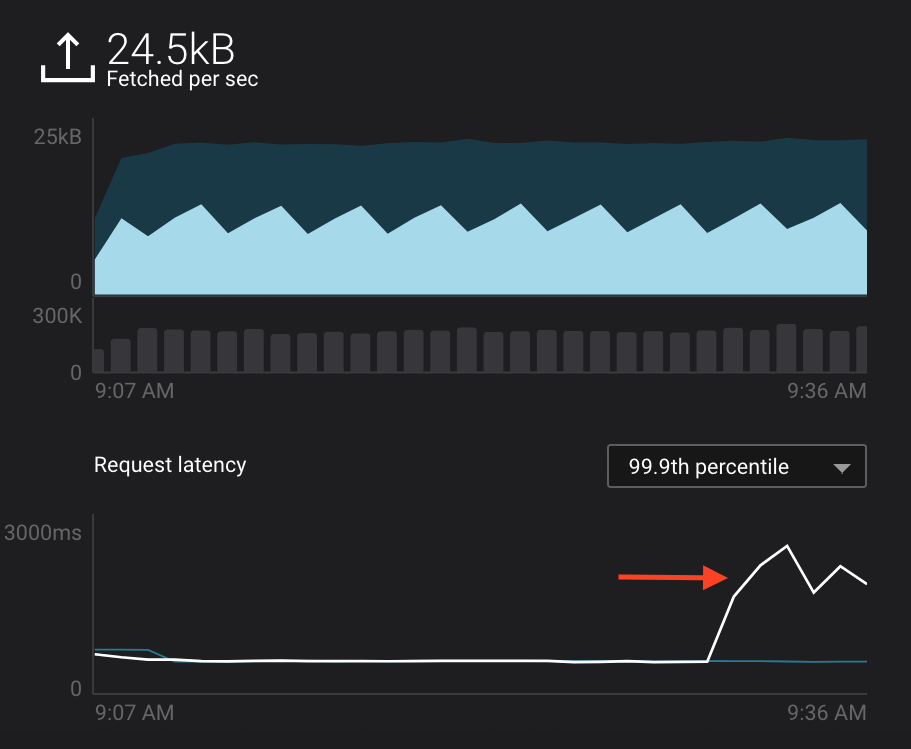
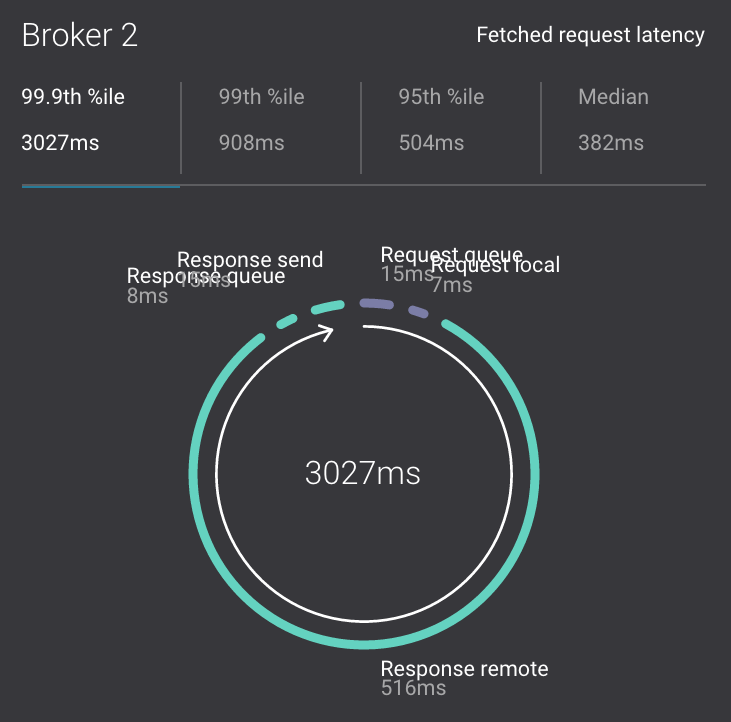
Click on the fetch request latency line graph to see a breakdown of produce and fetch latencies through the entire request lifecycle. The middle number does not necessarily equal the sum of the percentiles of individual segments because it is the total percentile latency.
MONITORING -> Consumer lag: consumer lag is the topic’s high water mark (latest offset for the topic that has been written) minus the current consumer offset (latest offset read for that topic by that consumer group). Keep in mind topic write rate and consumer group read rate when considering what the significance of how big is the consumer lag. In the demo, view the consumer lag for the
appconsumer group: expect consumer 1 to be have much more lag than consumer 2 because of the throttle you added in an earlier step.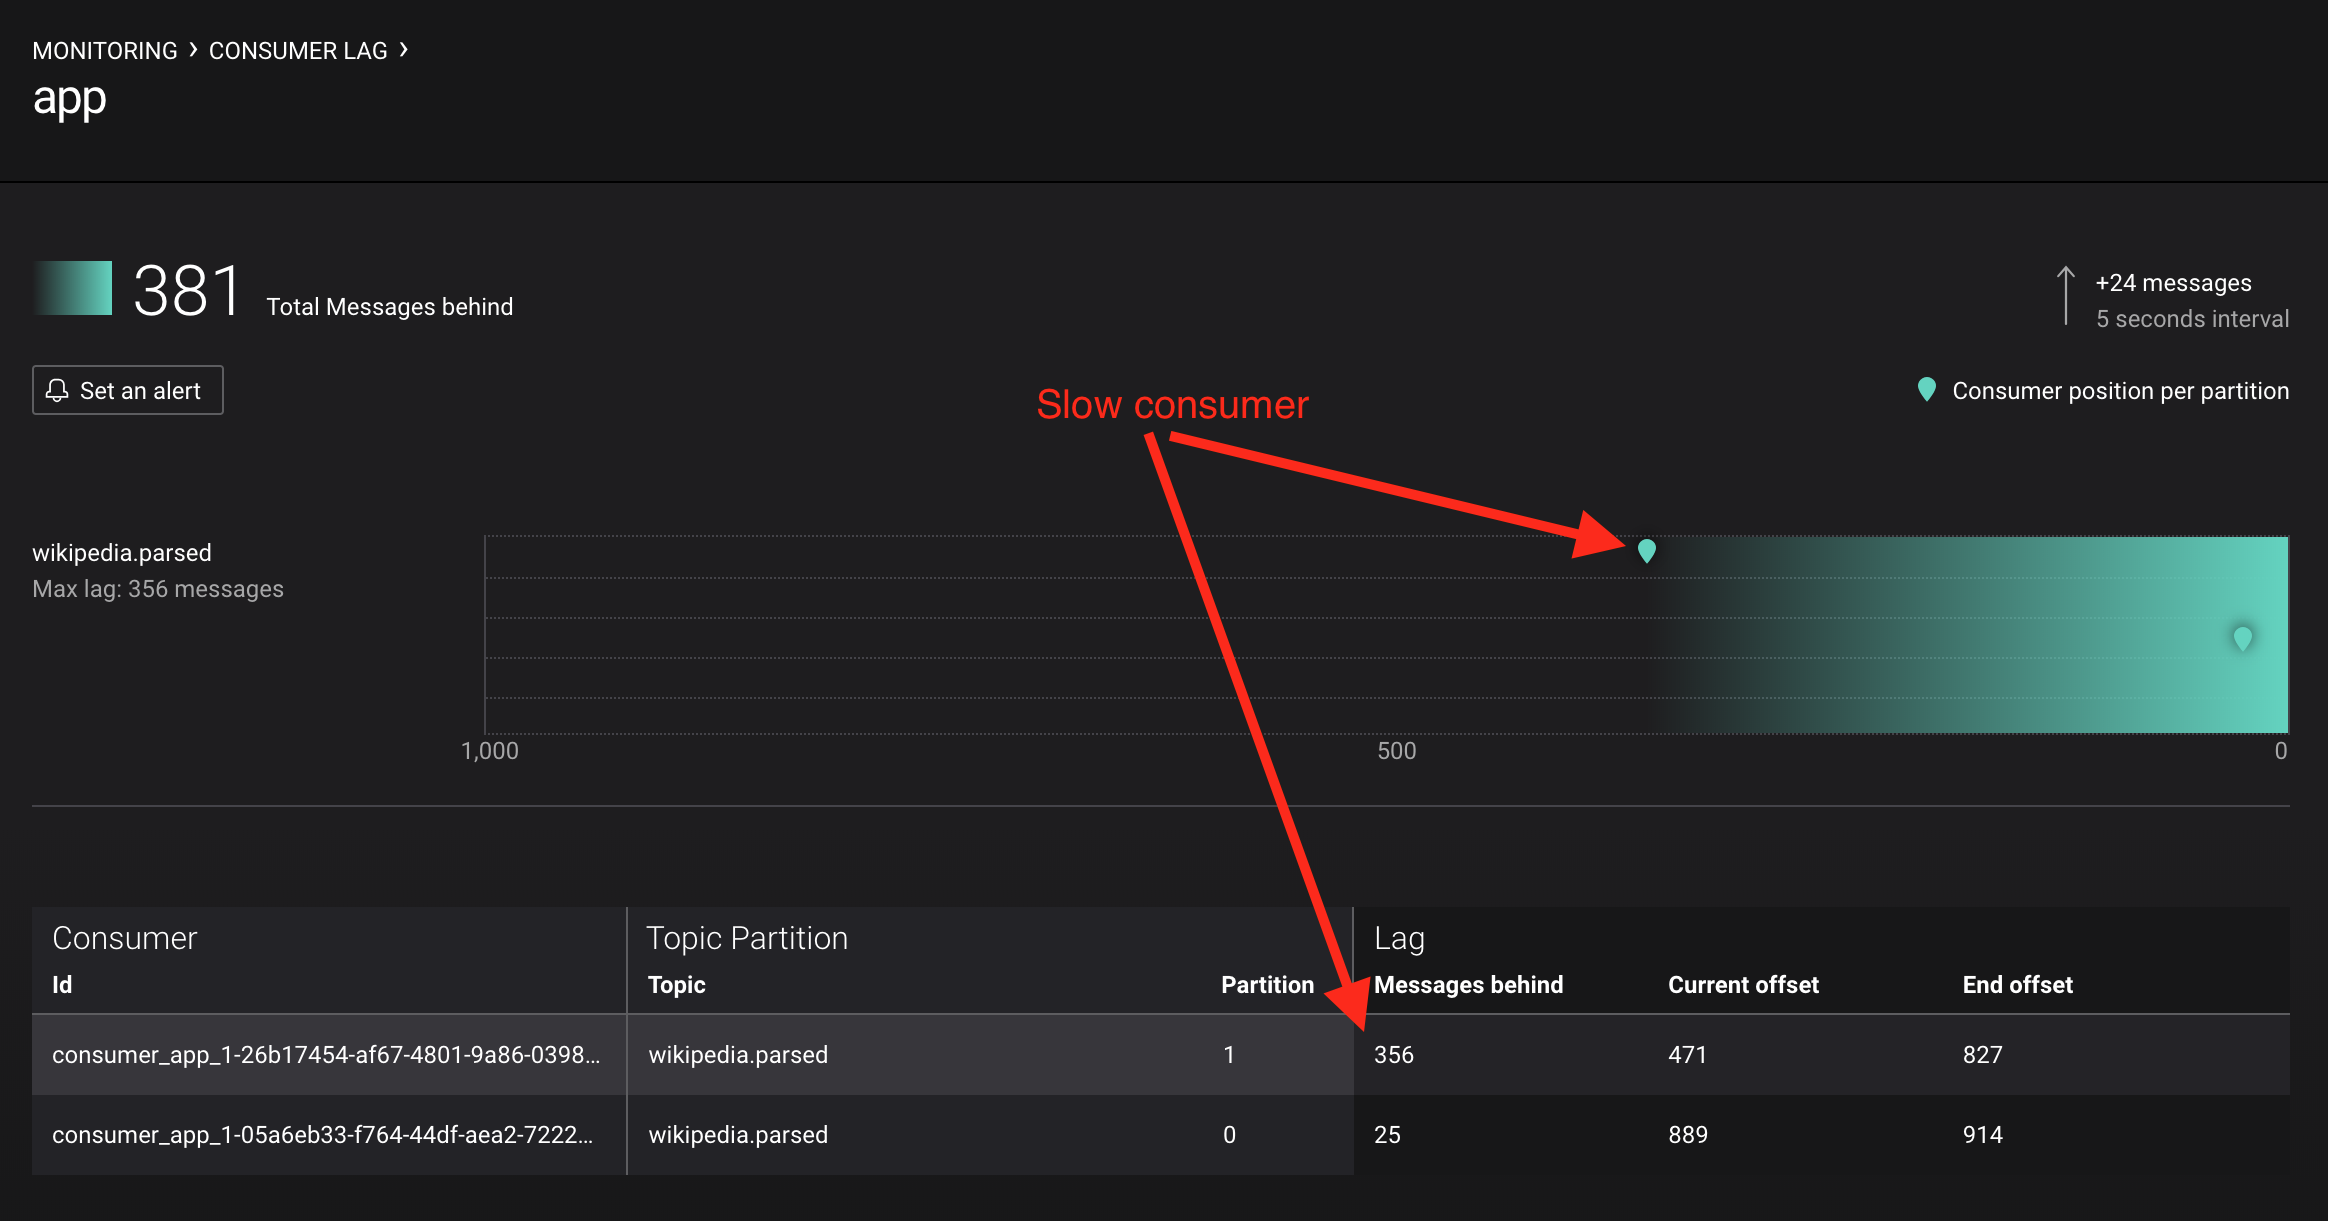
Remove the consumption quota for the consumer. Latency for
consumer_app_1recovers to steady state values../scripts/app/throttle_consumer.sh 1 delete
Over consumption
Follow along with the Demo 6: Over Consumption video.
Streams monitoring in Control Center can highlight consumers that are
over consuming some messages, which is an indication that consumers are
processing a set of messages more than once. This may happen
intentionally, for example an application with a software bug consumed
and processed Kafka messages incorrectly, got a fix, and then
reprocesses previous messages correctly. This may also happen
unintentionally if an application crashes before committing processed
messages. To simulate over consumption, we will use Kafka’s consumer
offset reset tool to set the offset of the consumer group app to an
earlier offset, thereby forcing the consumer group to reconsume messages
it has previously read.
Click on
Data streams, andView Detailsfor the consumer groupapp. Click on the blue circle on the consumption line on the left to verify there are two consumersconsumer_app_1andconsumer_app_2, that were created in an earlier section. If these two consumers are not running and were never started, start them as described in the section consumer rebalances.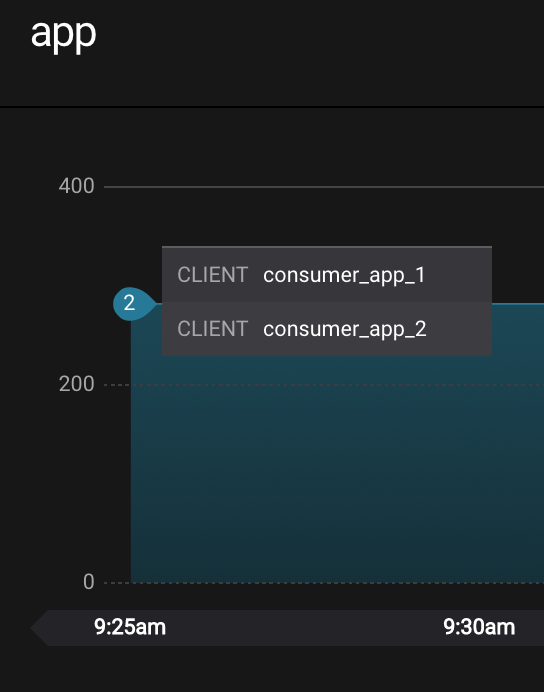
Let this consumer group run for 2 minutes until Control Center stream monitoring shows the consumer group
appwith steady consumption.Stop the consumer group
appto stop consuming from topicwikipedia.parsed. Note that the command below stops the consumers gracefully withkill -15, so the consumers follow the shutdown sequence../scripts/app/stop_consumer_app_group_graceful.sh
Wait for 2 minutes to let messages continue to be written to the topics for a while, without being consumed by the consumer group
app. Notice the red bar which highlights that during the time window when the consumer group was stopped, there were some messages produced but not consumed. These messages are not missing, they are just not consumed because the consumer group stopped.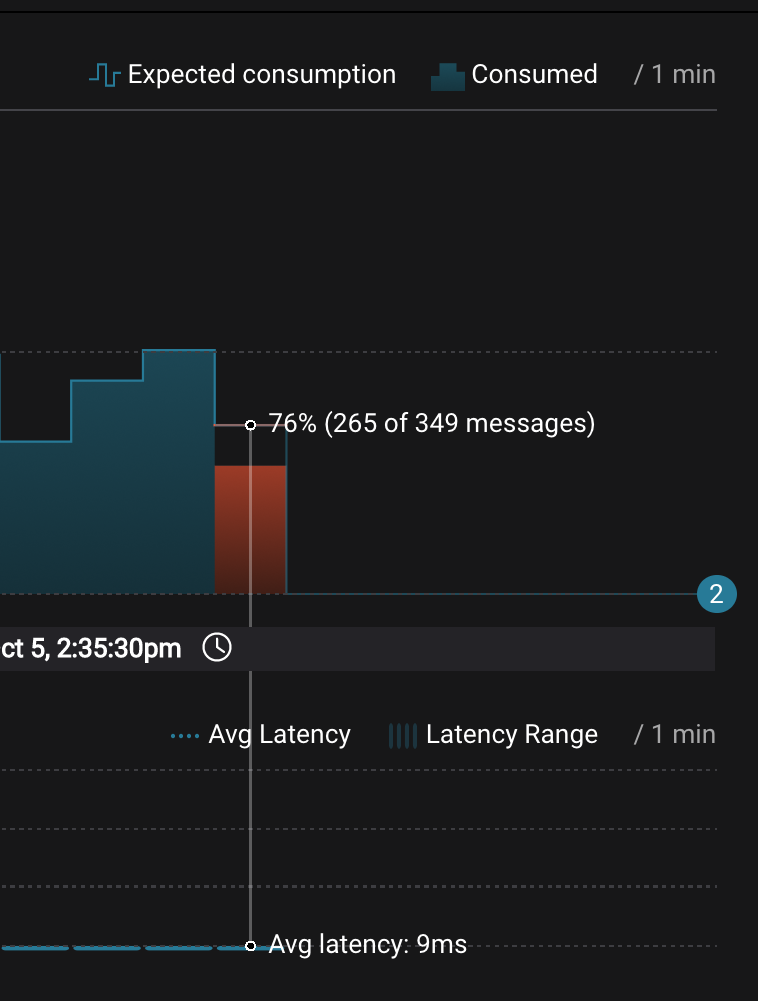
Reset the offset of the consumer group
appby shifting 200 offsets backwards. The offset reset tool must be run when the consumer is completely stopped. Offset values in output shown below will vary.docker-compose exec kafka1 kafka-consumer-groups \ --reset-offsets --group app --shift-by -200 --bootstrap-server kafka1:10091 \ --all-topics --execute
Your output should resemble:
TOPIC            PARTITION NEW-OFFSET
wikipedia.parsed 1         4071
wikipedia.parsed 0         7944
Restart consuming from topic
wikipedia.parsedwith the consumer groupappwith two consumers../scripts/app/start_consumer_app.sh 1 ./scripts/app/start_consumer_app.sh 2
Let this consumer group run for 2 minutes until Control Center stream monitoring shows the consumer group
appwith steady consumption. Notice several things:- Even though the consumer group
appwas not running for some of this time, all messages are shown as delivered. This is because all bars are time windows relative to produce timestamp. - For some time intervals, the the bars are red and consumption line is above expected consumption because some messages were consumed twice due to rewinding offsets.
- The latency peaks and then gradually decreases, because this is also relative to the produce timestamp.
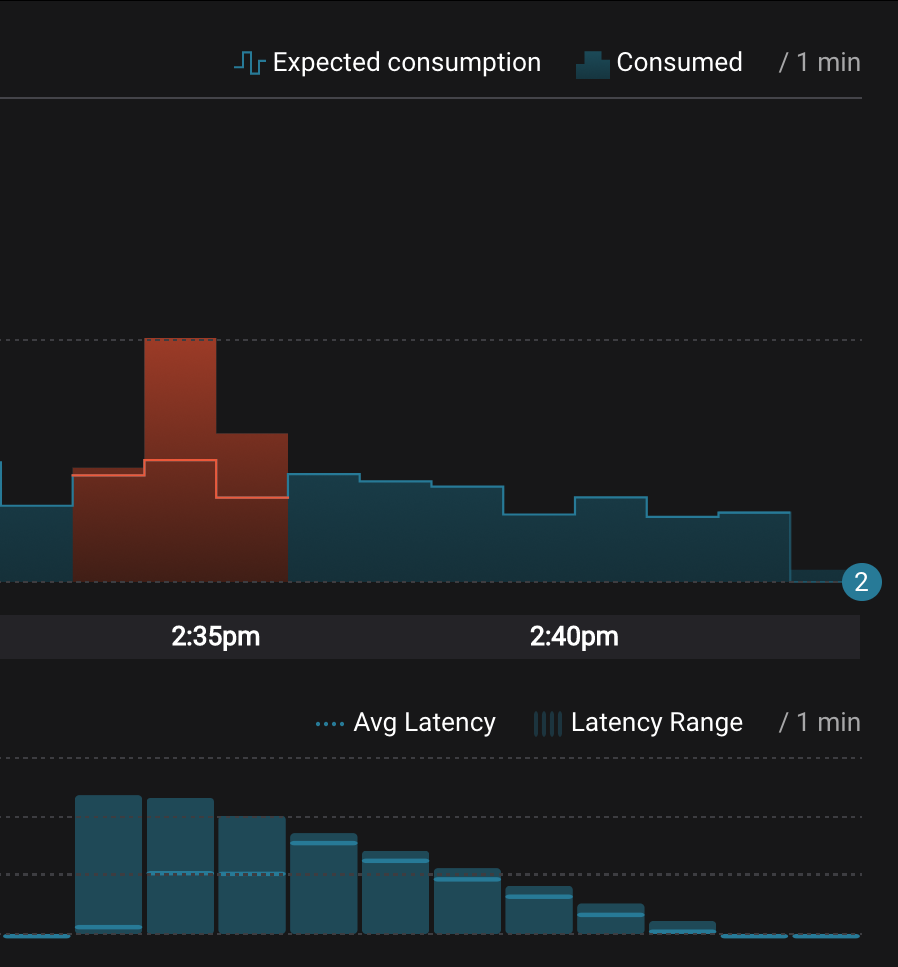
- Even though the consumer group
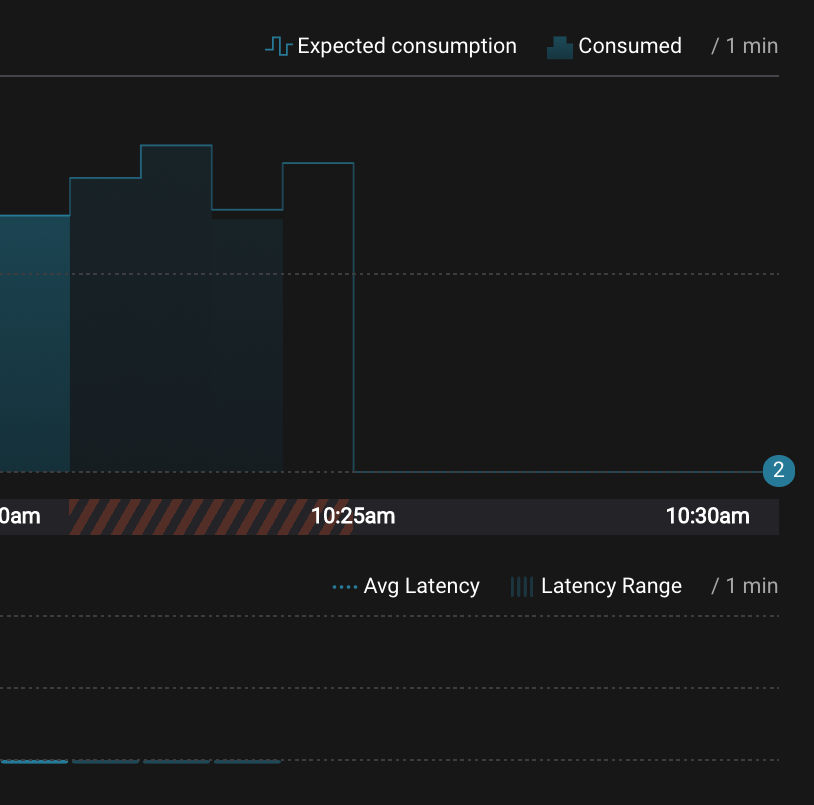
Under consumption
Follow along with the Demo 7: Under Consumption video.
Streams monitoring in Control Center can highlight consumers that are
under consuming some messages. This may happen intentionally when
consumers stop and restart and operators change the consumer offsets to
the latest offset. This avoids delay processing messages that were
produced while the consumers were stopped, especially when they care
about real-time. This may also happen unintentionally if a consumer is
offline for longer than the log retention period, or if a producer is
configured for acks=0 and a broker suddenly fails before having a
chance to replicate data to other brokers. To simulate under
consumption, we will use Kafka’s consumer offset reset tool to set the
offset of the consumer group app to the latest offset, thereby
skipping messages that will never be read.
Click on Data Streams, and
View Detailsfor the consumer groupapp. Click on the blue circle on the consumption line on the left to verify there are two consumersconsumer_app_1andconsumer_app_2, that were created in an earlier section. If these two consumers are not running and were never started, start them as described in the section consumer rebalances.
Let this consumer group run for 2 minutes until Control Center stream monitoring shows the consumer group
appwith steady consumption.Stop the consumer group
appto stop consuming from topicwikipedia.parsed. Note that the command below stops the consumers ungracefully withkill -9, so the consumers did not follow the shutdown sequence../scripts/app/stop_consumer_app_group_ungraceful.sh
Wait for 2 minutes to let messages continue to be written to the topics for a while, without being consumed by the consumer group
app. Notice the red bar which highlights that during the time window when the consumer group was stopped, there were some messages produced but not consumed. These messages are not missing, they are just not consumed because the consumer group stopped.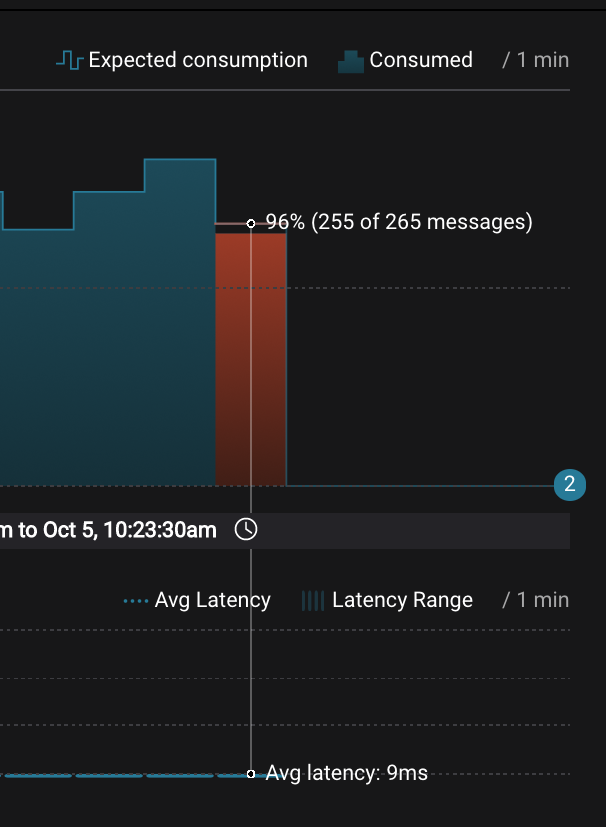
Wait for another few minutes and notice that the bar graph changes and there is a herringbone pattern to indicate that perhaps the consumer group stopped ungracefully.
Reset the offset of the consumer group
appby setting it to latest offset. The offset reset tool must be run when the consumer is completely stopped. Offset values in output shown below will vary.docker-compose exec kafka1 kafka-consumer-groups \ --reset-offsets --group app --to-latest --bootstrap-server kafka1:10091 \ --all-topics --execute
Your output should resemble:
TOPIC            PARTITION NEW-OFFSET
wikipedia.parsed 1         8601
wikipedia.parsed 0         15135
Restart consuming from topic
wikipedia.parsedwith the consumer groupappwith two consumers../scripts/app/start_consumer_app.sh 1 ./scripts/app/start_consumer_app.sh 2
Let this consumer group run for 2 minutes until Control Center stream monitoring shows the consumer group
appwith steady consumption. Notice that during the time period that the consumer groupappwas not running, no produced messages are shown as delivered.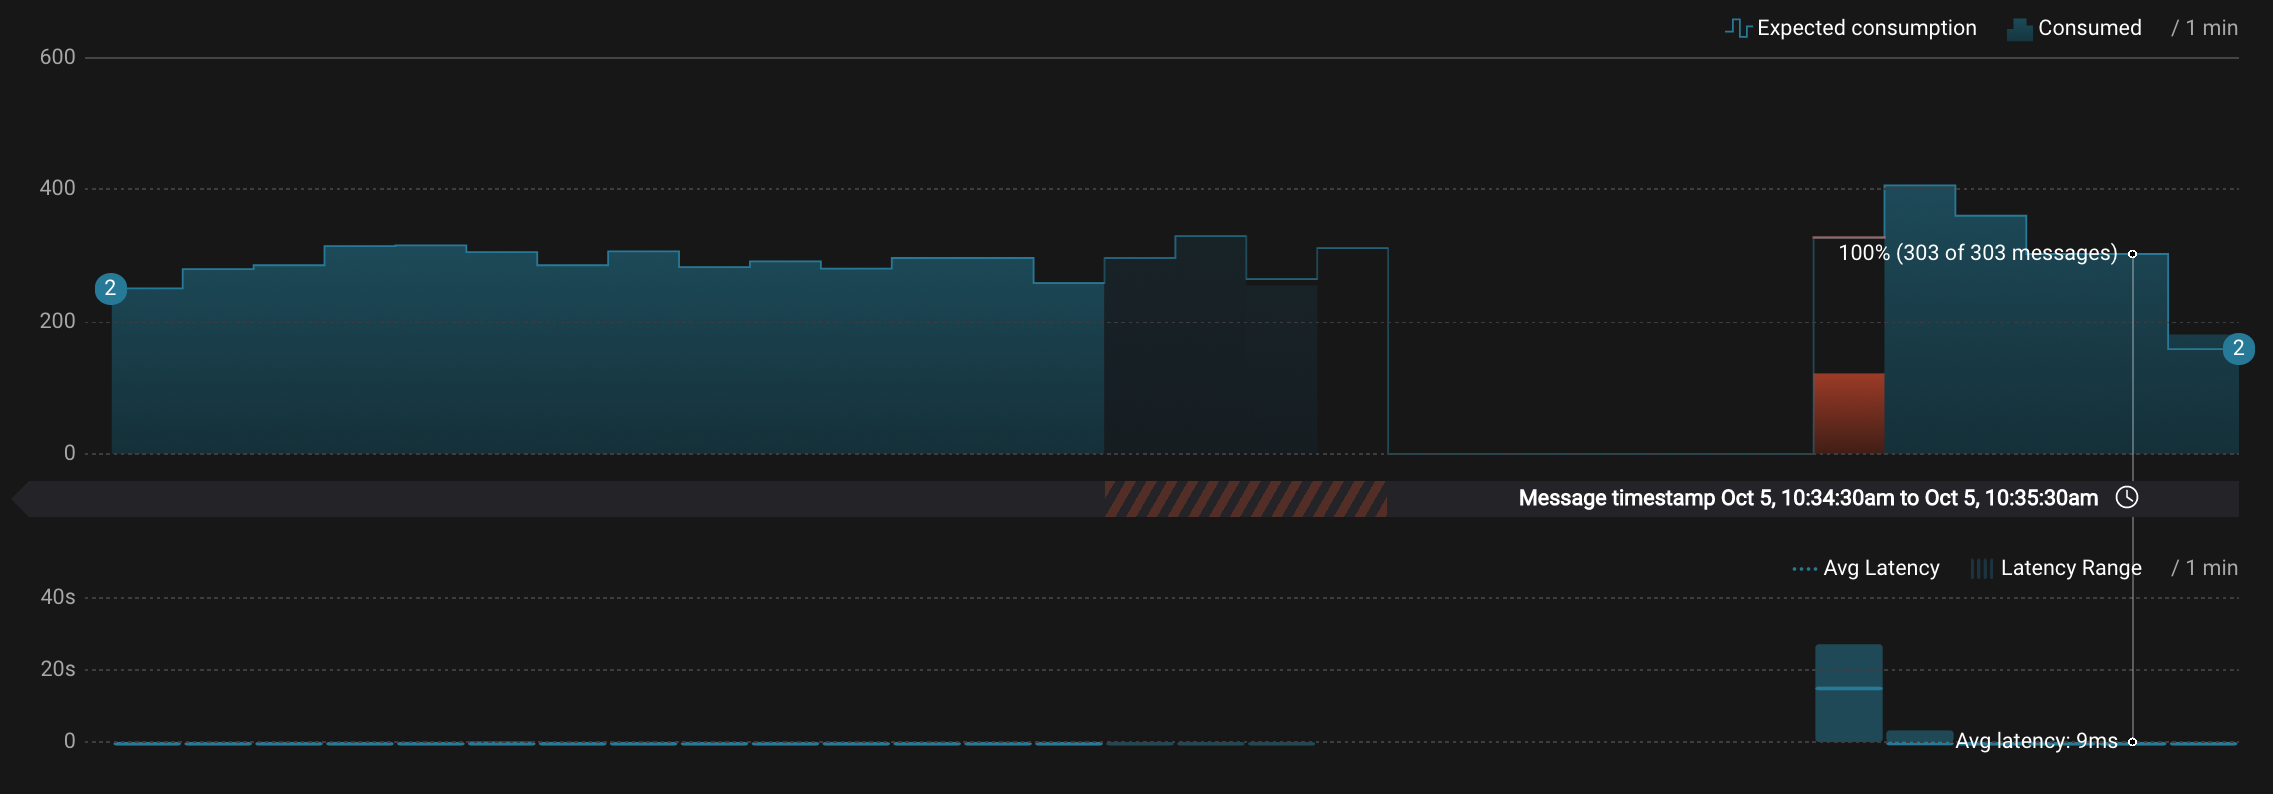
Failed broker
Follow along with the Demo 8: Failed Broker video.
To simulate a failed broker, stop the Docker container running one of the two Kafka brokers.
Stop the Docker container running Kafka broker 2.
docker-compose stop kafka2
After a few minutes, observe the System Health shows the broker count has gone down from 2 to 1, and there are many under replicated partitions.
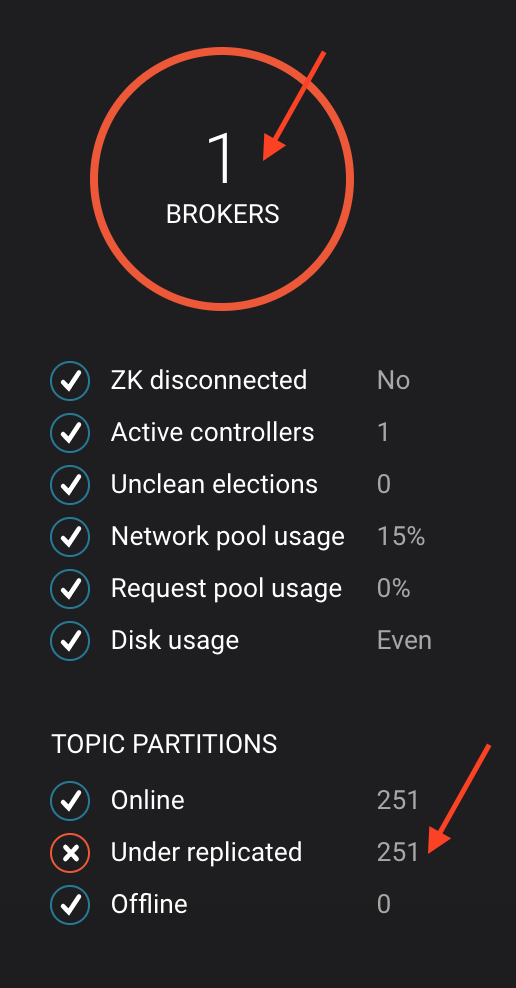
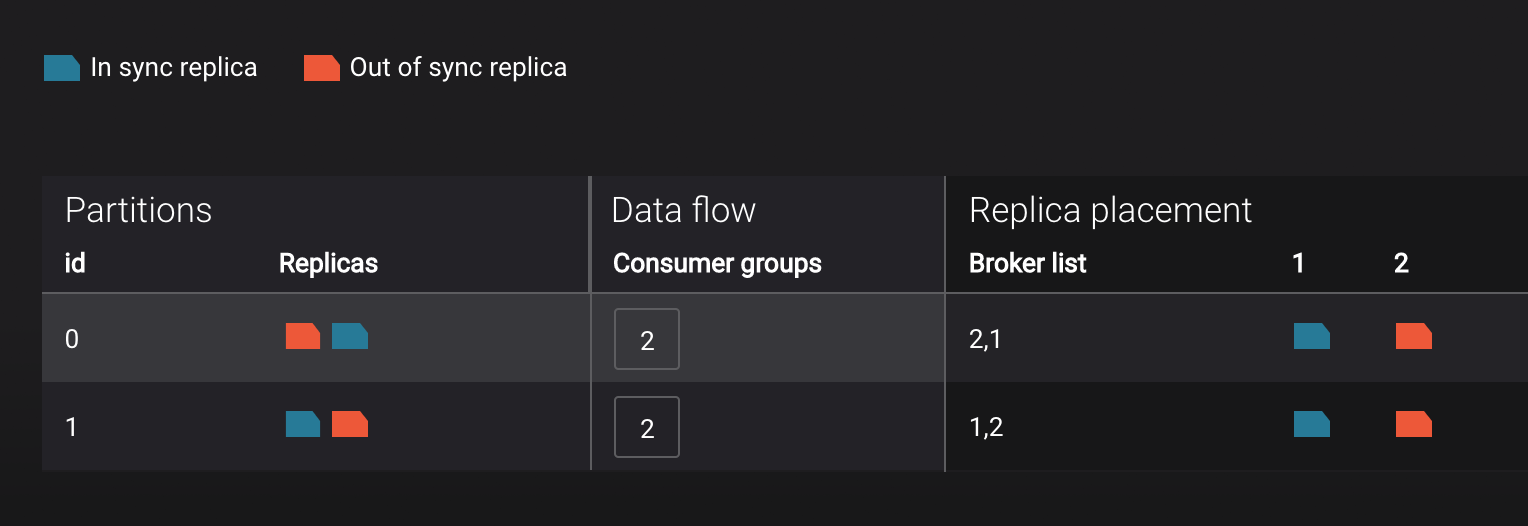
View topic details to see that there are out of sync replicas on broker 2.
Restart the Docker container running Kafka broker 2.
docker-compose start kafka2
After about a minute, observe the System Health view in Confluent Control Center. The broker count has recovered to 2, and the topic partitions are back to reporting no under replicated partitions.
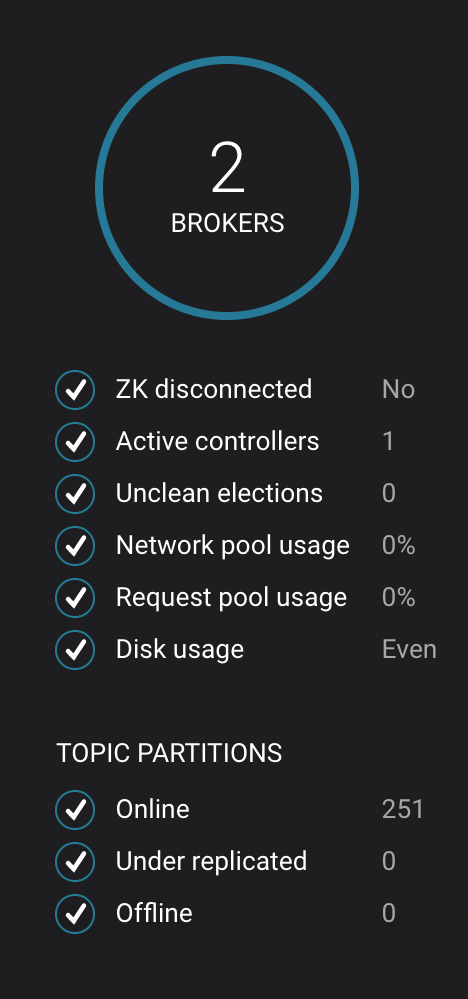
Click on the broker count
2inside the circle to view when the broker counts changed.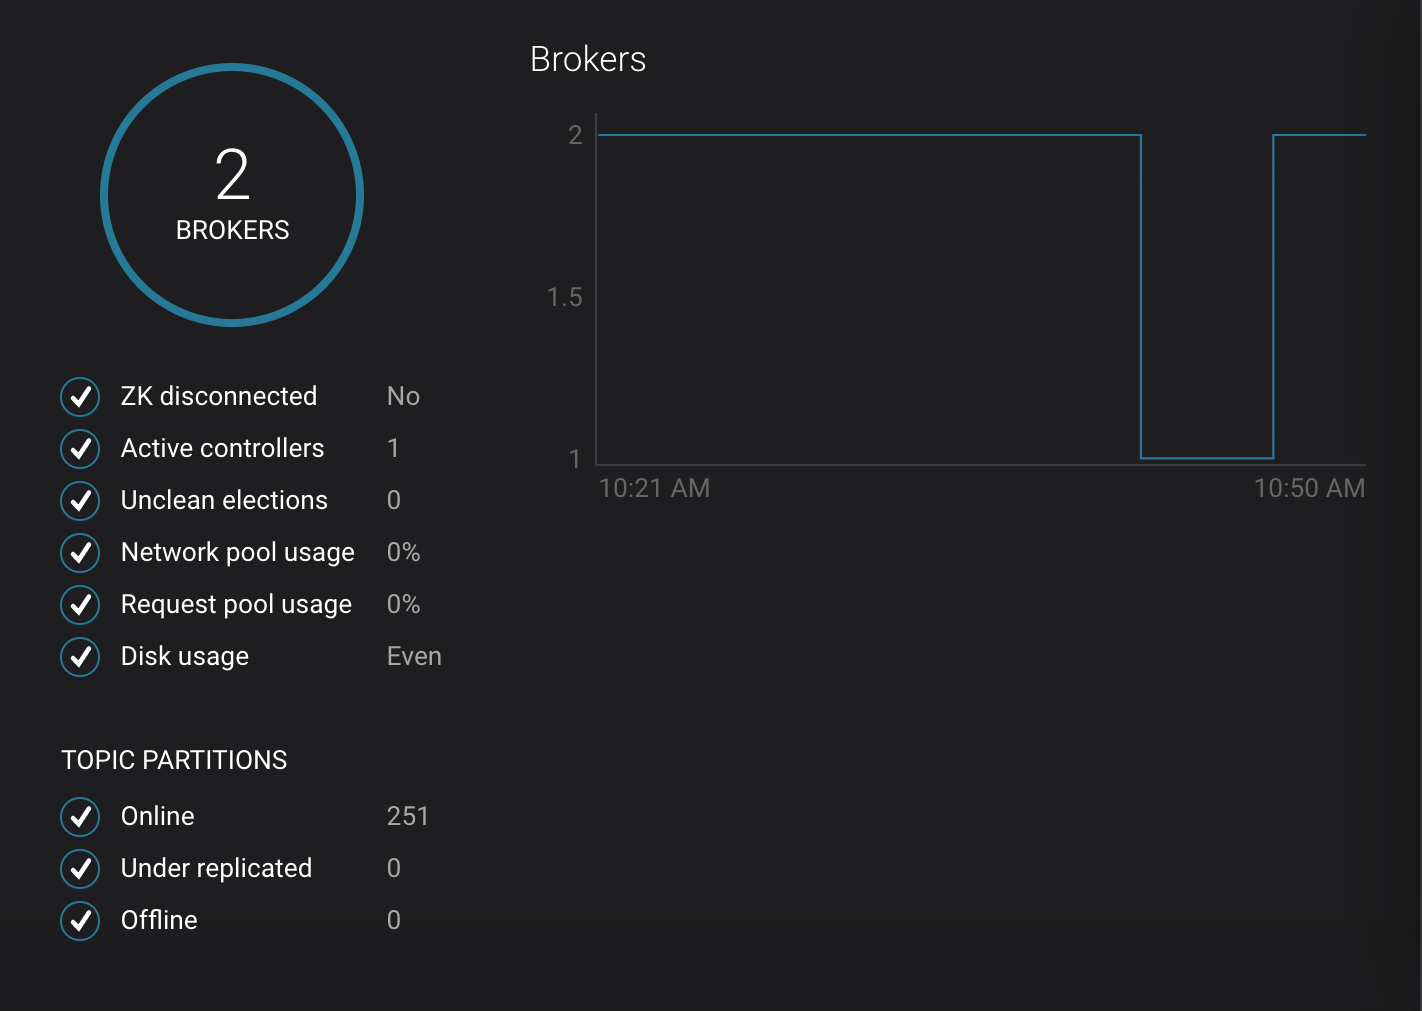
Alerting
Follow along with the Demo 9: Alerting video.
There are many types of Control Center alerts and many ways to configure them. Use the Alerts management page to define triggers and actions, or click on a streams monitoring graph for consumer groups or topics to setup alerts from there.
This demo already has pre-configured triggers and actions. View the Alerts
Triggersscreen, and clickEditagainst each trigger to see configuration details.- The trigger
Under Replicated Partitionshappens when a broker reports non-zero under replicated partitions, and it causes an actionEmail Administrator. - The trigger
Consumption Differencehappens when consumption difference for the Elasticsearch connector consumer group is greater than0, and it causes an actionEmail Administrator.
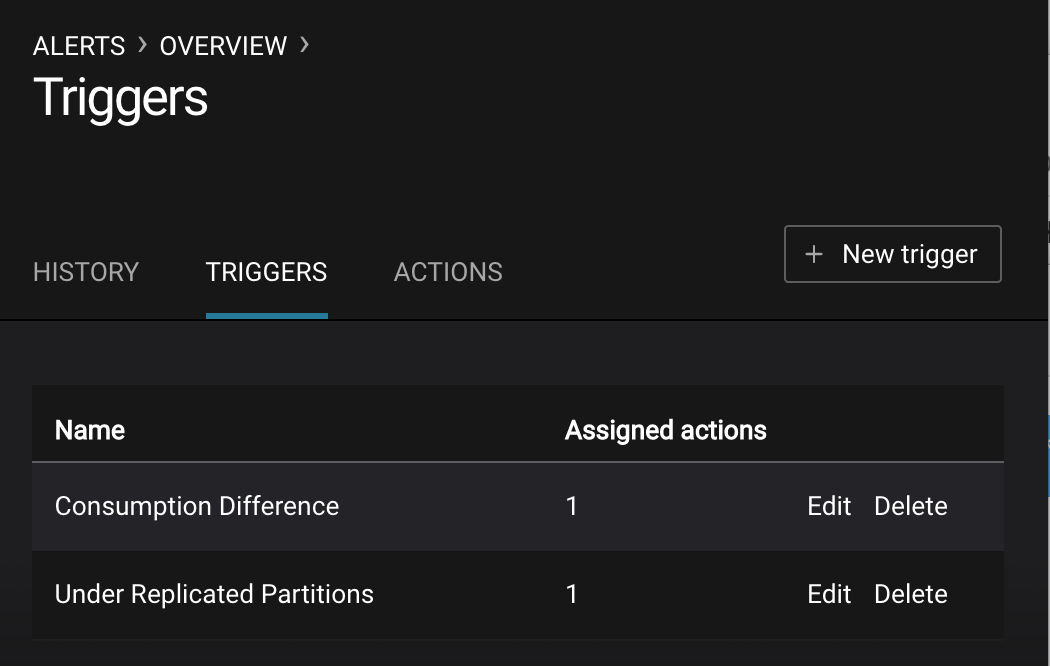
- The trigger
If you followed the steps in the failed broker section, view the Alert history to see that the trigger
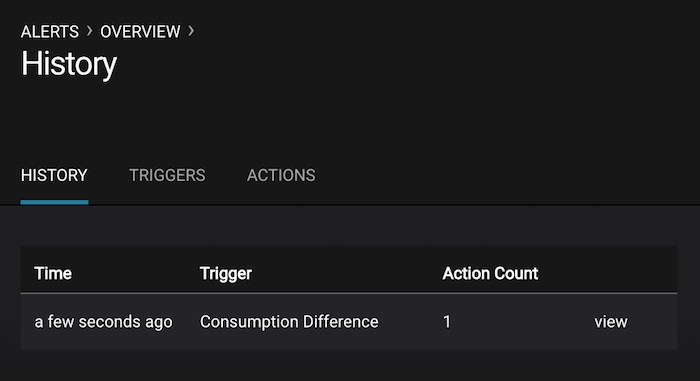
Under Replicated Partitionshappened and caused an alert when you stopped broker 2.You can also trigger the
Consumption Differencetrigger. In the Kafka Connect -> Sinks screen, edit the running Elasticsearch sink connector.In the Kafka Connect view, pause the Elasticsearch sink connector by pressing the pause icon in the top right. This will stop consumption for the related consumer group.

View the Alert history to see that this trigger happened and caused an alert.
Replicator
Confluent Replicator copies data from a source Kafka cluster to a destination Kafka cluster. The source and destination clusters are typically different clusters, but in this demo, Replicator is doing intra-cluster replication, i.e., the source and destination Kafka clusters are the same. As with the rest of the components in the solution, Confluent Replicator is also configured with security.
MONITORING –> Data Streams –> Message Delivery: monitor throughput and latency of Confluent Replicator in the Data streams monitoring view. Replicator is a Kafka Connect source connector and has a corresponding consumer group
connect-replicator.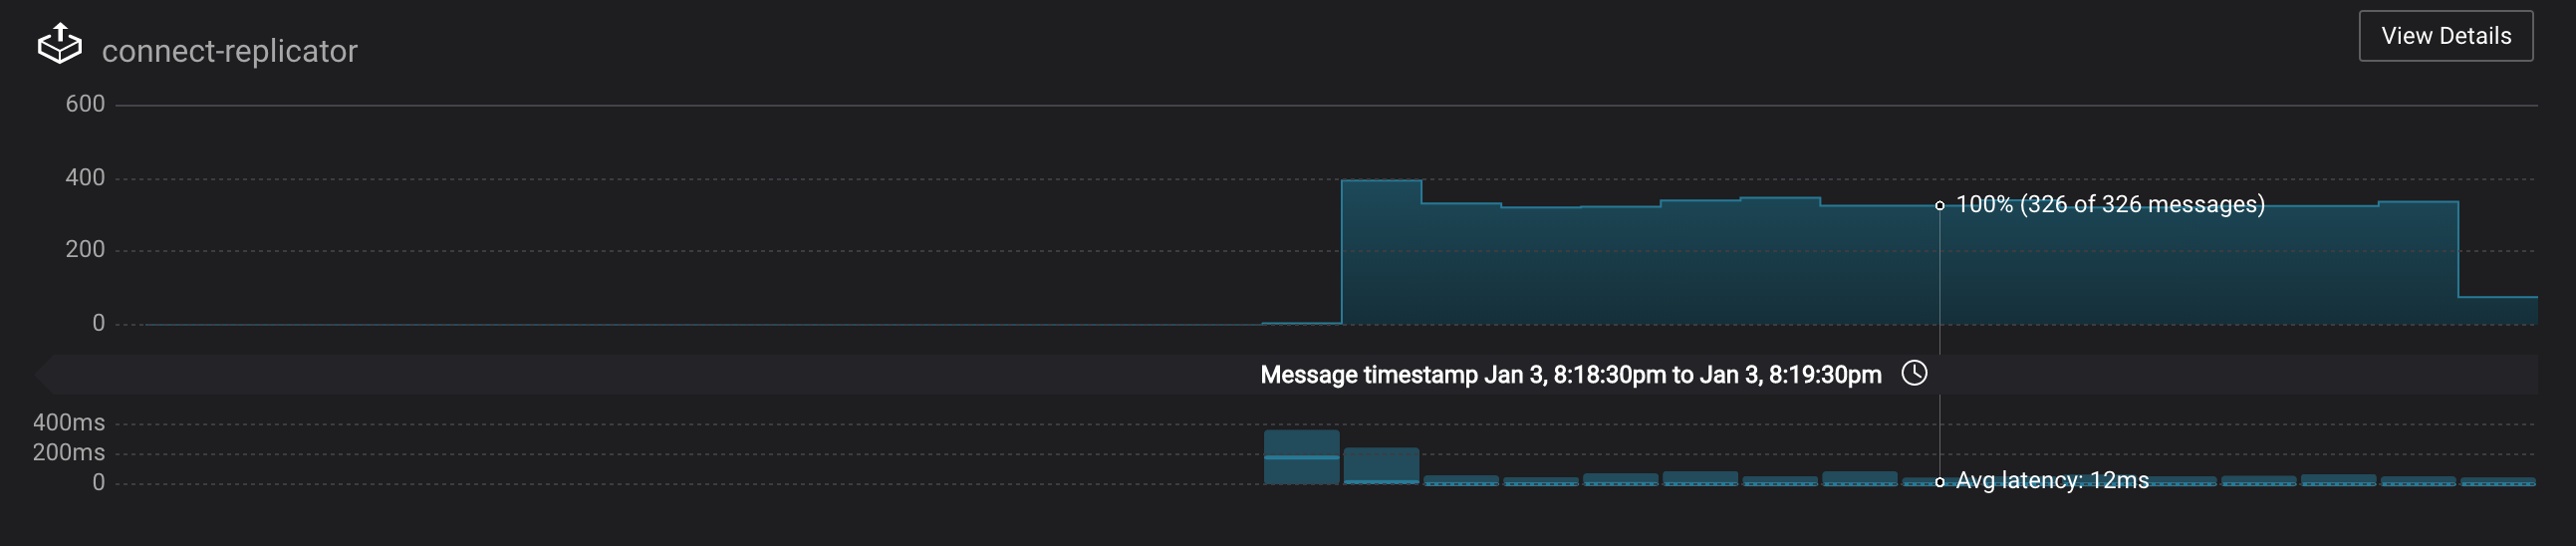
MANAGEMENT –> Topics: scroll down to view the topics called
wikipedia.parsed(Replicator is consuming data from this topic) andwikipedia.parsed.replica(Replicator automatically created this topic and is copying data to it). Click onConsumer Groupsfor the topicwikipedia.parsedand observe that one of the consumer groups is calledconnect-replicator.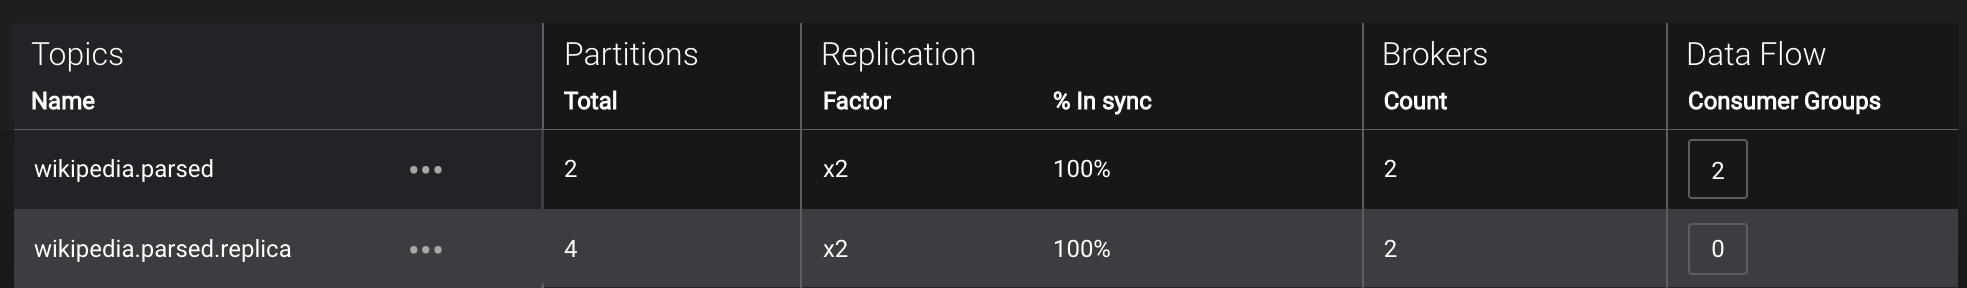
MANAGEMENT –> Kafka Connect: pause the Replicator connector by pressing the pause icon in the top right. This will stop consumption for the related consumer group.
Observe that the
connect-replicatorconsumer group has stopped consumption.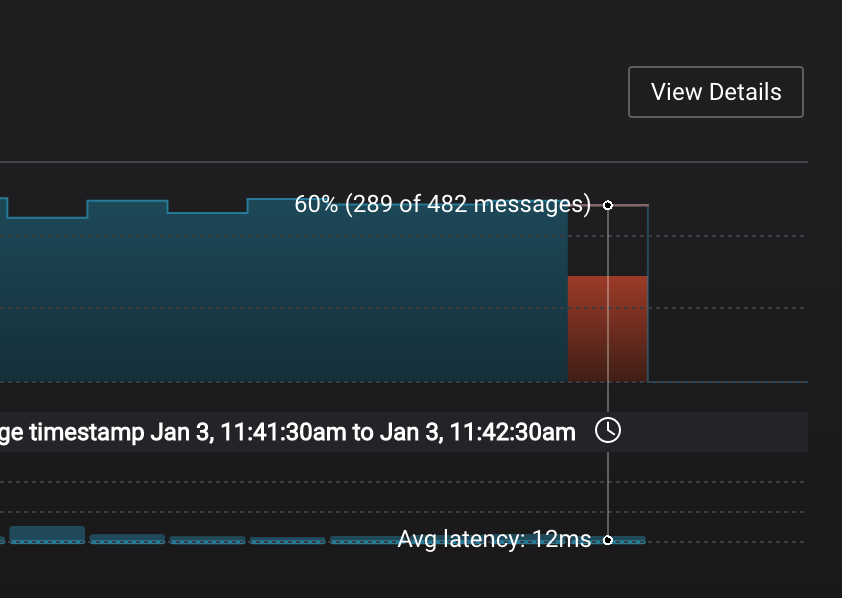
Restart the Replicator connector.
Observe that the
connect-replicatorconsumer group has resumed consumption. Notice several things:- Even though the consumer group connect-replicator was not running for some of this time, all messages are shown as delivered. This is because all bars are time windows relative to produce timestamp.
- The latency peaks and then gradually decreases, because this is also relative to the produce timestamp.
Security
Follow along with the Security video.
All the components in this demo are enabled with many security features:
- SSL for encryption, except for ZooKeeper which does not support SSL
- SASL/PLAIN for authentication, except for ZooKeeper which is configured for SASL/DIGEST-MD5
- Authorization. If a resource has no associated ACLs, then users are not allowed to access the resource, except super users
- HTTPS for Control Center
- HTTPS for Schema Registry
- HTTPS for Connect
Note
This demo showcases a secure Confluent Platform for educational purposes and is not meant to be complete best practices. There are certain differences between what is shown in the demo and what you should do in production:
- Each component should have its own username, instead of authenticating all users as
client - Authorize users only for operations that they need, instead of making all of them super users
- If the
PLAINTEXTsecurity protocol is used, theseANONYMOUSusernames should not be configured as super users - Consider not even opening the
PLAINTEXTport ifSSLorSASL_SSLare configured
Encryption & Authentication
Each broker has four listener ports:
- PLAINTEXT port called
PLAINTEXTfor users with no security enabled - SSL port port called
SSLfor users with just SSL without SASL - SASL_SSL port called
SASL_SSLfor communication between services inside Docker containers - SASL_SSL port called
SASL_SSL_HOSTfor communication between any potential services outside of Docker that communicate to the Docker containers
| port | kafka1 | kafka2 |
|---|---|---|
| PLAINTEXT | 10091 | 10092 |
| SSL | 11091 | 11092 |
| SASL_SSL | 9091 | 9092 |
| SASL_SSL_HOST | 29091 | 29092 |
Authorization
All the brokers in this demo authenticate as broker, and all other
services authenticate as their respective names. Per the broker configuration
parameter super.users, as it is set in this demo, the only users
that can communicate with the cluster are those that authenticate as
broker, schemaregistry, client, restproxy, client, or users
that connect via the PLAINTEXT port (their username is ANONYMOUS).
All other users are not authorized to communicate with the cluster.
Verify the ports on which the Kafka brokers are listening with the following command, and they should match the table shown below:
docker-compose logs kafka1 | grep "Registered broker 1"
docker-compose logs kafka2 | grep "Registered broker 2"
This demo automatically generates simple SSL certificates and creates keystores, truststores, and secures them with a password. To communicate with the brokers, Kafka clients may use any of the ports on which the brokers are listening. To use a security-enabled port, they must specify security parameters for keystores, truststores, password, or authentication so the Kafka command line client tools pass the security configuration file with interceptors or without interceptors with these security parameters. As an example, to communicate with the Kafka cluster to view all the active consumer groups:
Communicate with brokers via the PLAINTEXT port
# PLAINTEXT port
  docker-compose exec kafka1 kafka-consumer-groups --list --bootstrap-server kafka1:10091
Communicate with brokers via the SASL_SSL port, and SASL_SSL parameters configured via the
--command-configargument for command line tools or--consumer.configfor kafka-console-consumer.# SASL_SSL port with SASL_SSL parameters docker-compose exec kafka1 kafka-consumer-groups --list --bootstrap-server kafka1:9091 \ --command-config /etc/kafka/secrets/client_without_interceptors.config
If you try to communicate with brokers via the SASL_SSL port but don’t specify the SASL_SSL parameters, it will fail
# SASL_SSL port without SASL_SSL parameters
  docker-compose exec kafka1 kafka-consumer-groups --list --bootstrap-server kafka1:9091
Your output should resemble:
Error: Executing consumer group command failed due to Request METADATA failed on brokers List(kafka1:9091 (id: -1 rack: null))
Verify which authenticated users are configured to be super users.
docker-compose logs kafka1 | grep SUPER_USERSYour output should resemble the following. Notice this authorizes each service name which authenticates as itself, as well as the unauthenticated
PLAINTEXTwhich authenticates asANONYMOUS(for demo purposes only):KAFKA_SUPER_USERS=User:client;User:schemaregistry;User:restproxy;User:broker;User:connect;User:ANONYMOUS
Verify that a user
clientwhich authenticates via SASL can consume messages from topicwikipedia.parsed:./scripts/consumers/listen_wikipedia.parsed.sh SASL
Verify that a user which authenticates via SSL cannot consume messages from topic
wikipedia.parsed. It should fail with an exception../scripts/consumers/listen_wikipedia.parsed.sh SSL
Your output should resemble:
[2018-01-12 21:13:18,481] ERROR Unknown error when running consumer: (kafka.tools.ConsoleConsumer$)
org.apache.kafka.common.errors.TopicAuthorizationException: Not authorized to access topics: [wikipedia.parsed]
Verify that the broker’s Authorizer logger logs the denial event. As shown in the log message, the user which authenticates via SSL has a username
CN=client,OU=TEST,O=CONFLUENT,L=PaloAlto,ST=Ca,C=US, not justclient.# Authorizer logger logs the denied operation docker-compose logs kafka1 | grep kafka.authorizer.logger
Your output should resemble:
[2018-01-12 21:13:18,454] INFO Principal = User:CN=client,OU=TEST,O=CONFLUENT,L=PaloAlto,ST=Ca,C=US is Denied Operation = Describe from host = 172.23.0.7 on resource = Topic:wikipedia.parsed (kafka.authorizer.logger) [2018-01-12
21:13:18,464] INFO Principal = User:CN=client,OU=TEST,O=CONFLUENT,L=PaloAlto,ST=Ca,C=US is Denied Operation = Describe from host = 172.23.0.7 on resource = Group:test (kafka.authorizer.logger)
Add an ACL that authorizes user
CN=client,OU=TEST,O=CONFLUENT,L=PaloAlto,ST=Ca,C=US, and then view the updated ACL configuration.docker-compose exec kafka1 /usr/bin/kafka-acls \ --authorizer-properties zookeeper.connect=zookeeper:2181 \ --add --topic wikipedia.parsed \ --allow-principal User:CN=client,OU=TEST,O=CONFLUENT,L=PaloAlto,ST=Ca,C=US \ --operation Read --group test docker-compose exec kafka1 /usr/bin/kafka-acls \ --authorizer-properties zookeeper.connect=zookeeper:2181 \ --list --topic wikipedia.parsed --group test
Your output should resemble:
Current ACLs for resource ``Topic:wikipedia.parsed``:
User:CN=client,OU=TEST,O=CONFLUENT,L=PaloAlto,ST=Ca,C=US has Allow permission for operations: Read from hosts: \*

Current ACLs for resource ``Group:test``:
User:CN=client,OU=TEST,O=CONFLUENT,L=PaloAlto,ST=Ca,C=US has Allow permission for operations: Read from hosts: \*
Verify that the user which authenticates via SSL is now authorized and can successfully consume some messages from topic
wikipedia.parsed../scripts/consumers/listen_wikipedia.parsed.sh SSL
Because ZooKeeper is configured for SASL/DIGEST-MD5, any commands that communicate with ZooKeeper need properties set for ZooKeeper authentication. This authentication configuration is provided by the
KAFKA_OPTSsetting on the brokers. For example, notice that the throttle script runs on the Docker containerkafka1which has the appropriate KAFKA_OPTS setting. The command would otherwise fail if run on any other container aside fromkafka1orkafka2.
Schema Registry and REST Proxy
The connectors used in this demo are configured to automatically read and write Avro-formatted data, leveraging the Confluent Schema Registry . The Confluent REST Proxy is running for optional client access.
View the Schema Registry subjects for topics that have registered schemas for their keys and/or values. Notice the security arguments passed into the
curlcommand which are required to interact with Schema Registry, which is listening for HTTPS on port 8085.docker-compose exec schemaregistry curl -X GET --cert /etc/kafka/secrets/schemaregistry.certificate.pem --key /etc/kafka/secrets/schemaregistry.key --tlsv1.2 --cacert /etc/kafka/secrets/snakeoil-ca-1.crt https://schemaregistry:8085/subjects | jq . [ "ksql_query_CTAS_EN_WIKIPEDIA_GT_1-KSQL_Agg_Query_1526914100640-changelog-value", "ksql_query_CTAS_EN_WIKIPEDIA_GT_1-KSQL_Agg_Query_1526914100640-repartition-value", "EN_WIKIPEDIA_GT_1_COUNTS-value", "WIKIPEDIABOT-value", "EN_WIKIPEDIA_GT_1-value", "WIKIPEDIANOBOT-value", "wikipedia.parsed-value" ]
Register a new Avro schema (a record with two fields
usernameanduserid) into Schema Registry for the value of a new topicusers. Note the schema id that it returns, e.g. below schema id is6.docker-compose exec schemaregistry curl -X POST -H "Content-Type: application/vnd.schemaregistry.v1+json" --cert /etc/kafka/secrets/schemaregistry.certificate.pem --key /etc/kafka/secrets/schemaregistry.key --tlsv1.2 --cacert /etc/kafka/secrets/snakeoil-ca-1.crt --data '{ "schema": "[ { \"type\":\"record\", \"name\":\"user\", \"fields\": [ {\"name\":\"userid\",\"type\":\"long\"}, {\"name\":\"username\",\"type\":\"string\"} ]} ]" }' https://schemaregistry:8085/subjects/users-value/versions | jq . { "id": 6 }
View the new schema for the subject
users-value. From Confluent Control Center, click MANAGEMENT -> Topics. Scroll down to and click on the topic users and select “SCHEMA”.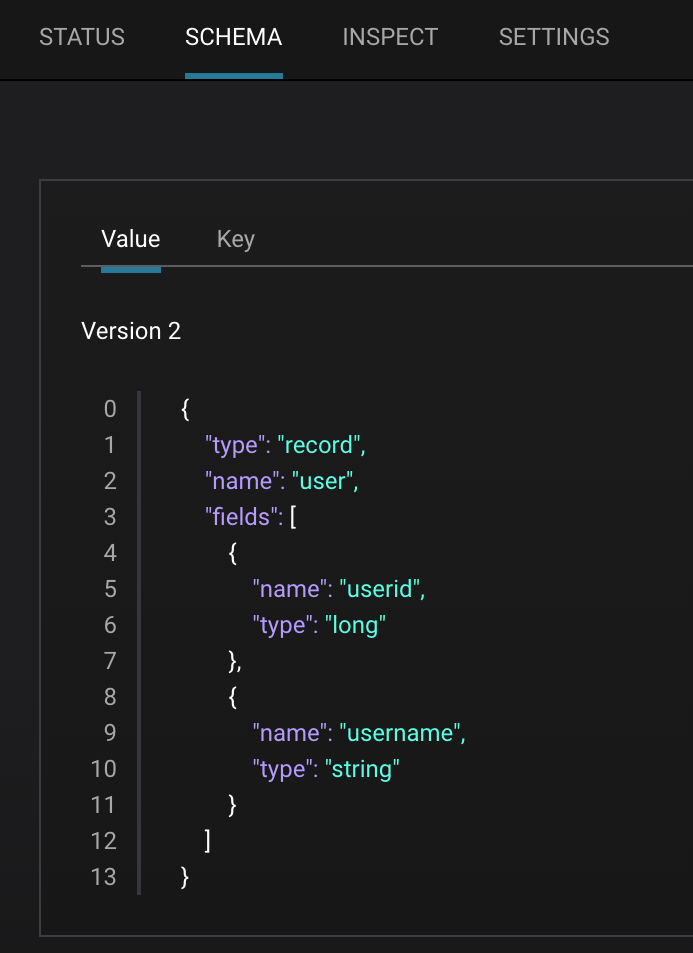
You may alternatively request the schema via the command line:
  docker-compose exec schemaregistry curl -X GET --cert /etc/kafka/secrets/schemaregistry.certificate.pem --key /etc/kafka/secrets/schemaregistry.key --tlsv1.2 --cacert /etc/kafka/secrets/snakeoil-ca-1.crt https://schemaregistry:8085/subjects/users-value/versions/1 | jq .

{
  "subject": "users-value",
  "version": 1,
  "id": 6,
  "schema": "{\"type\":\"record\",\"name\":\"user\",\"fields\":[{\"name\":\"username\",\"type\":\"string\"},{\"name\":\"userid\",\"type\":\"long\"}]}"
}
Use the REST Proxy, which is listening for HTTPS on port 8086, to produce a message to the topic
users, referencing schema id6.docker-compose exec restproxy curl -X POST -H "Content-Type: application/vnd.kafka.avro.v2+json" -H "Accept: application/vnd.kafka.v2+json" --cert /etc/kafka/secrets/restproxy.certificate.pem --key /etc/kafka/secrets/restproxy.key --tlsv1.2 --cacert /etc/kafka/secrets/snakeoil-ca-1.crt --data '{"value_schema_id": 6, "records": [{"value": {"user":{"userid": 1, "username": "Bunny Smith"}}}]}' https://restproxy:8086/topics/users {"offsets":[{"partition":1,"offset":0,"error_code":null,"error":null}],"key_schema_id":null,"value_schema_id":6}
Use the REST Proxy to consume the above message from the topic
users. This is a series of steps.# 5.1 Create consumer instance my_avro_consumer docker-compose exec restproxy curl -X POST -H "Content-Type: application/vnd.kafka.v2+json" --cert /etc/kafka/secrets/restproxy.certificate.pem --key /etc/kafka/secrets/restproxy.key --tlsv1.2 --cacert /etc/kafka/secrets/snakeoil-ca-1.crt --data '{"name": "my_consumer_instance", "format": "avro", "auto.offset.reset": "earliest"}' https://restproxy:8086/consumers/my_avro_consumer # 5.2 Subscribe my_avro_consumer to the `users` topic docker-compose exec restproxy curl -X POST -H "Content-Type: application/vnd.kafka.v2+json" --cert /etc/kafka/secrets/restproxy.certificate.pem --key /etc/kafka/secrets/restproxy.key --tlsv1.2 --cacert /etc/kafka/secrets/snakeoil-ca-1.crt --data '{"topics":["users"]}' https://restproxy:8086/consumers/my_avro_consumer/instances/my_consumer_instance/subscription # 5.3 Get messages for my_avro_consumer subscriptions # Note: Issue this command twice due to https://github.com/confluentinc/kafka-rest/issues/432 docker-compose exec restproxy curl -X GET -H "Accept: application/vnd.kafka.avro.v2+json" --cert /etc/kafka/secrets/restproxy.certificate.pem --key /etc/kafka/secrets/restproxy.key --tlsv1.2 --cacert /etc/kafka/secrets/snakeoil-ca-1.crt https://restproxy:8086/consumers/my_avro_consumer/instances/my_consumer_instance/records # 5.4 Delete the consumer instance my_avro_consumer docker-compose exec restproxy curl -X DELETE -H "Content-Type: application/vnd.kafka.v2+json" --cert /etc/kafka/secrets/restproxy.certificate.pem --key /etc/kafka/secrets/restproxy.key --tlsv1.2 --cacert /etc/kafka/secrets/snakeoil-ca-1.crt https://restproxy:8086/consumers/my_avro_consumer/instances/my_consumer_instance
Troubleshooting the demo
Verify the status of the Docker containers show
Upstate, except for thekafka-clientcontainer which is expected to haveExit 0state. If any containers are not up, verify in the advanced Docker preferences settings that the memory available to Docker is at least 8 GB (default is 2 GB).docker-compose ps
Your output should resemble:
           Name                          Command               State                             Ports
---------------------------------------------------------------------------------------------------------------------------------
connect                       /etc/confluent/docker/run        Up      0.0.0.0:8083->8083/tcp, 9092/tcp
control-center                /etc/confluent/docker/run        Up      0.0.0.0:9021->9021/tcp, 0.0.0.0:9022->9022/tcp
elasticsearch                 /bin/bash bin/es-docker          Up      0.0.0.0:9200->9200/tcp, 0.0.0.0:9300->9300/tcp
kafka-client                  bash -c -a echo Waiting fo ...   Up      0.0.0.0:7073->7073/tcp, 9092/tcp
kafka1                        /etc/confluent/docker/run        Up      0.0.0.0:29091->29091/tcp, 0.0.0.0:9091->9091/tcp, 9092/tcp
kafka2                        /etc/confluent/docker/run        Up      0.0.0.0:29092->29092/tcp, 0.0.0.0:9092->9092/tcp
kibana                        /bin/sh -c /usr/local/bin/ ...   Up      0.0.0.0:5601->5601/tcp
ksql-cli                      /bin/sh                          Up
ksql-server                   /etc/confluent/docker/run        Up      0.0.0.0:8088->8088/tcp
replicator-for-jar-transfer   sleep infinity                   Up      8083/tcp, 9092/tcp
restproxy                     /etc/confluent/docker/run        Up      8082/tcp, 0.0.0.0:8086->8086/tcp
schemaregistry                /etc/confluent/docker/run        Up      8081/tcp, 0.0.0.0:8085->8085/tcp
zookeeper                     /etc/confluent/docker/run        Up      0.0.0.0:2181->2181/tcp, 2888/tcp, 3888/tcp
To view sample messages for each topic, including
wikipedia.parsed:./scripts/consumers/listen.sh
If the data streams monitoring appears to stop for the Kafka source connector, restart the connect container.
docker-compose restart connect
If a command that communicates with ZooKeeper appears to be failing with the error
org.apache.zookeeper.KeeperException$NoAuthException, change the container you are running the command from to be eitherkafka1orkafka2. This is because ZooKeeper is configured for SASL/DIGEST-MD5, and any commands that communicate with ZooKeeper need properties set for ZooKeeper authentication.
Teardown
Stop the consumer group
appto stop consuming from topicwikipedia.parsed. Note that the command below stops the consumers gracefully withkill -15, so the consumers follow the shutdown sequence../scripts/app/stop_consumer_app_group_graceful.sh
Stop the Docker demo, destroy all components and clear all Docker volumes.
./scripts/stop.sh