Important
You are viewing documentation for an older version of Confluent Platform. For the latest, click here.
Confluent Control Center
Confluent Control Center is a web-based tool for managing and monitoring Apache Kafka®. Control Center provides the functionality for building and monitoring production data pipelines and streaming applications.
- Data Streams
- You can use Control Center to monitor your data streams end to end, from producer to consumer. Use Control Center to verify that every message sent is received (and received only once), and to measure system performance end to end. Drill down to better understand cluster usage, and identify any problems.
- System Health
- Control Center can monitor the health of your Kafka clusters. You can see trends for important broker and topic health metrics, and set alerts on important cluster key performance indicators (KPIs).
- Kafka Connect Configuration
- You can also use Control Center to manage and monitor Kafka Connect: the toolkit for connecting external systems to Kafka. You can easily add new sources to load data from external data systems and new sinks to write data into external data systems. Additionally, you can manage, monitor, and configure connectors with Confluent Control Center.
Architecture
Control Center is comprised of these parts:
- Metrics interceptors that collect metric data on clients (producers and consumers).
- Kafka to move metric data.
- The Control Center application server for analyzing stream metrics.
Here is a common Kafka environment that uses Kafka to transport messages from a set of producers to a set of consumers that are in different data centers, and uses Replicator to copy data from one cluster to another:
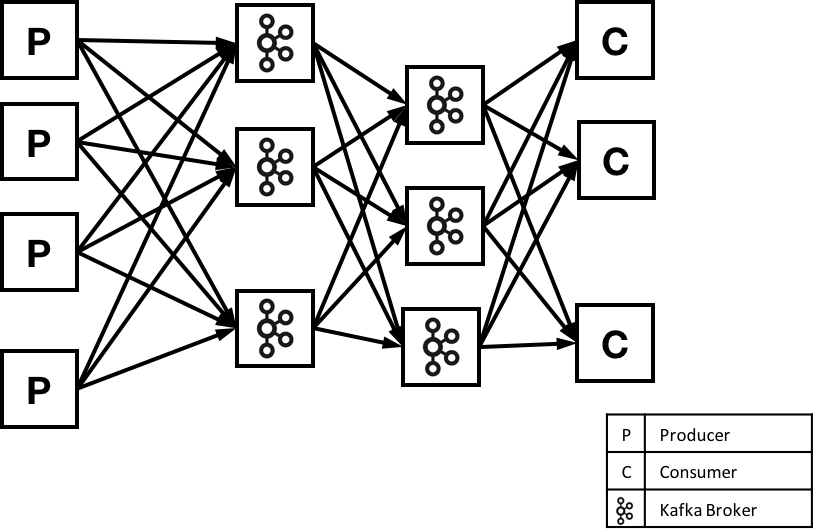
An example system using Kafka
Confluent Control Center helps you detect any issues moving data, including late messages, duplicate messages, or lost messages. By adding lightweight code to clients, Stream Monitoring can count every message sent and received in a streaming application. By using Kafka to send metrics information, Stream Monitoring metrics are transmitted quickly and reliably to the Control Center application.
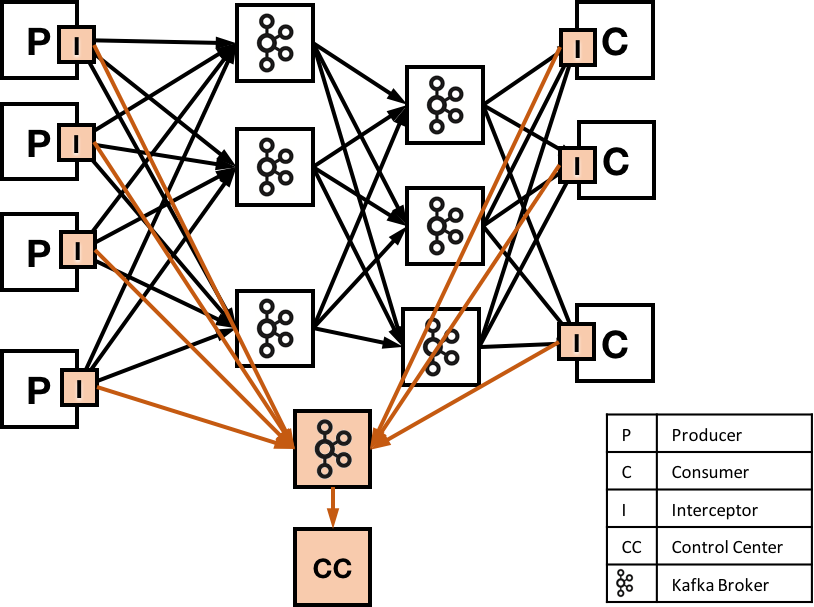
An example system using Kafka, monitored by Control Center
Time windows and metrics
Stream Monitoring is designed to efficiently audit the set of messages that are sent and received. To do this, Control Center use a set of techniques to measure and verify delivery.
The interceptors work by collecting metrics on messages produced (or consumed) on each client, and sending these to
Control Center for analysis and reporting. Both interceptors use Kafka message timestamps to group messages.
Specifically, the interceptors will collect metrics during a 1 minute time window based on this timestamp. (You can
calculate this by a function like floor(messageTimestamp / 60) * 60.) Metrics are collected for each combination
of producer, consumer group, consumer, topic, and partition. Currently, metrics include a message count and cumulative
checksum for producers and consumer, and latency information from consumers. We may add additional measurements
in the future.
Latency
Latency is measured by calculating the difference between the system clock time on the consumer and the timestamp in the message. In a distributed environment, it can be difficult to keep clocks synchronized. If the clock on the consumer is running faster than the clock on the producer, then Control Center might show latency values that are higher than the true values. If the clock on the consumer is running slower than the clock on the producer, then Control Center might show latency values that are lower than the true values (and in the worst case, negative values).
If your clocks are out of sync, you might notice some unexpected results in Confluent Control Center. We recommend using a mechanism like NTP to synchronize time between production machines; this can help you keep clocks synchronized to within 20ms over the public internet, and to within 1 ms for servers on the same local network.
Tip
NTP practical example: In an environment where messages take 1 second or more to be produced and consumed, and NTP is used to synchronize clocks between machines, the latency information should be accurate to within 2%.
- Contents