Important
You are viewing documentation for an older version of Confluent Platform. For the latest, click here.
Brokers
The Brokers feature provides a succinct view of essential Apache Kafka® metrics for brokers in a cluster:
- Throughput for production and consumption
- Partitions and partition replica status
- Active controller and Apache ZooKeeper™ status
- Disk usage and distribution
- System metrics for network and request pool usage
Brokers overview page
The Brokers overview page conveys at a glance the health of brokers (nodes) in a Kafka cluster. View a summary of broker health and metrics.
To access the Brokers overview page, select a cluster from the navigation bar and click Brokers from the cluster submenu.
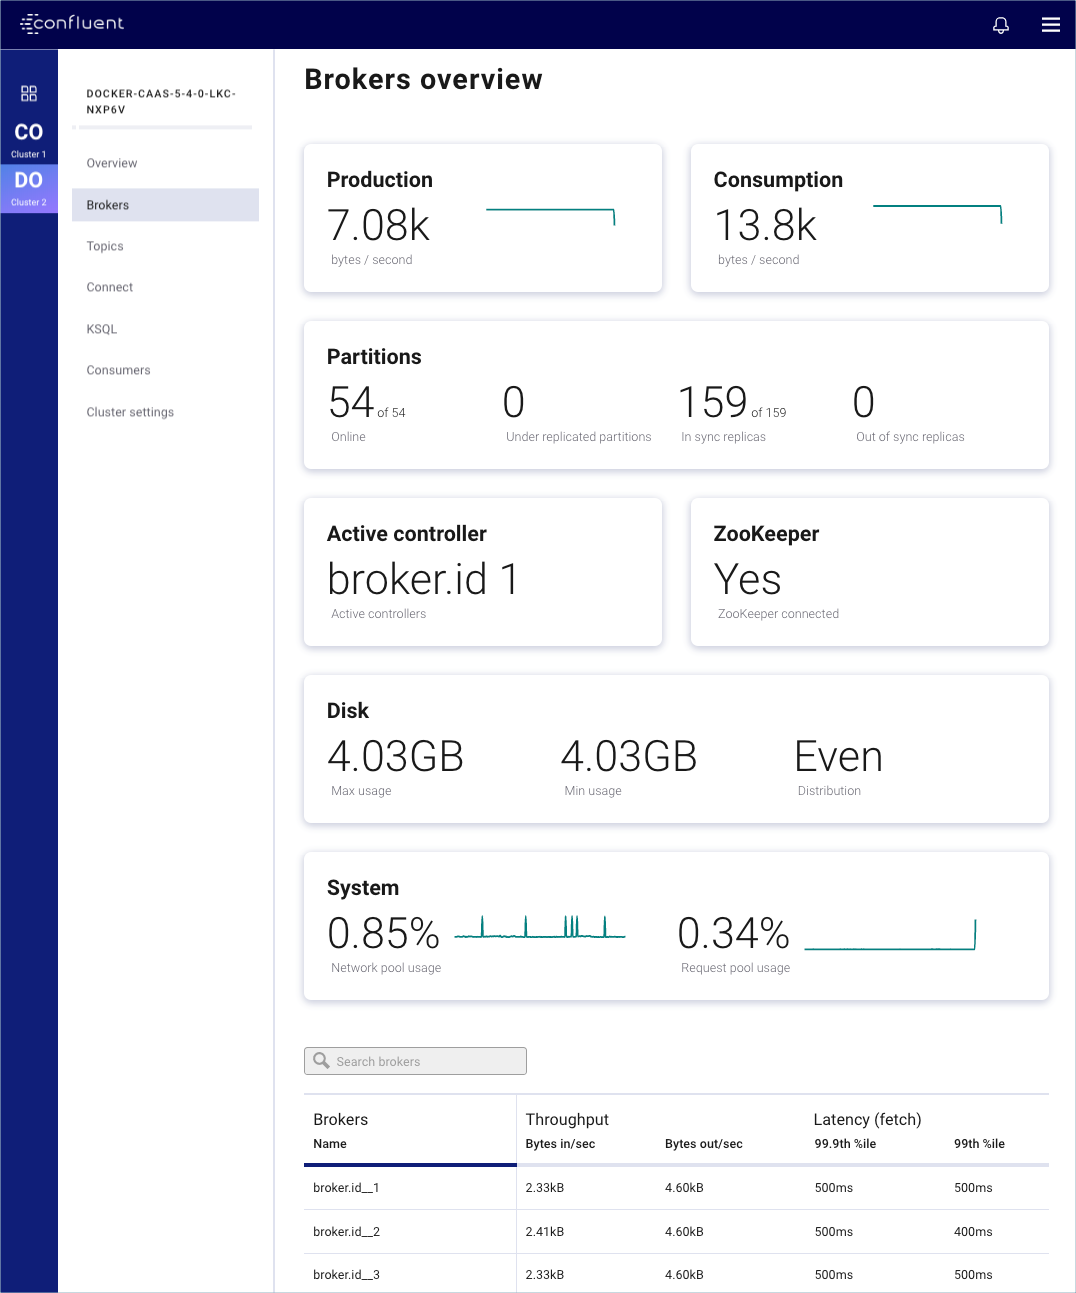
Brokers overview
The clickable summary cards allow you to drill into detailed metrics charts for:
- production
- consumption
- broker uptime
- partition replicas
- system network and request pool usage
- disk usage
To navigate back to the Brokers overview page after drilling into the Metrics dashboard, either click the Brokers submenu again or click the Brokers Overview > breadcrumb at the top of the page.
The cards show a red sidebar for any issues that require operator attention.
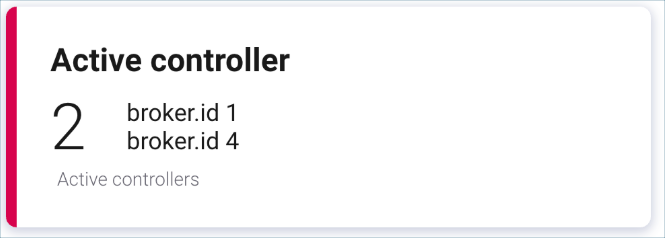
Multiple active controllers issue
Tip
You can set alerts on many of these metrics, such as: production request latency, under-replicated partitions, out of sync replica count, active controller count, ZooKeeper status, and more. Send alerts action notifications though email, Slack, or PagerDuty. For details, see Alerts.
The Brokers table at the bottom of the page lists all brokers by ID. Use this table to:
- Search for a broker by its ID.
- Sort a column by clicking in the column title cell.
- View throughput (bytes in and out per second) and latency (fetch and produce) percentile metrics.
Brokers metrics page
To access the Metrics page for brokers, click any summary card on the Brokers overview page. All metrics panels are conveniently located on one page. Clicking a particular card on the Brokers overview page brings the relevant metrics panel into focus:
- Production metrics panel
- Consumption metrics panel
- Broker uptime metrics panel
- Partition replicas metrics panel
- System usage panel
- Disk usage panel
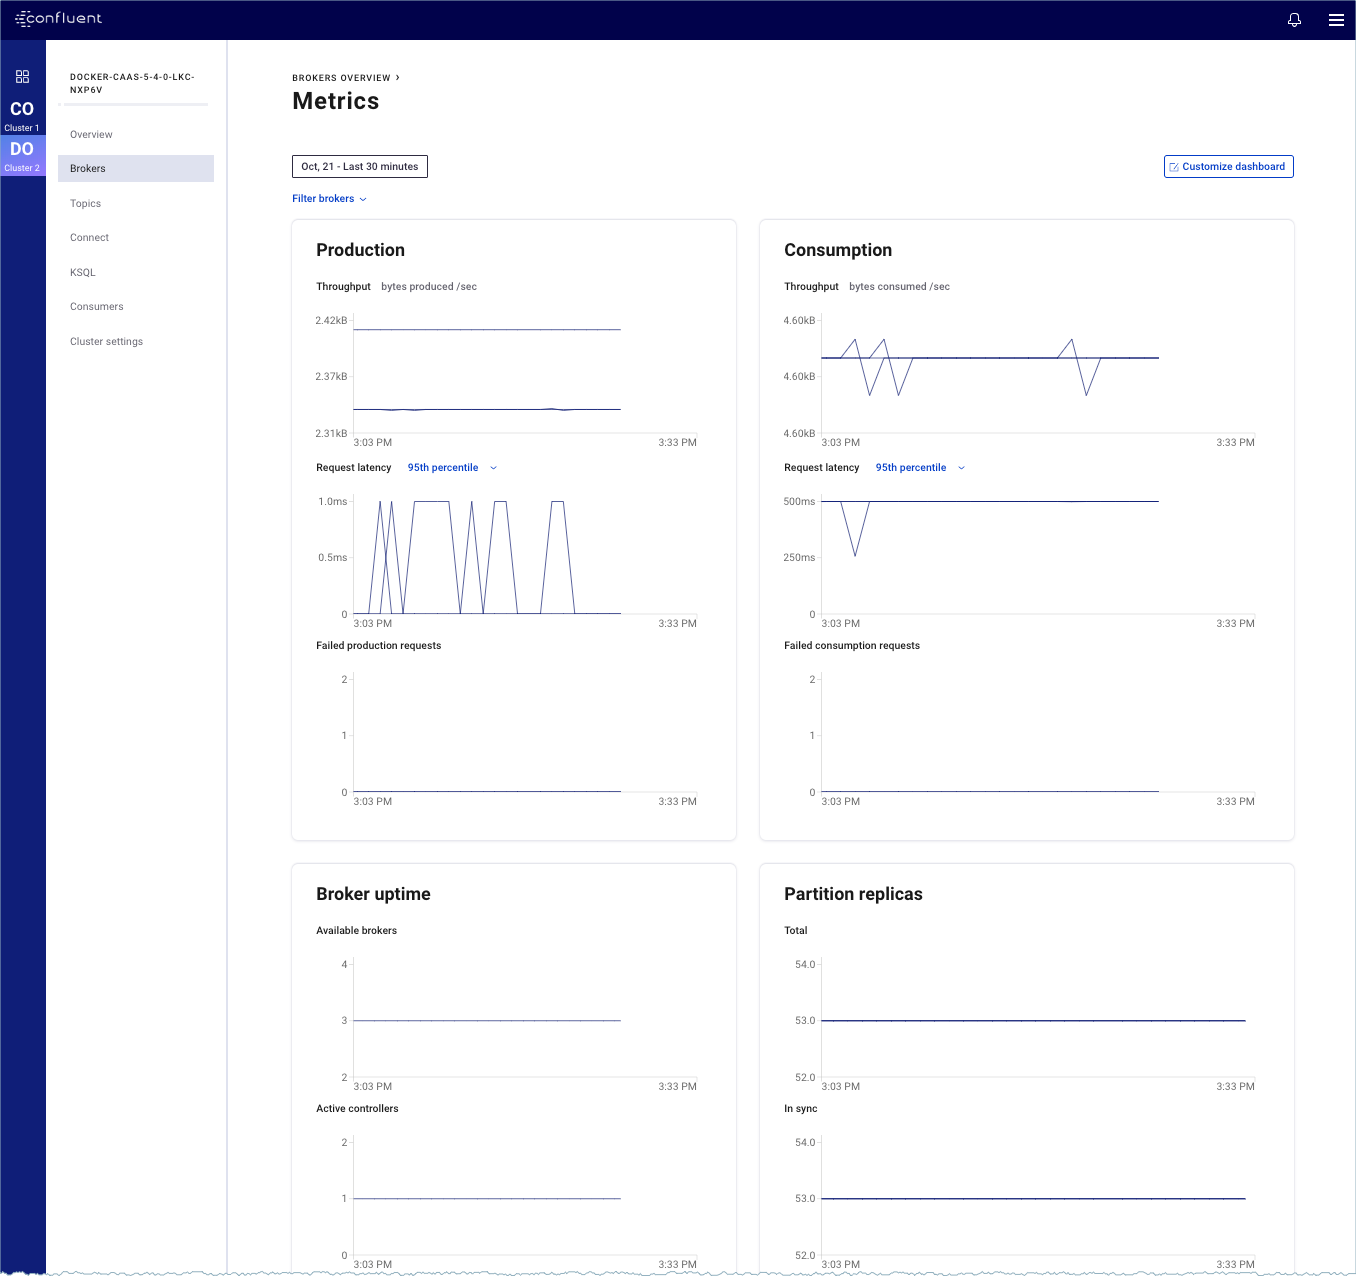
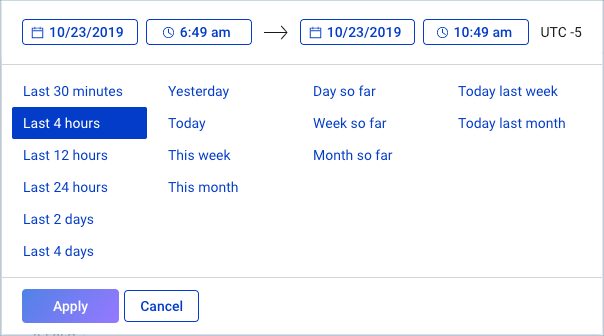
Timeframe selector
Click the timeframe selector to select the granularity for viewing data. The timeframe default is the last 4 hours for the current date.
Timeframe selector
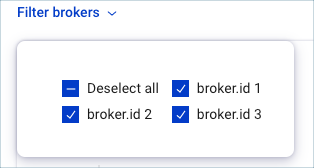
Filter brokers
In a multiple broker environment, use the interactive broker selection controls to view the metrics charts for multiple brokers. Click Deselect all or Select all, or individually select each broker you want to view on the applicable charts.
Note
Not applicable to Broker uptime panels.
Customize the dashboard for brokers metrics
Drag and drop to rearrange the order of the brokers metrics dashboard panels.
Note
The settings only persist across the same browser and computer.
Click Customize Dashboard on the Brokers Overview > Metrics page.
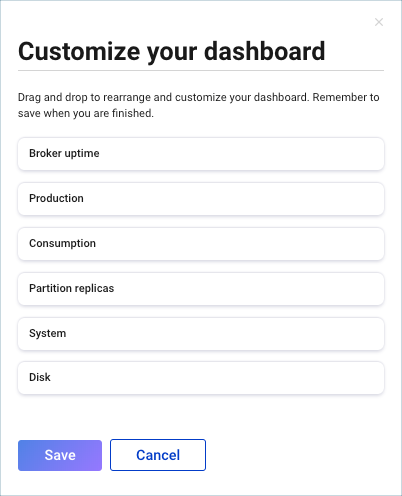
Drag the panels into the order you want.
Click Save.
Request latency selector
Select a percentile from the menu for viewing production or consumption request latency.

Tip
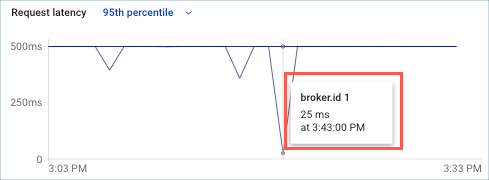
Click on a point of the line graph in the Request latency panels to view details on Production or Consumption request latency.
Inspection cursor
Hover on any point in any chart graph line to view details for a specific point in time.
Production metrics panel
To access the Production metrics panel, click the Production summary card from the Brokers overview page.
The Production panel shows throughput, request latency, and any failed production requests.
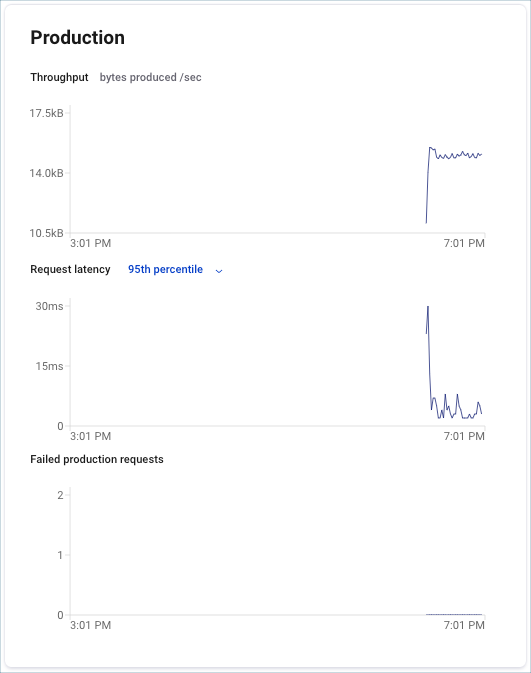
Click on a point of the line graph in the Request latency panel to view details on Production request latency.

Production request latency
Consumption metrics panel
To access the Consumption metrics panel, click the Consumption summary card from the Brokers overview page.
The Consumption panel shows throughput, request latency, and any failed consumption requests.
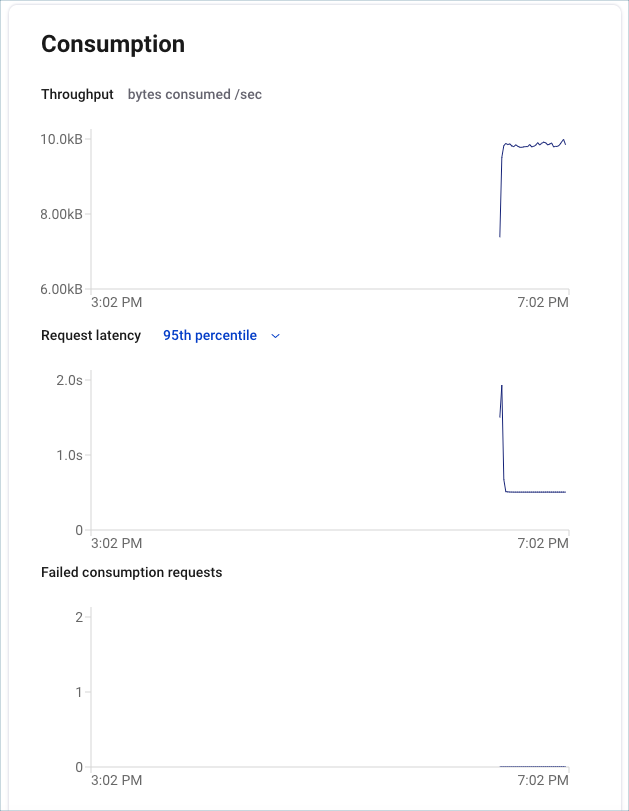
Click on a point of the line graph in the Request latency panel to view details on Consumption request latency.
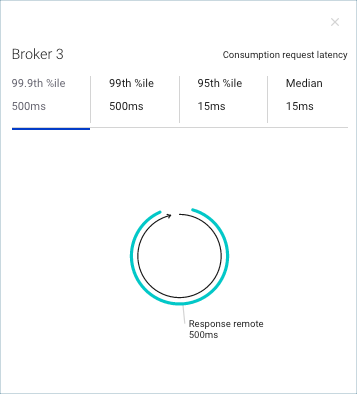
Consumption request latency
Broker uptime metrics panel
To access the Broker uptime panel, click the Broker uptime summary card from the Brokers overview page.
The charts show uptime for available brokers, active controllers, and ZooKeeper.
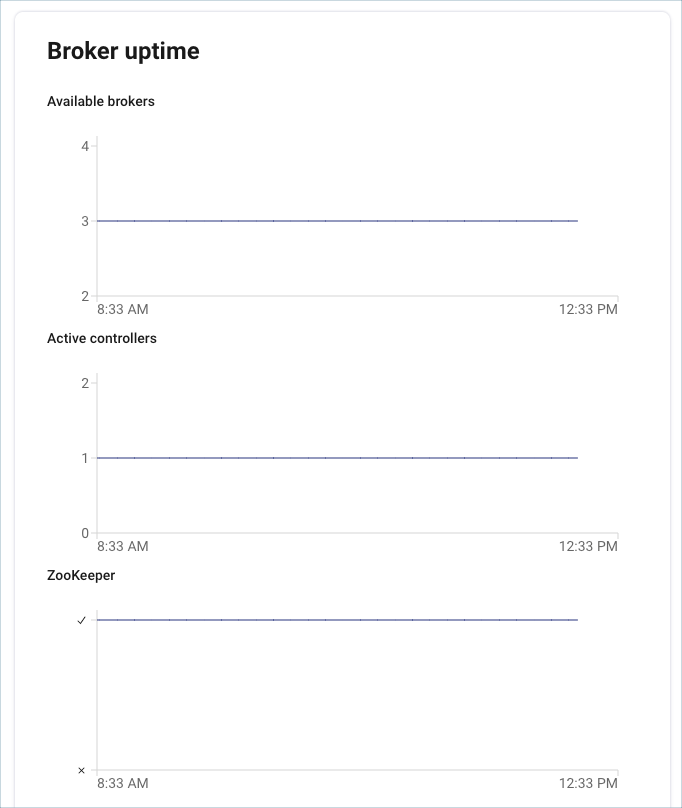
Note
Broker uptime metrics are cluster-wide, and do not apply to individual brokers. The Filter broker controls are not applicable to the Broker uptime panel.
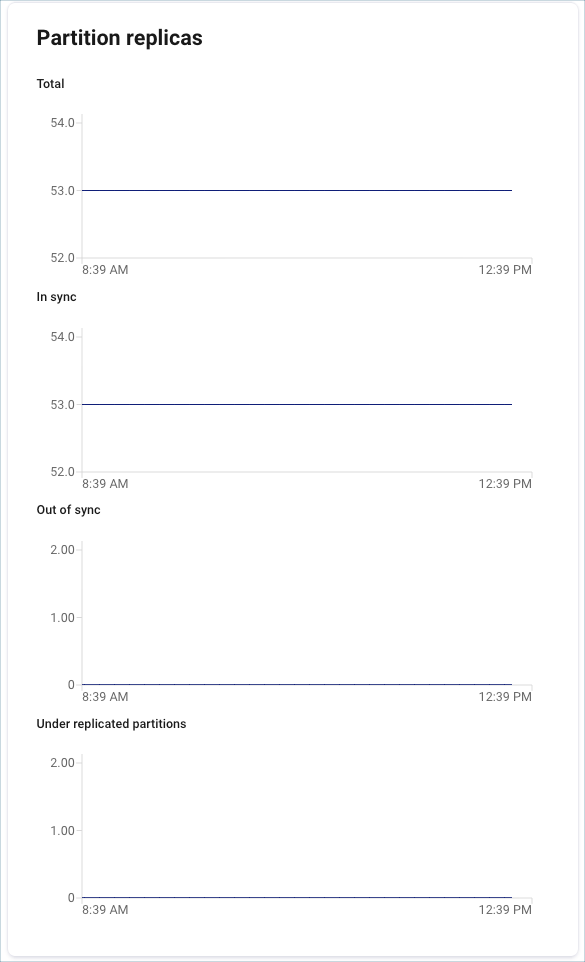
Partition replicas metrics panel
To access the Partition panel, click the Partitions summary card from the Brokers overview page.
The charts show the total number of partitions, in sync, out of sync, and under-replicated partitions.
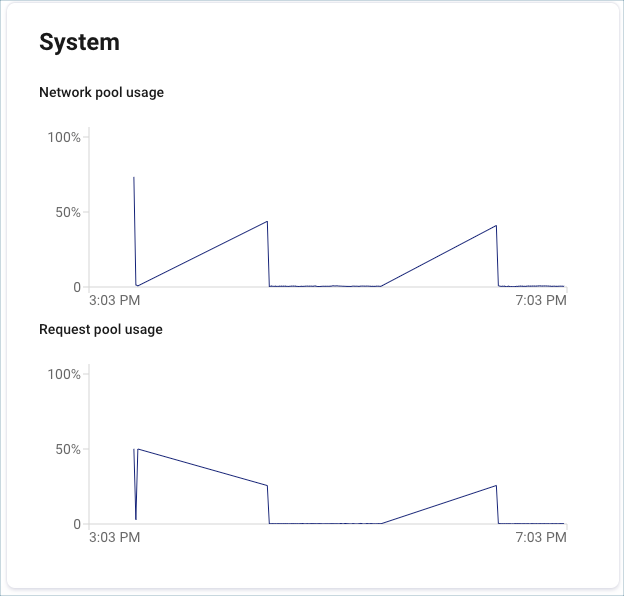
System usage panel
To access the System panel, click the System summary card from the Brokers overview page.
The System panel shows network and request pool usage.
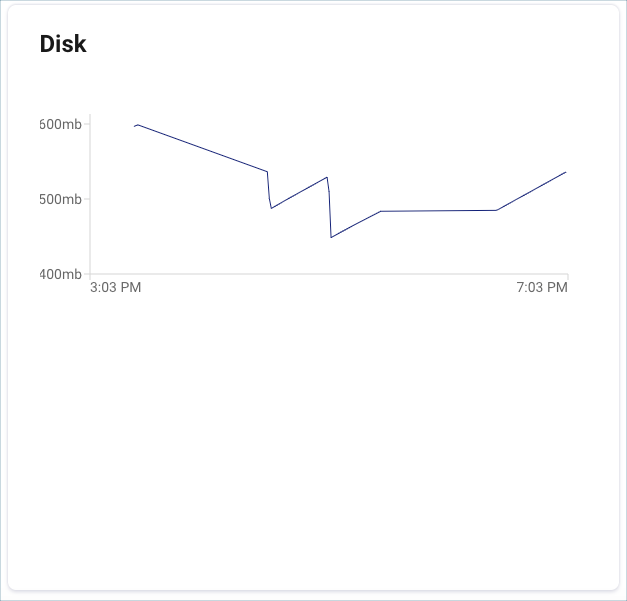
Disk usage panel
To access the Disk panel, click the Disk summary card from the Brokers overview page.
The Disk panel shows maximum usage, minimum usage, and distribution.