Important
You are viewing documentation for an older version of Confluent Platform. For the latest, click here.
Control Center User Guide
To access the Control Center interface, open your web browser and navigate to the
host and port where Control Center is running.
Control Center runs at http://localhost:9021/ by default.
For details on available configurations, see Control Center Configuration Reference.
Tip
Take advantage of auto-updates for the Control Center user interface. For more information, see Auto-updating the Control Center user interface.
When you first open Control Center, the Home page for your clusters appears. The Home page provides a global overview of all clusters managed by the Control Center instance. Each cluster tile displays its running status, Kafka overview statistics, and connected services. Click on a cluster tile to drill directly into the Brokers overview.
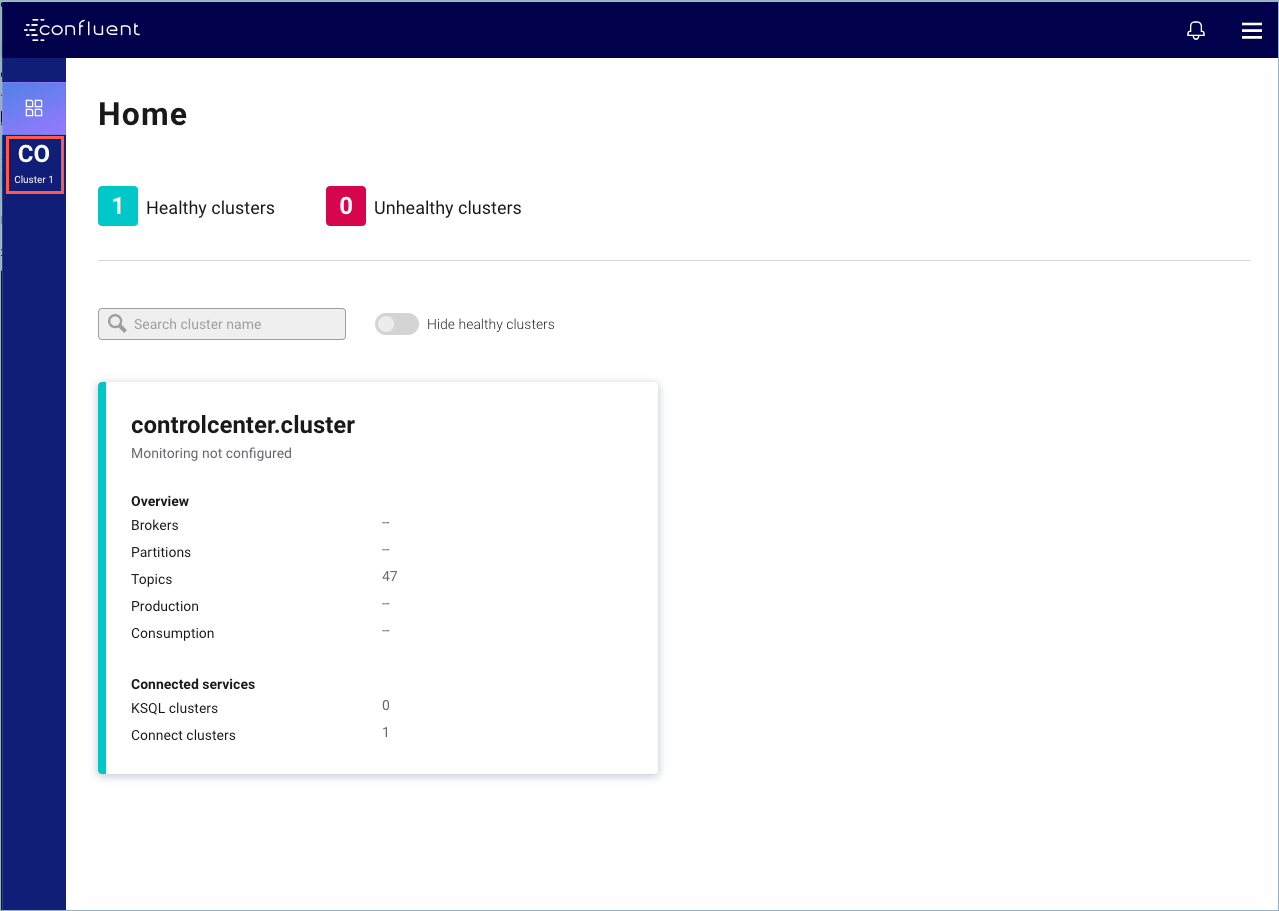
Clusters home page single cluster
You can show and hide healthy clusters to focus on any clusters that are unhealthy. Healthy clusters are indicated with green; unhealthy clusters are indicated with red panel sidebars. Use the search field to quickly locate a cluster if your environment has a large number of clusters to manage.
Hover on a cluster abbreviation in the navigation bar to view its complete name.

Click on a cluster tile to go directly to the Brokers overview page.
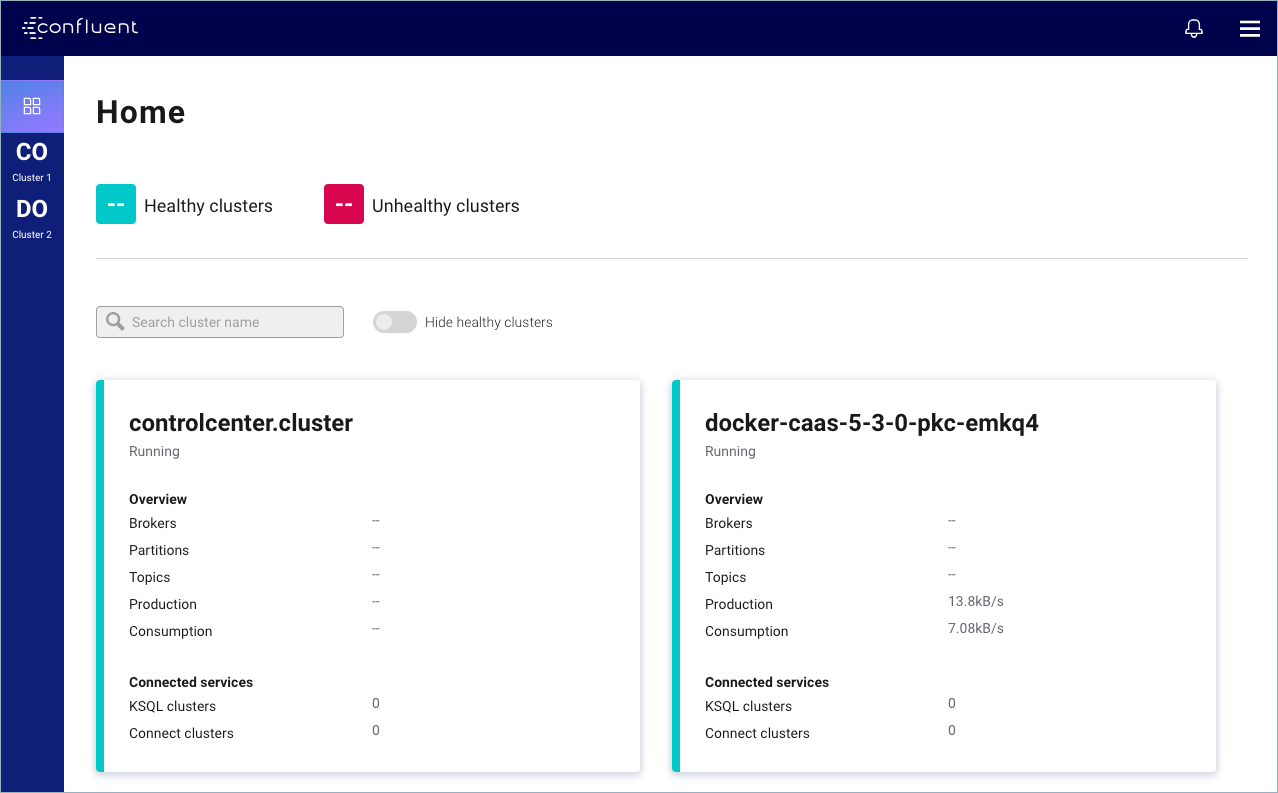
Clusters home page multiple clusters
Click the Alerts bell icon to navigate to the Alerts Overview where you can set up alerts and view alert history.
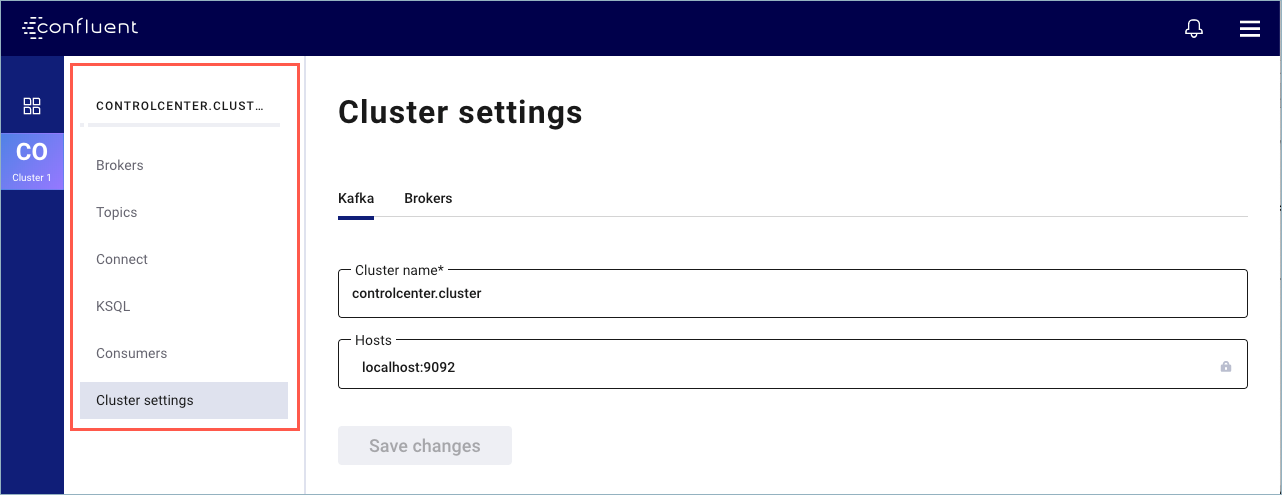
After you select a cluster from the navigation bar, a submenu for the cluster becomes available for you to access a component feature.
Control Center feature menus: