Important
You are viewing documentation for an older version of Confluent Platform. For the latest, click here.
Replicators
Confluent Replicator replicates Kafka topics from one cluster to another (source to destination), copying the messages, and creating replica topics that preserve the topic configuration in the source cluster.
From the Replicators pages on Control Center, you can:
- Monitor tasks, message throughput, and Connect workers running as replicators.
- Monitor metrics on source topics on the origin cluster.
- Monitor metrics on replicated topics on the destination cluster.
- Drill down on source and replicated topics to monitor and configure them through the Control Center Topics pages (see Topics).
The metrics provided are:
- Throughput - the number of messages replicated per second.
- Message Lag - the number of messages that have been produced to the origin cluster that have not yet been replicated to the destination.
- Latency - the average time period between message production to the origin cluster and message production to the destination cluster.
The metrics are broken down by connector, task and topic/partition.
Enable Replicator monitoring
If you are just getting started with Replicator, you can use the Tutorial: Replicating Data Between Clusters as a guide to bring up origin and destination clusters with topic replication, then follow the steps in the last section, Use Control Center to monitor replicators, to configure monitoring.
All Replicators page
To access the Replicators overview page, select a cluster from the navigation bar and click Replicators from the cluster submenu.
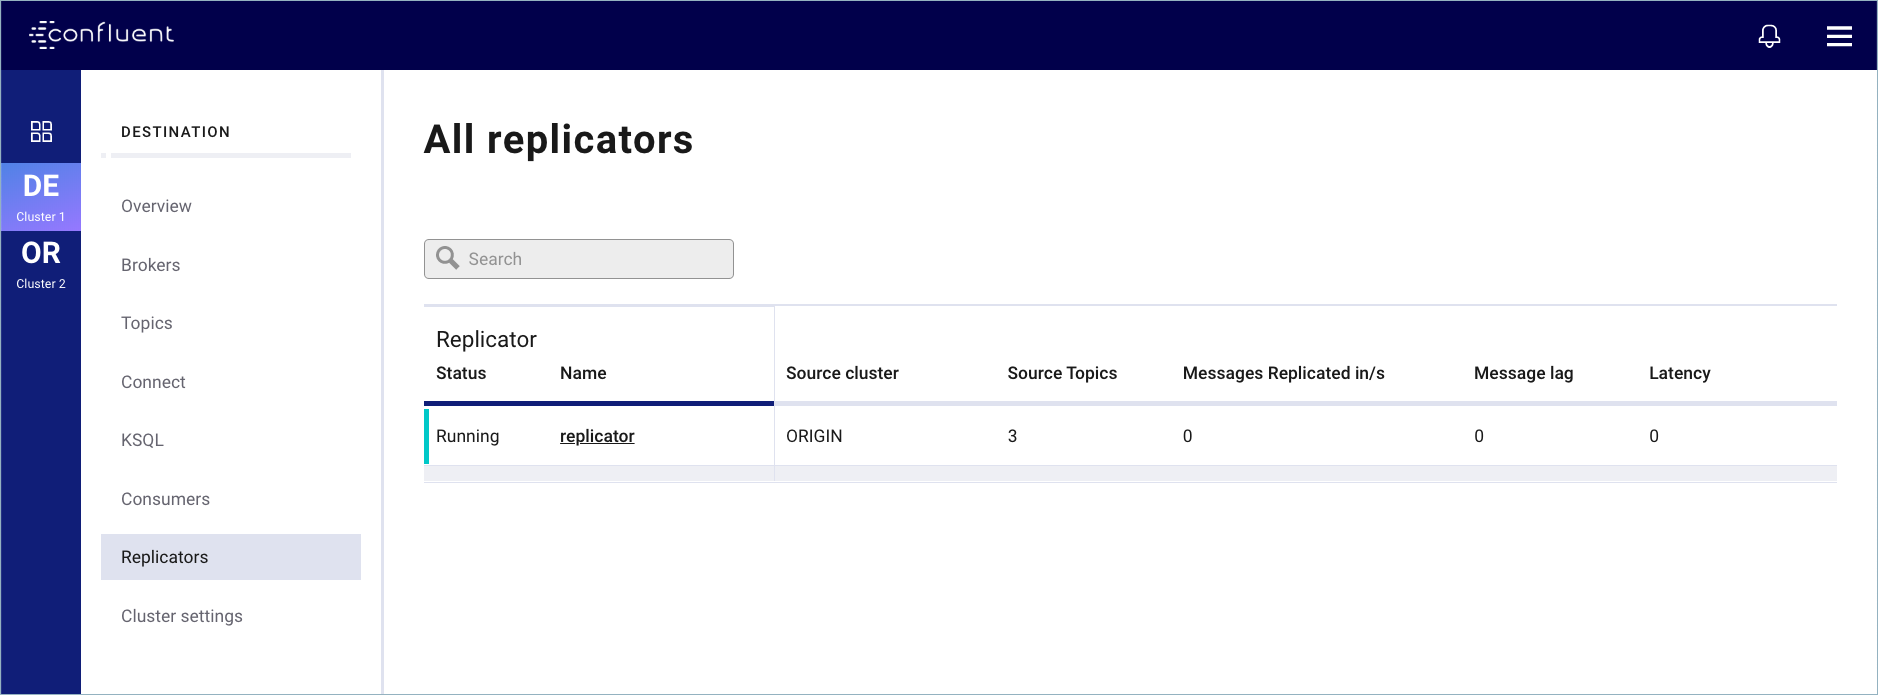
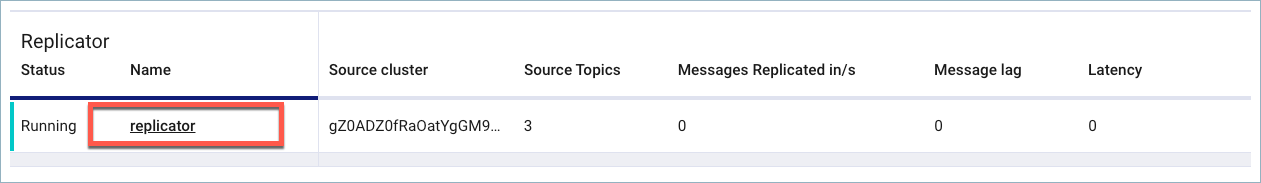
The Replicators overview page lists all replicators in the selected cluster, and shows status at a glance of tasks for each replicator, including:
- Status of replicators (running, failed, and paused)
- Number of source topics processed
- Number of messages replicated per second
- Message lag
- Latency
Origin and Destination clusters
If your clusters and replication are configured properly, a minimum of two clusters, origin and destination, will be displayed on the Control Center.
Tip
If you do not see fully populated origin and destination clusters on Control Center, review the configuration details in Tutorial: Replicating Data Between Clusters and particularly the subtopic in that guide, Use Control Center to monitor replicators.
The clusters are rendered on Control Center with auto-generated names. The destination cluster defaults to Confluent Control Center because Confluent Control Center runs on the destination.
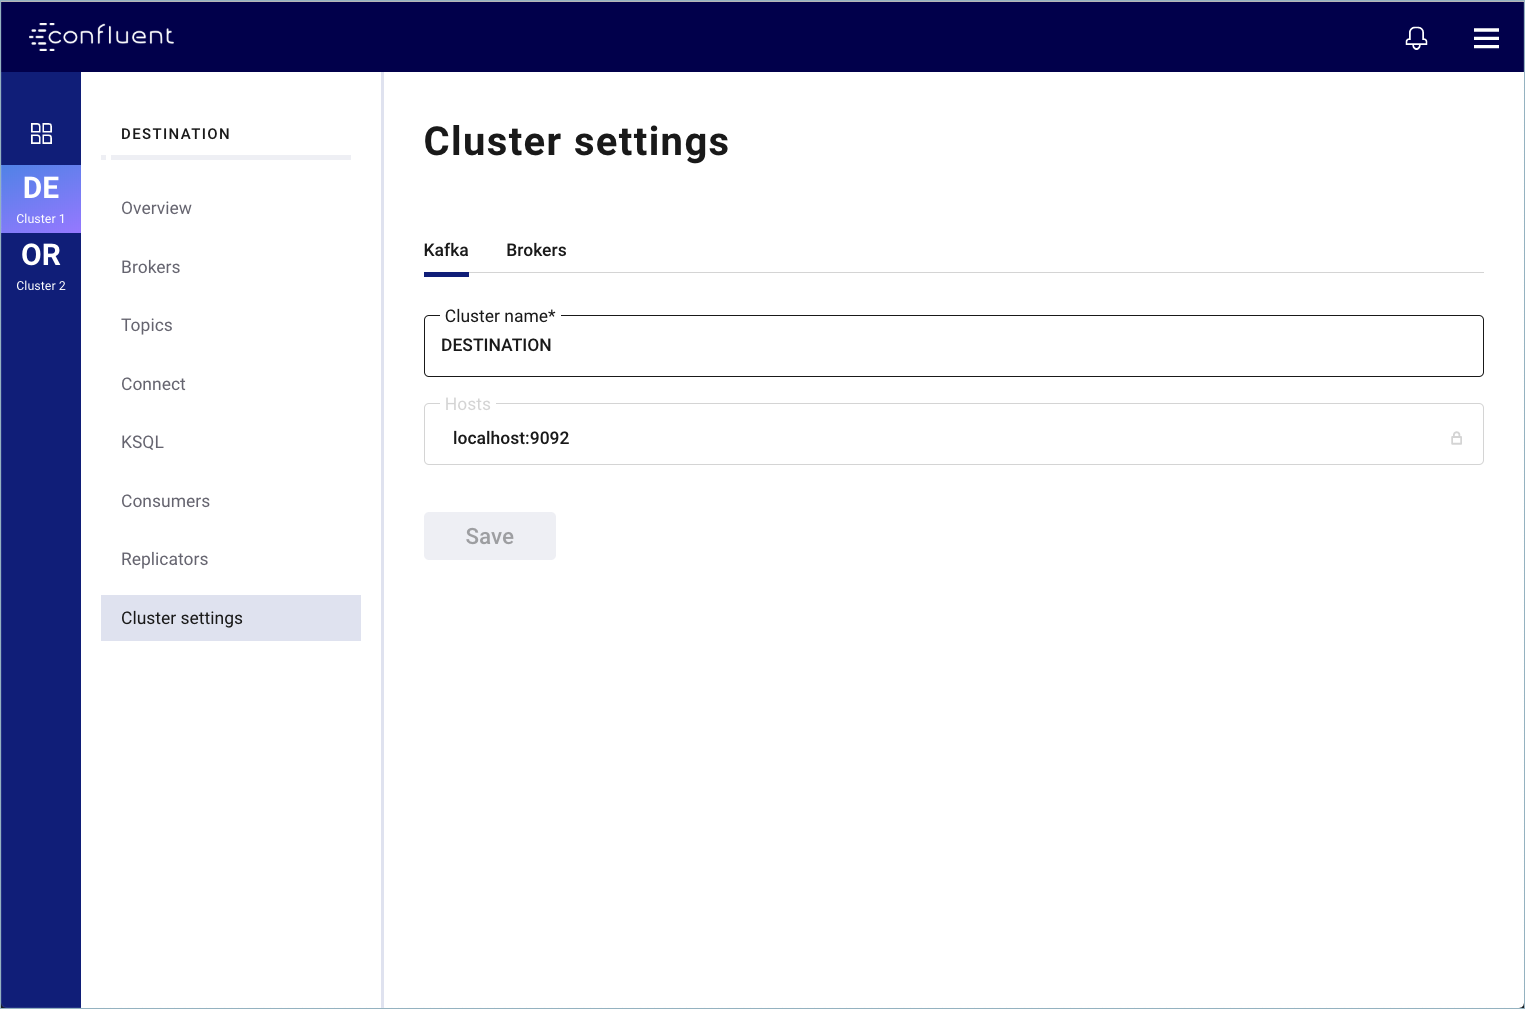
To edit the cluster names:
- Select a cluster.
- Click Cluster settings on the navigation menu.
- On the Kafka tab, type a cluster name, and click Save.
This is the renamed destination cluster.
This is the renamed source cluster.

Source and Replicated topics
Source topics are located on the origin cluster. There are several ways to navigate to these topics. For example:
- With either cluster selected, click Replicators on the navigation menu, click a replicator, then choose Source Topics tab -> <topic>.
- With either cluster selected, click Replicators on the navigation menu, click a replicator, then click the Throughput metrics card -> <task> -> <topic>.
- Select the origin cluster, click Topics, and drill down on a topic that way.
Replicated topics live on the destination cluster. To navigate to these topics:
Select the destination cluster.
Select Topics from the navigation menu.
Click a replicated topic.
The following sections describe the available replication monitoring, metrics, and configuration views in more detail.
Metrics and topics for a replicator
To view details on a specific replicator, click a replicator in the list on the All Replicators page.
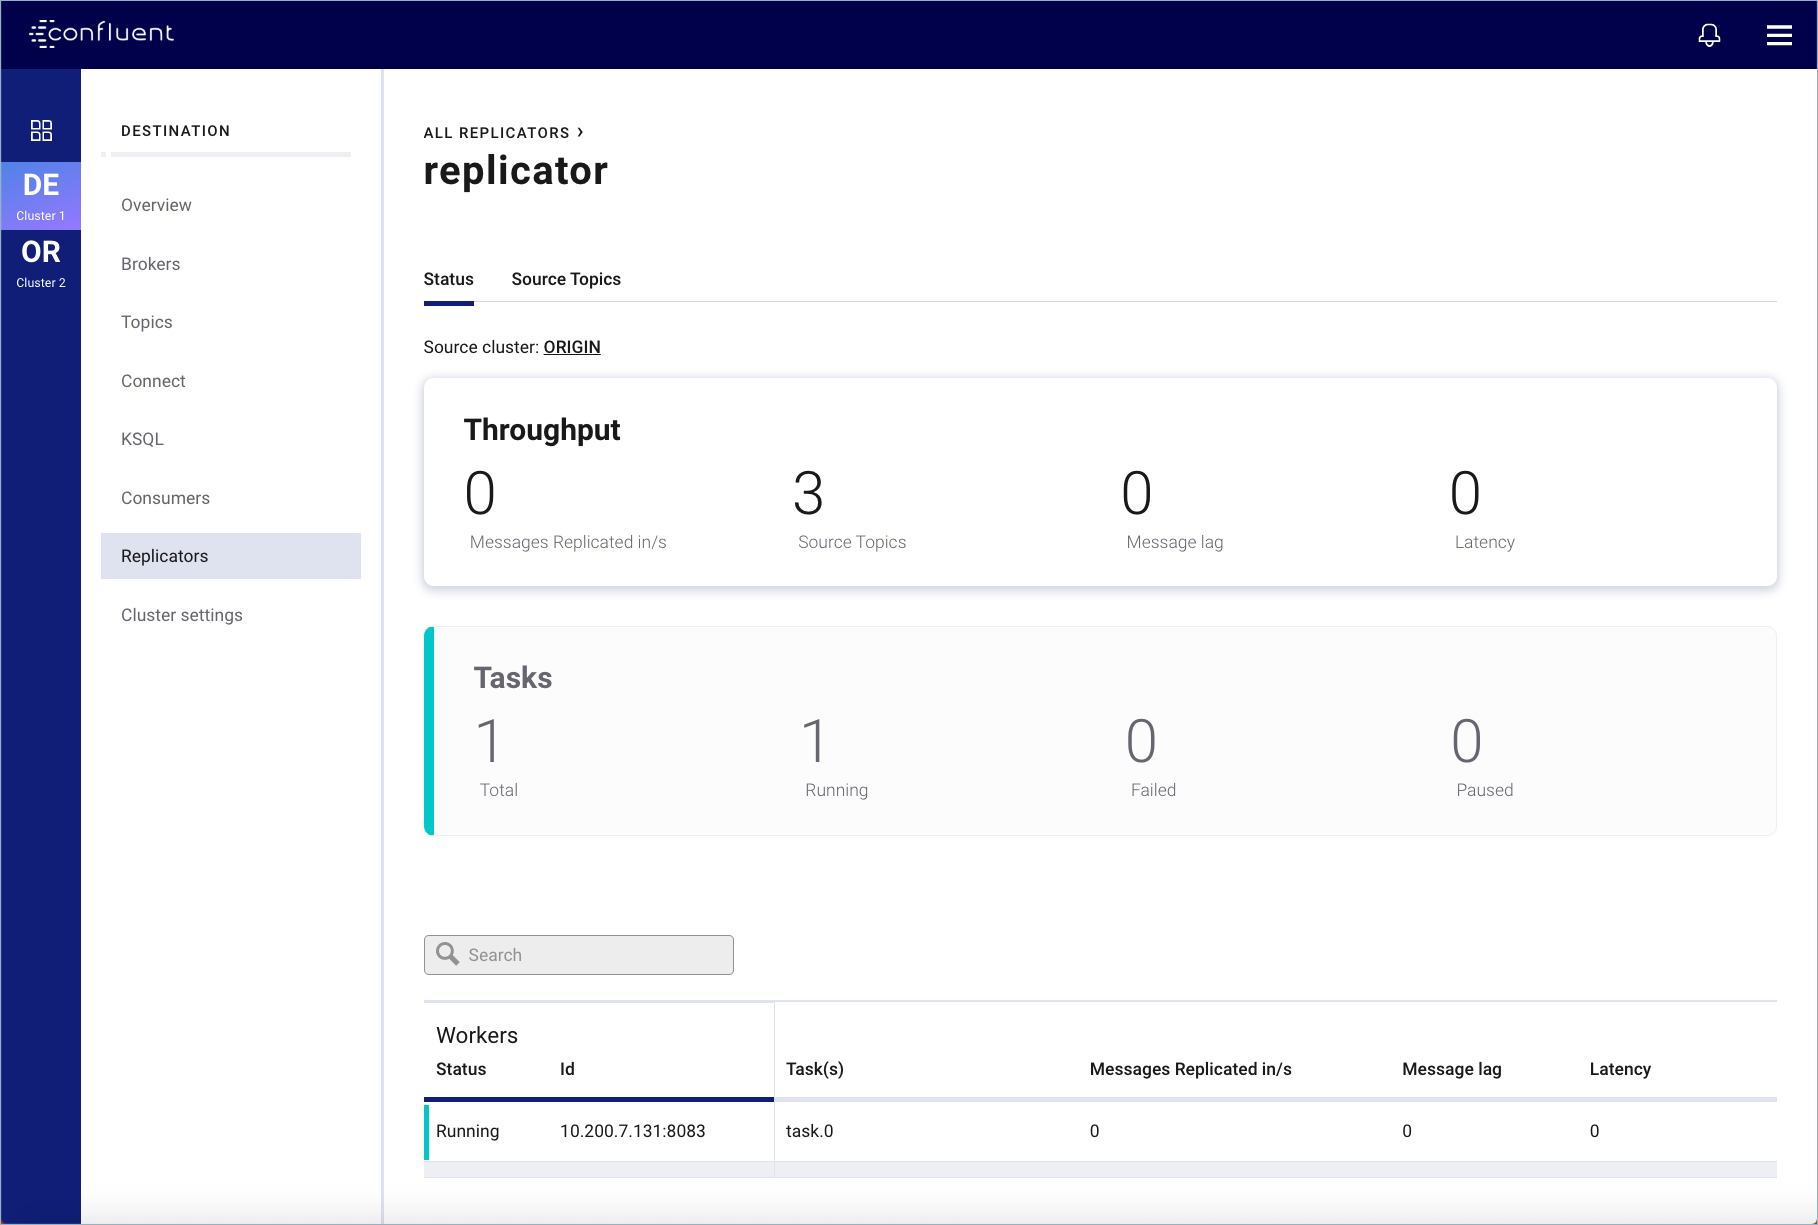
The Replicator status page is displayed, showing:
- Throughput metrics on message replication, including messages replicated per second, number of source topics, lag, and latency
- Task overview, including total tasks, and number of running, failed, and paused tasks
- List of Connect workers showing status of each worker, along with message performance metrics per worker. You can scroll and search the list of workers.
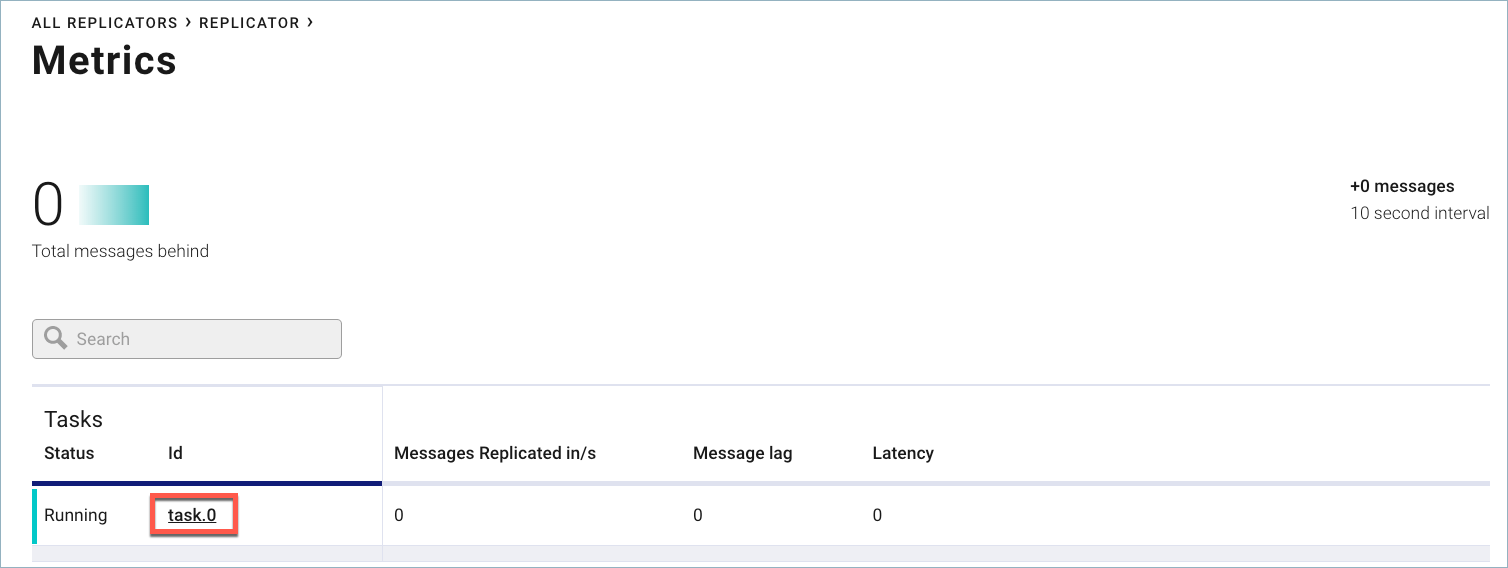
Tasks associated with a replicator
To view a list of tasks associated with a replicator, click the Throughput card for the selected replicator.
The list of tasks is displayed.
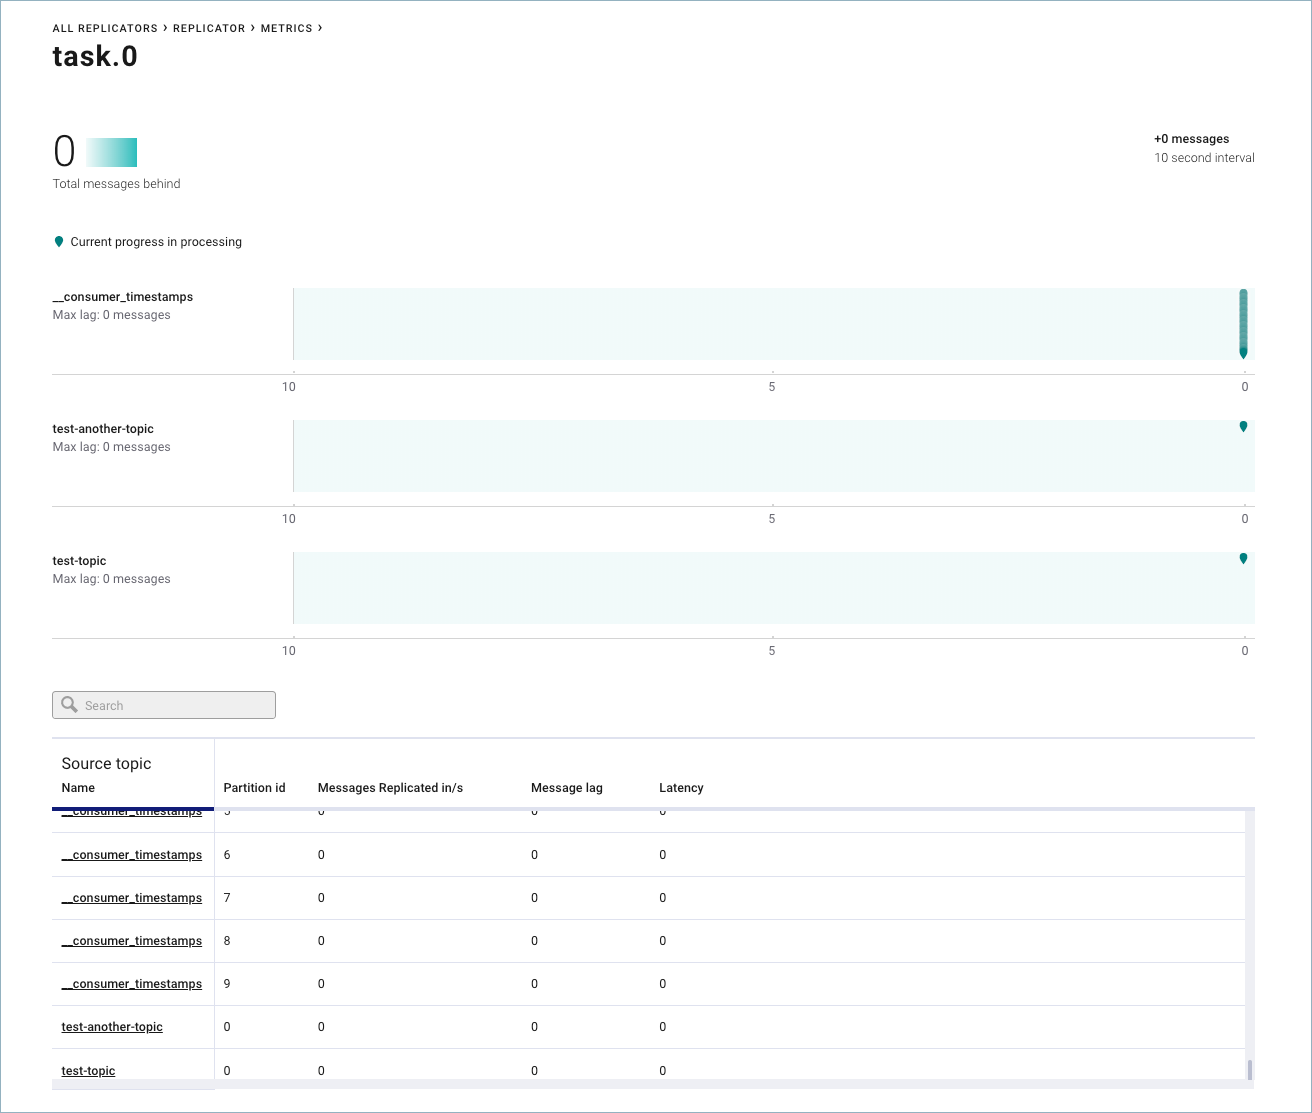
Message metrics for a task
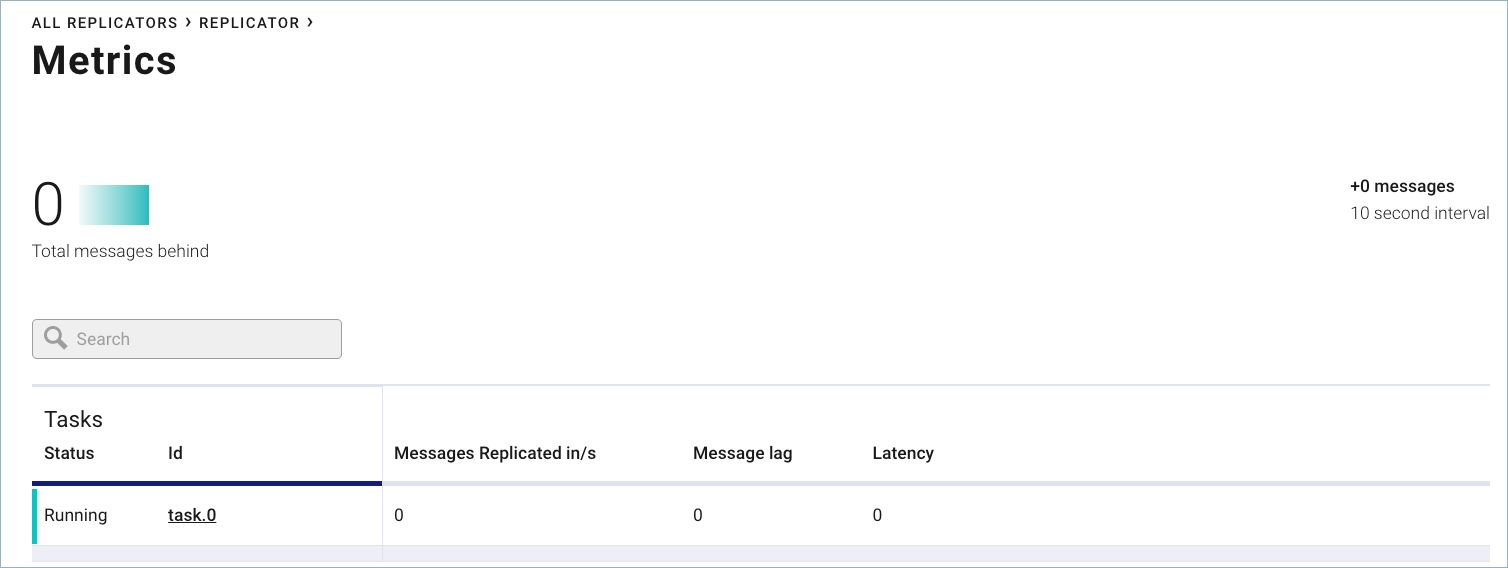
To view metrics for a specific task, click one of the tasks associated with the selected replicator.
The task metrics are displayed at the top of the page. A list of source topics and associated metrics per topic is displayed on the lower half of the page. You can search and scroll through this list.
Source topics
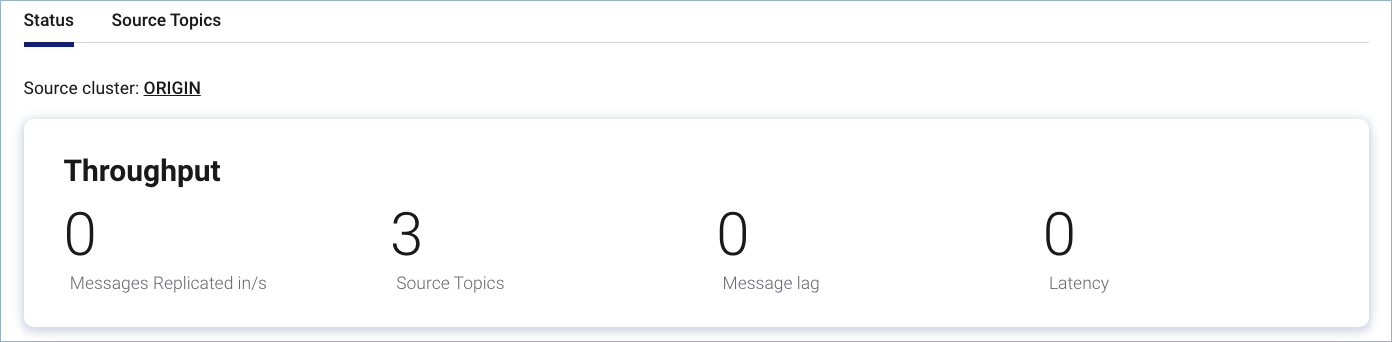
To view details on a source topic (a topic on the origin cluster), select the Source Topics tab for the Replicator, then click a topic in the list.
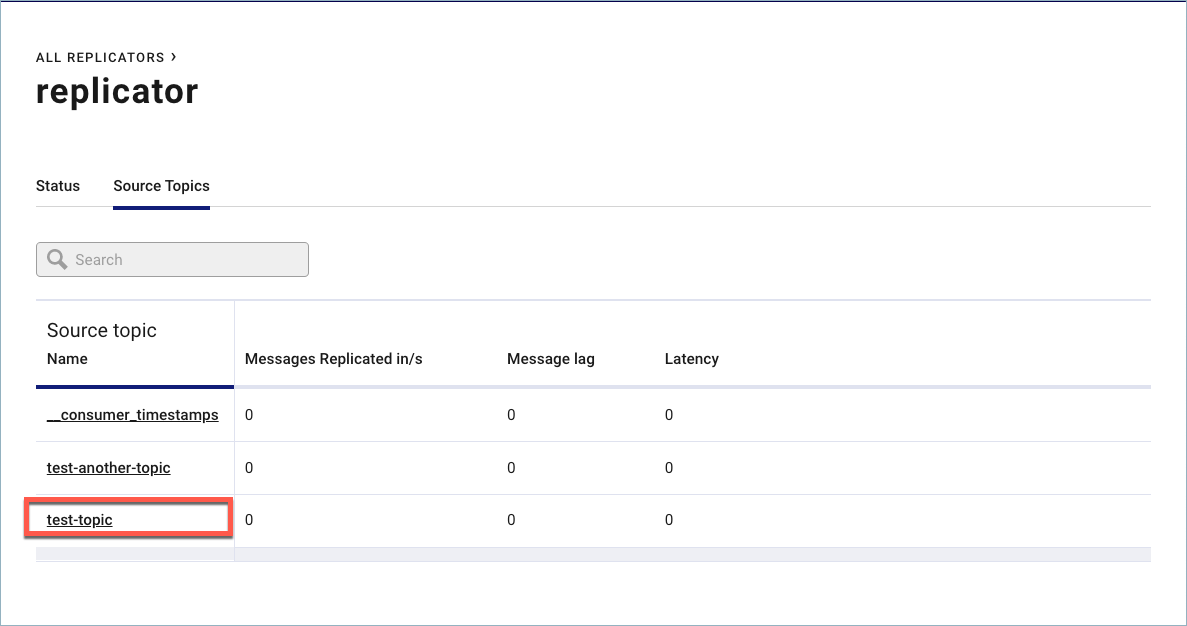
You can also view details on source topic by clicking a topic on the task metrics page or, with the origin cluster selected, click Topics from the navigation bar, then click a topic in that list.
An overview of metrics for the source topic is displayed.
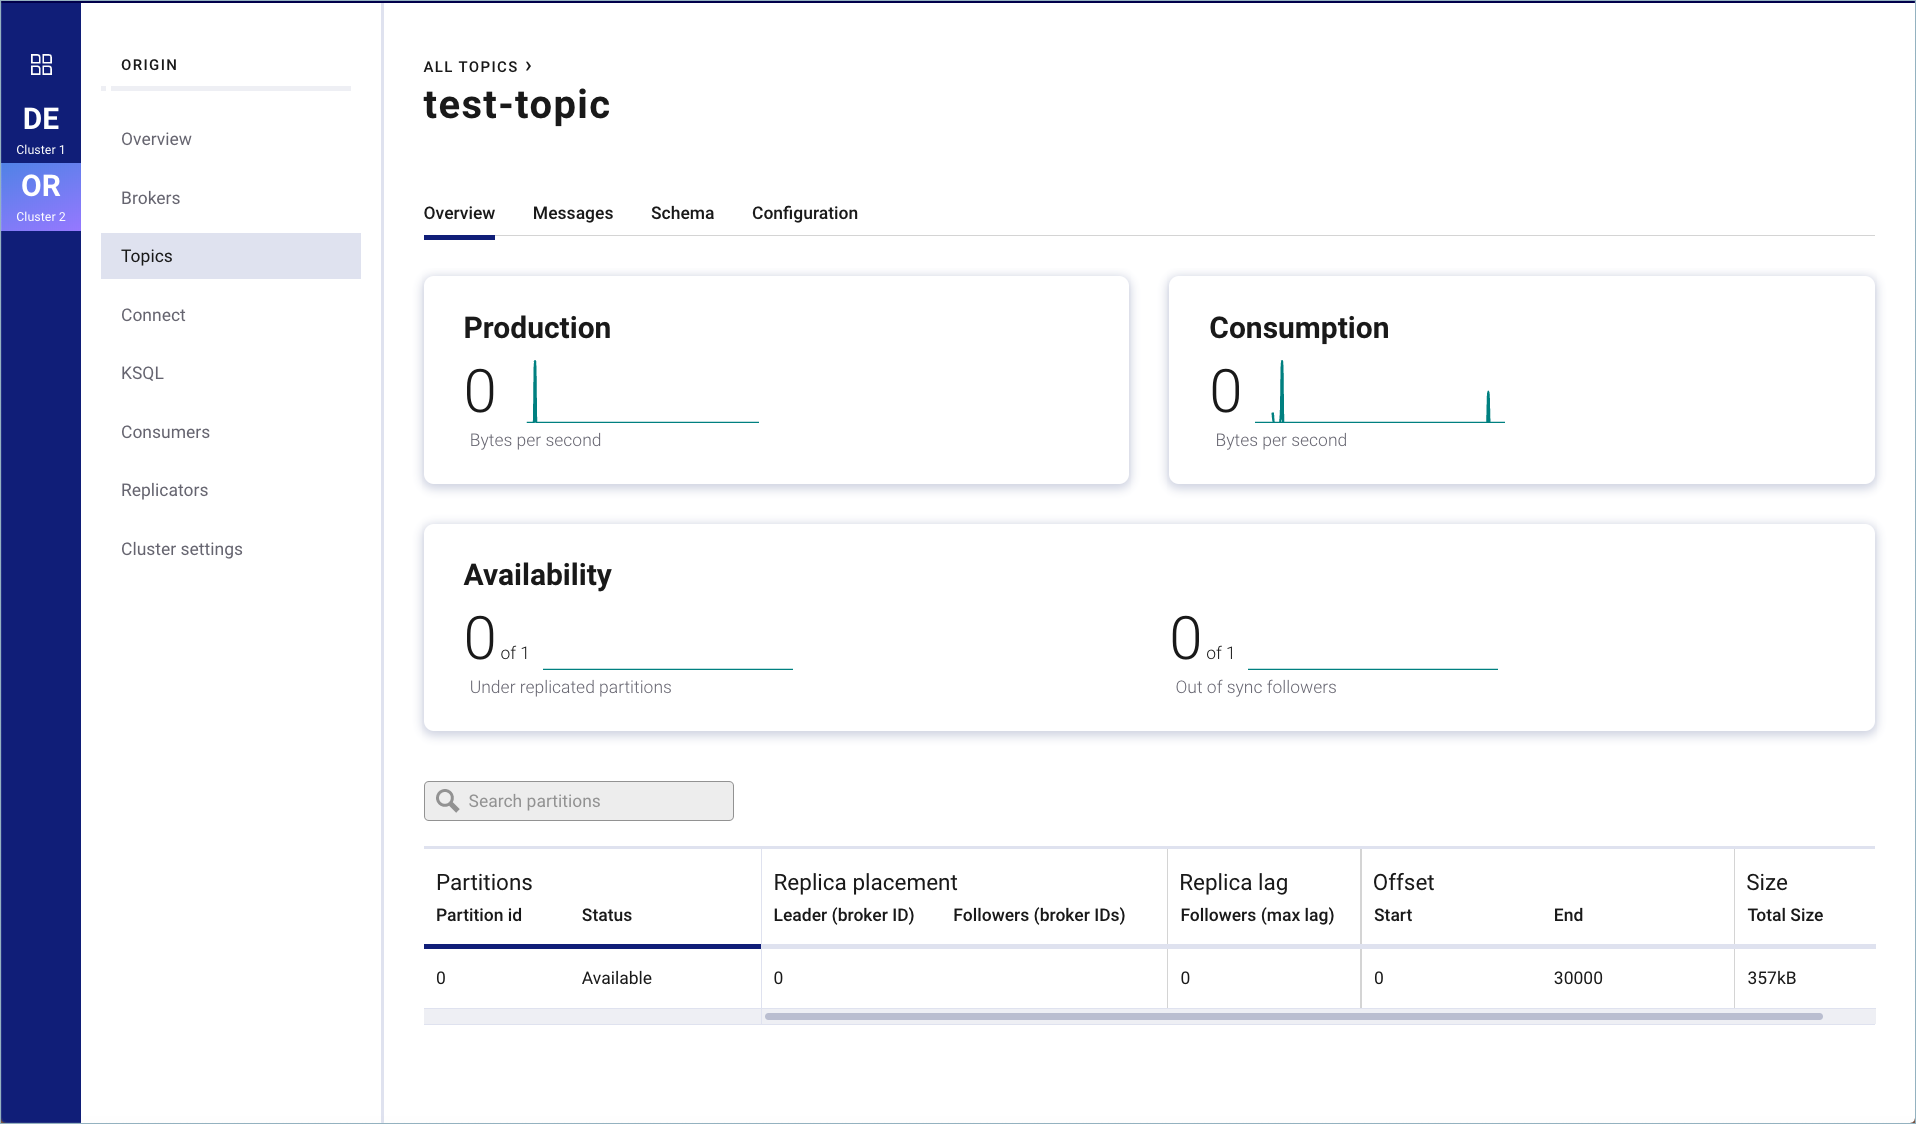
You have the same monitoring and configuration options on both source and replicated topics.
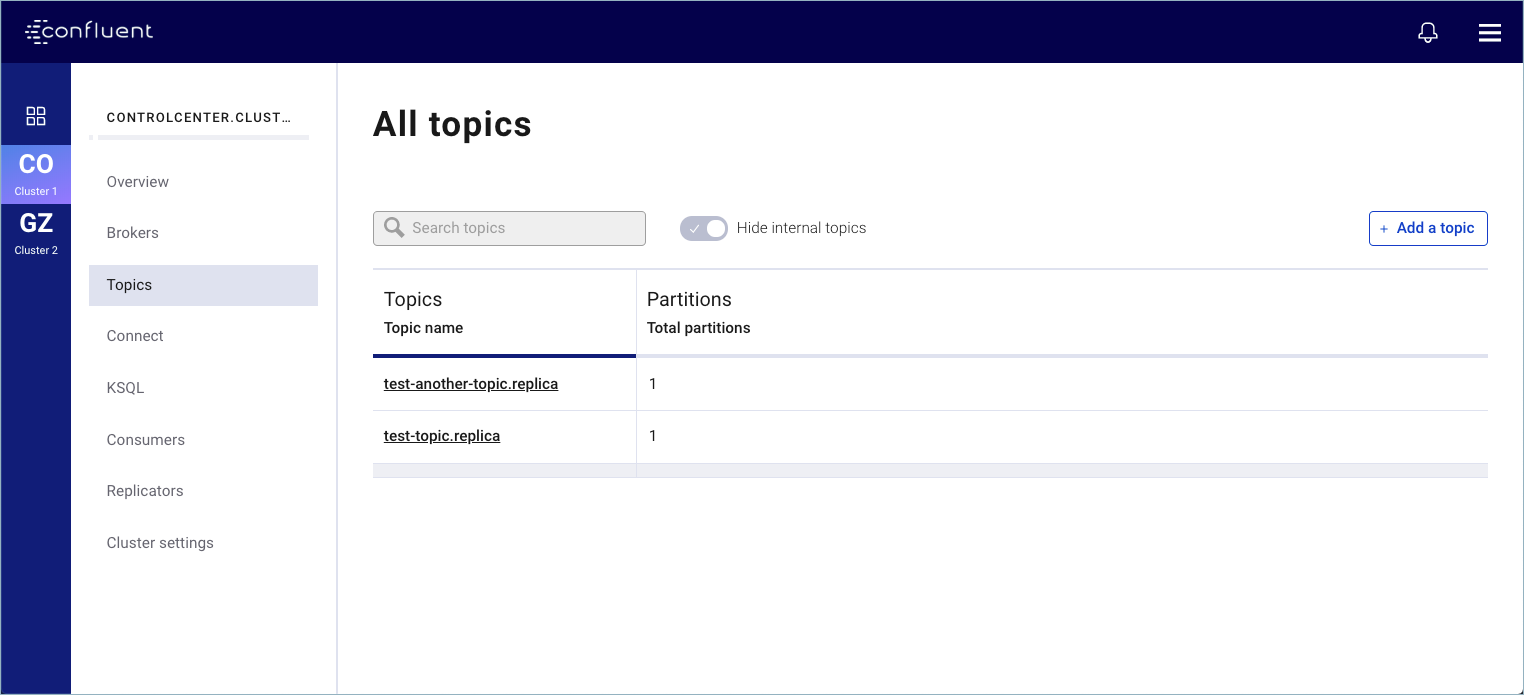
Replicated topics
To view details on a replicated topic (on the destination cluster), select the Destination cluster, then click Topics on the Control Center menu to show all topics in the cluster.
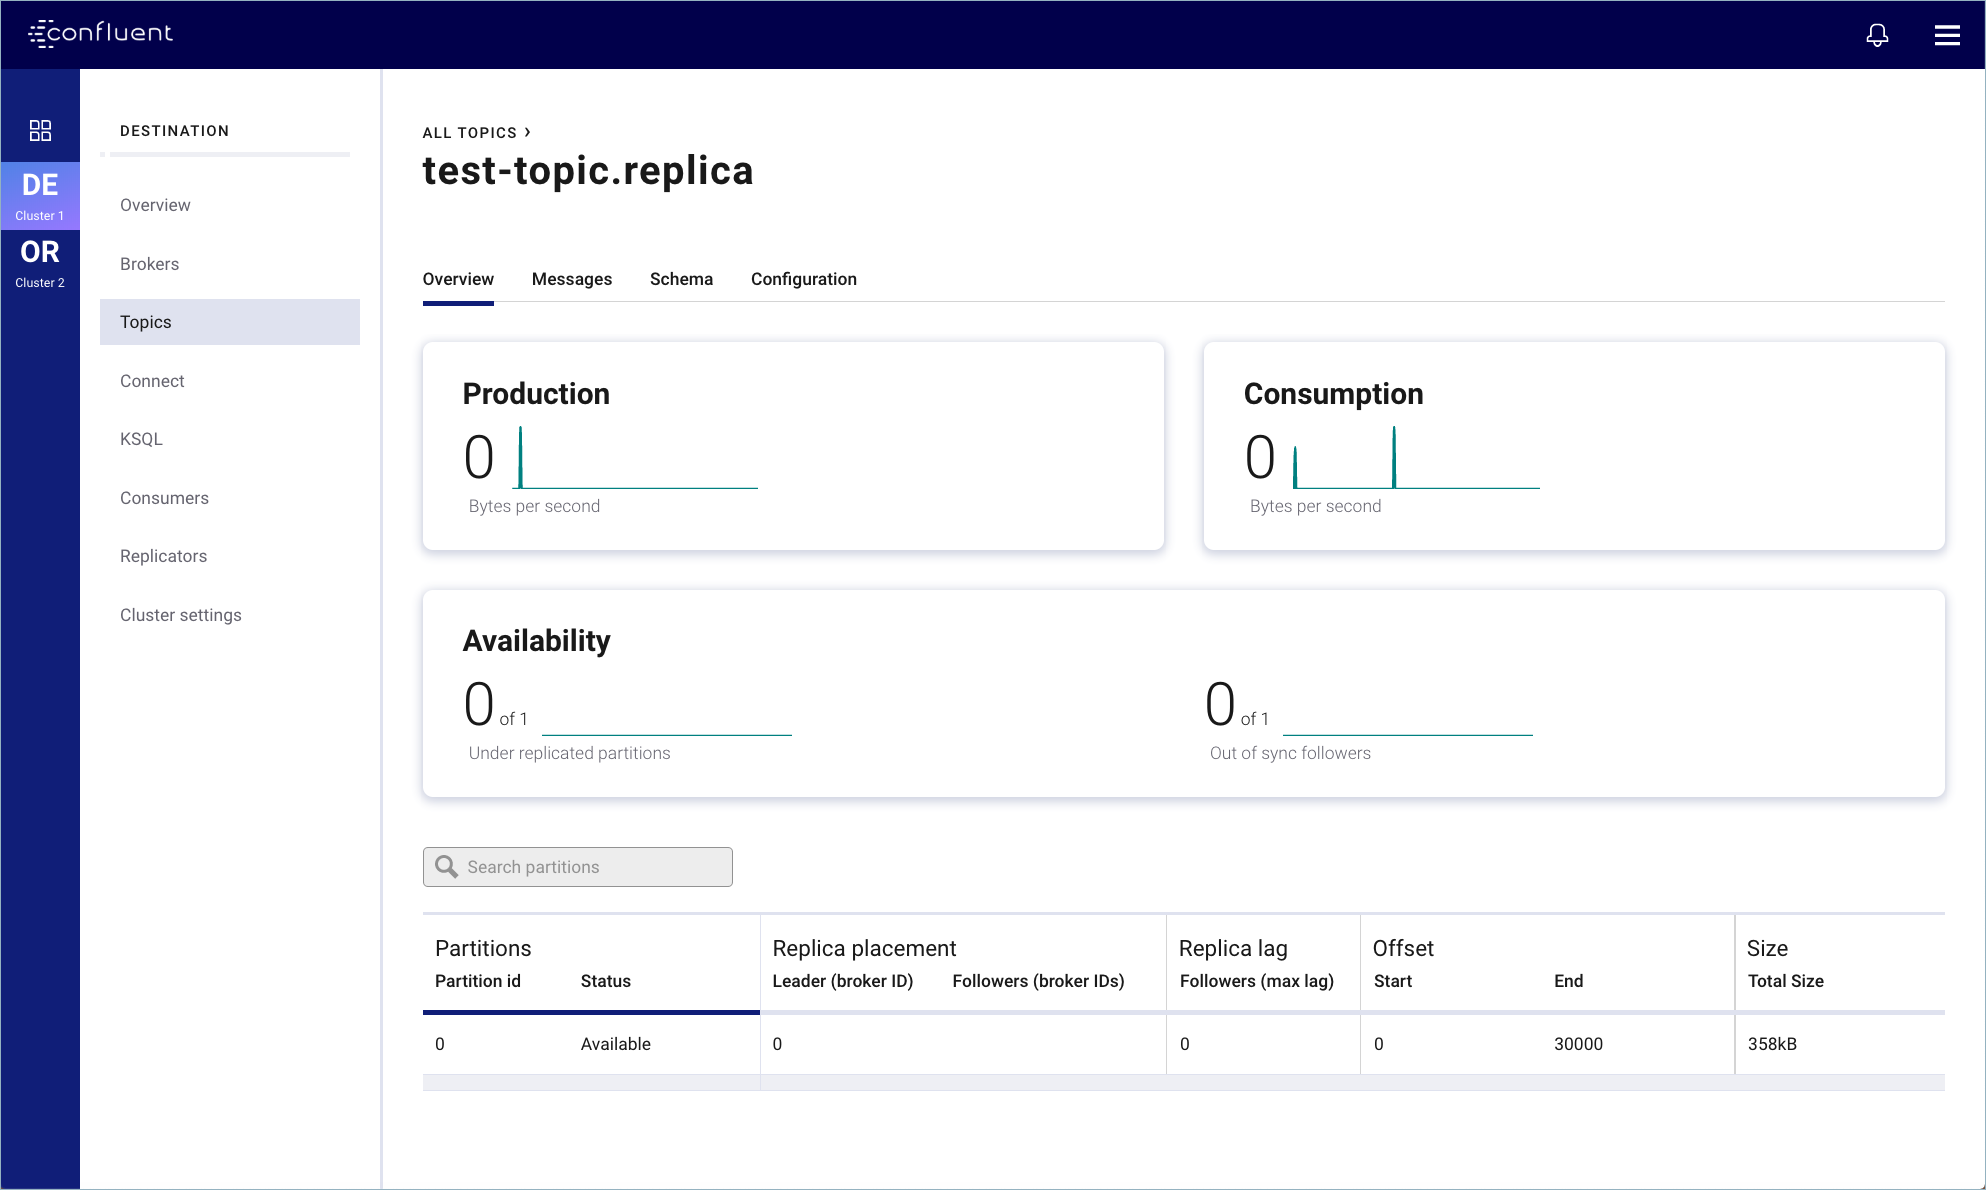
Click one of the replicas in the topic list to bring up the overview page for that topic.
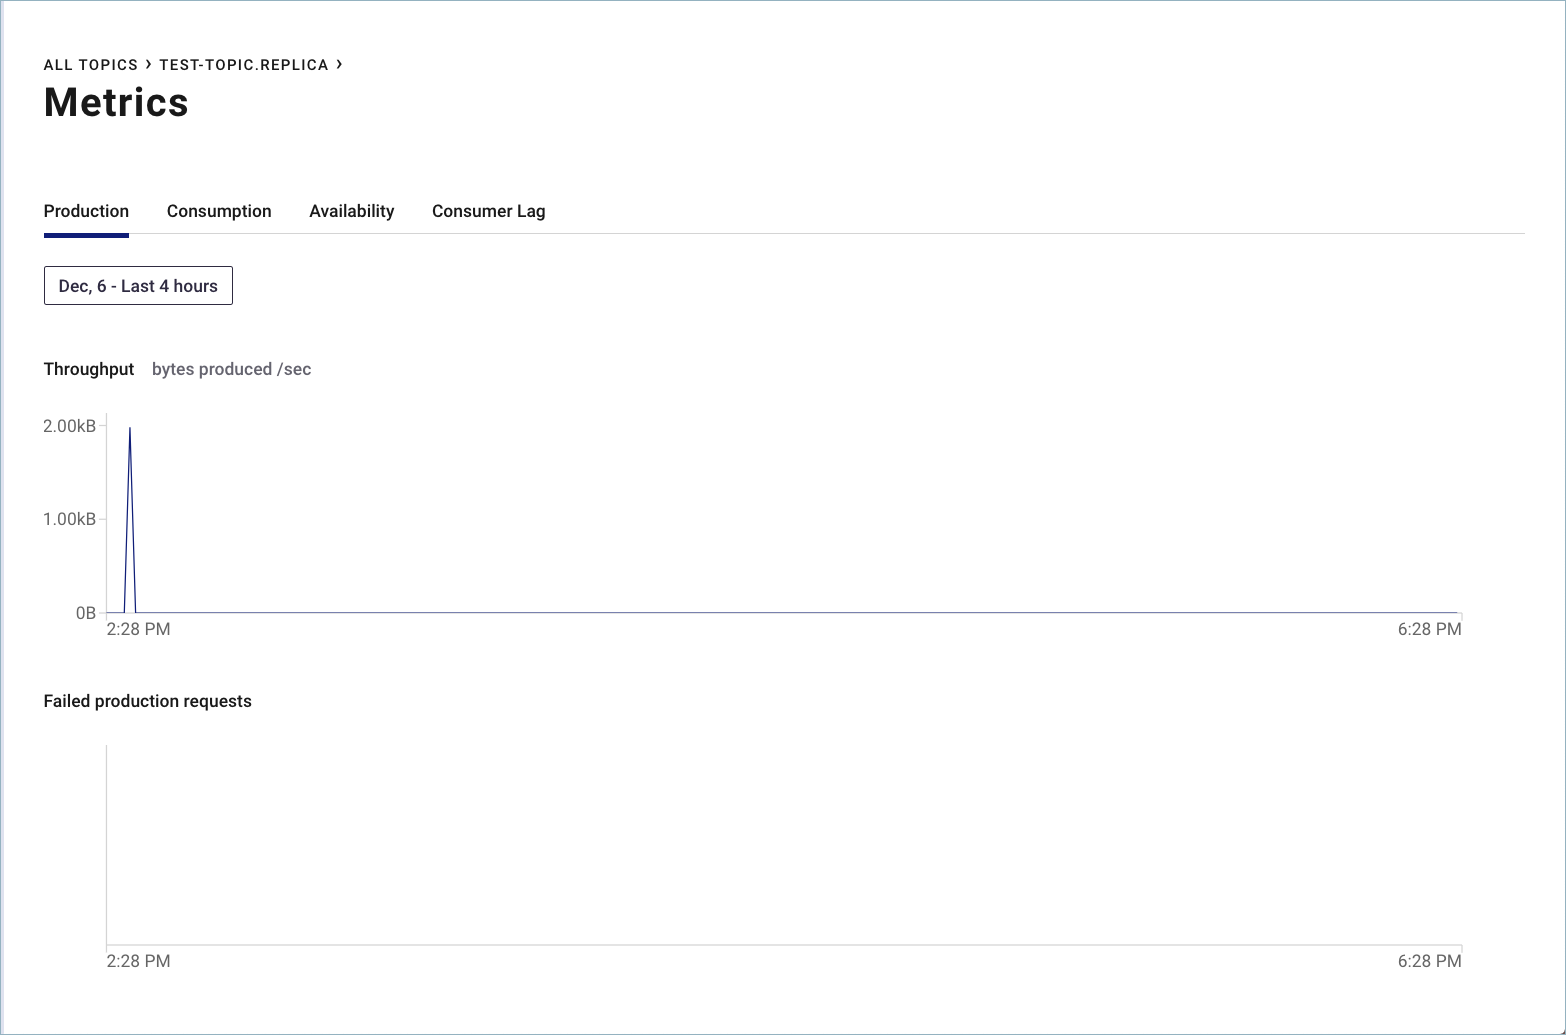
Click the metrics cards on the Overview tab to drill down on the monitoring data for that topic.
For example, click into Production to show production producer metrics.
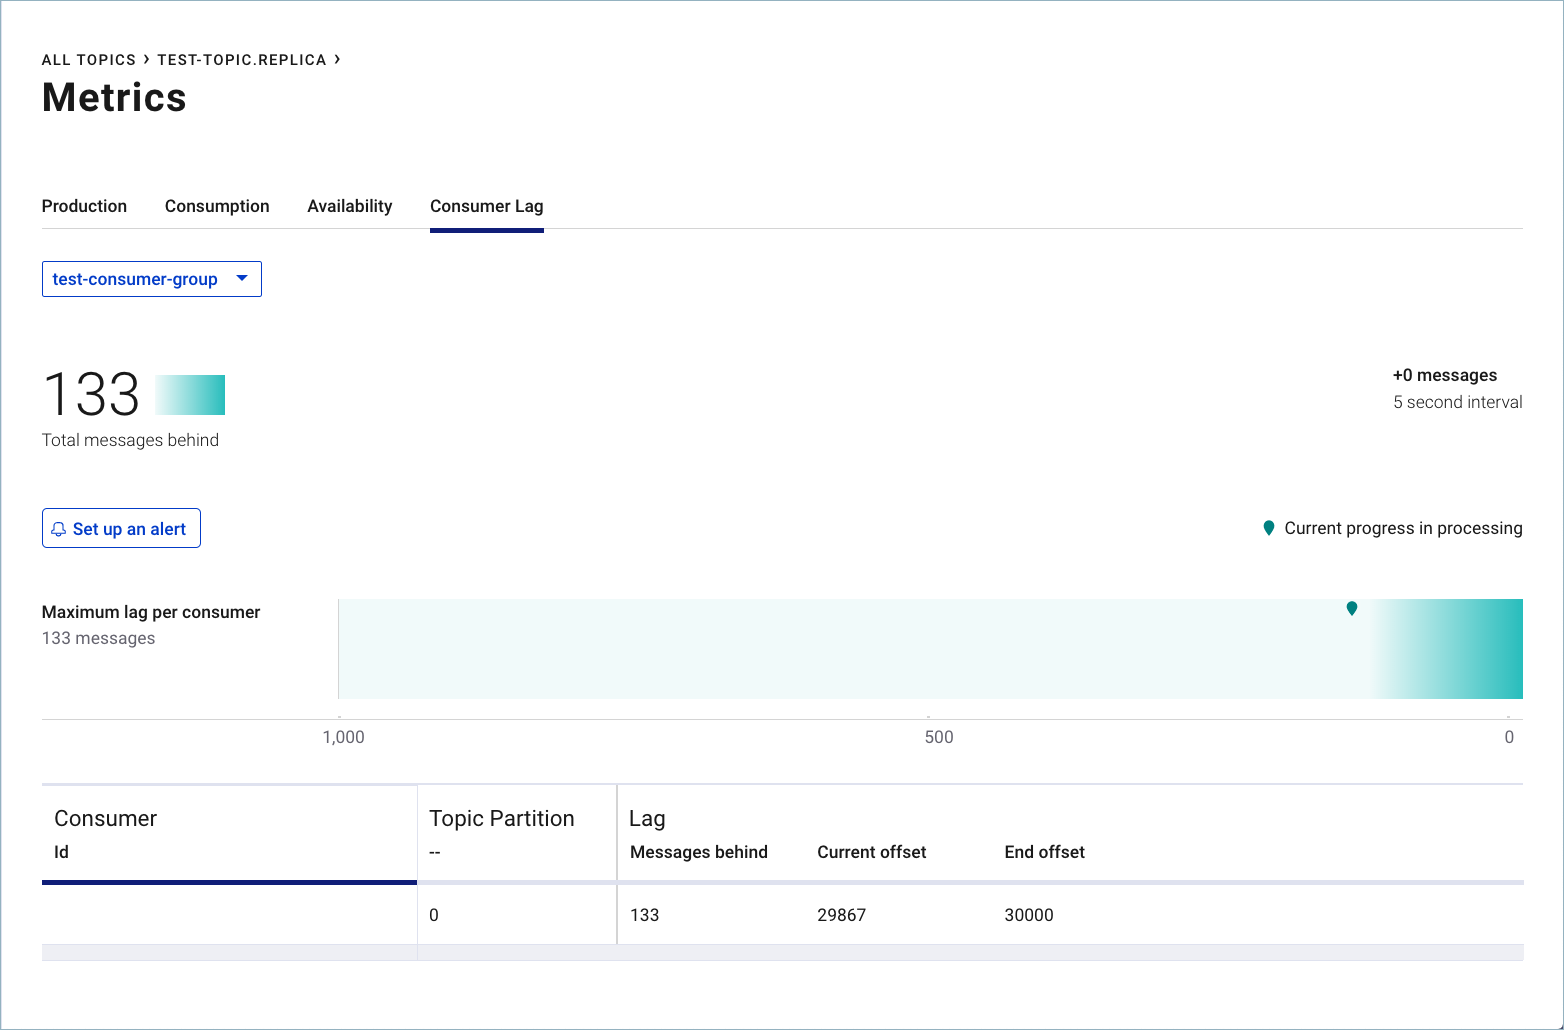
Click into Consumption to show various consumer metrics.
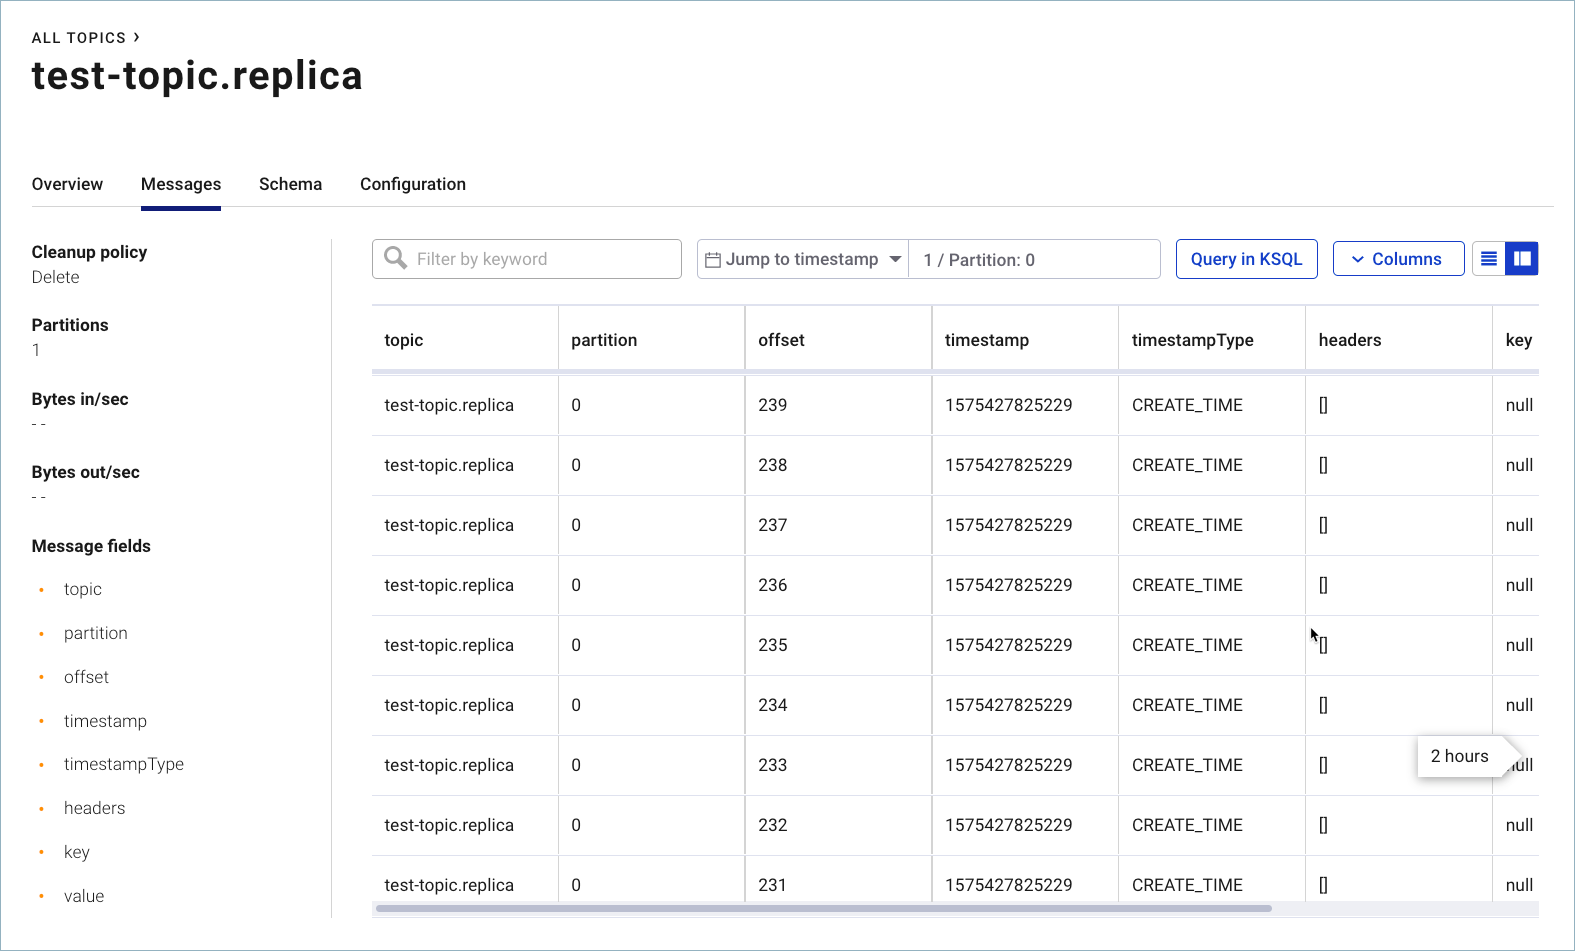
Navigate using the other tabs to view and manage details on the topic. For example, this page shows Messages associated with the replicated topic.
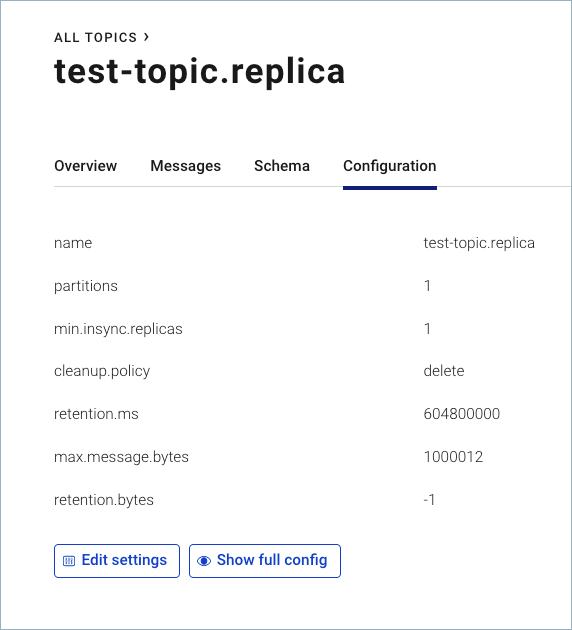
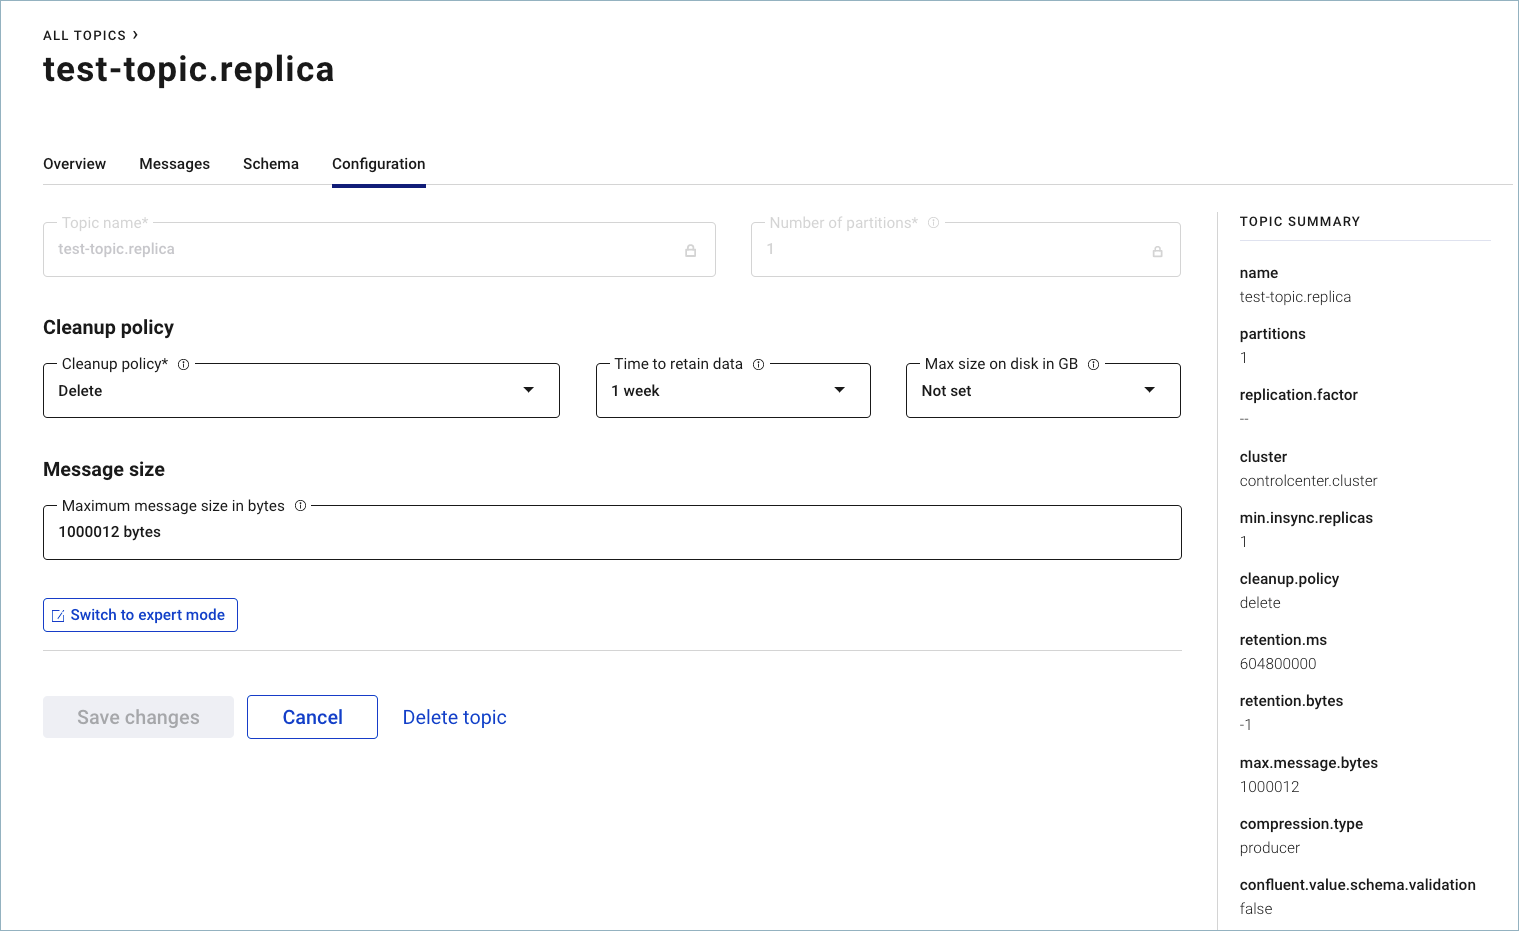
This page shows the topic configuration and provides options to re-configure it. (Click Show full config to get to advanced configuration options.)
You have the same monitoring and configuration options on both source and replicated topics.
To learn more about working with topics in Control Center, see Topics.