

Event tracking in Confluent Manager for Apache Flink
An event in Confluent Manager for Apache Flink (CMF) is a timestamped record of a state change in a Apache Flink® application or cluster. Events enable you to track the lifecycle and status of your Flink applications without accessing the Kubernetes cluster or Flink Web Interface.
Flink applications are deployed in Confluent Platform with CMF, which is a central management component of Confluent Platform for Apache Flink. CMF records its own lifecycle events and also surfaces events reported by the Confluent Platform for Apache Flink Kubernetes Operator, so you can diagnose deployment problems such as validation errors, image-pull failures, container crash loops, and autoscaler activity without inspecting the Kubernetes cluster directly.
Events tell you:
The time an event first occurred, and the time it most recently occurred.
How many times a recurring event has occurred.
The Flink application instance that the event is associated with.
What changed in the Flink application resource, and why.
The status of the Flink cluster.
By default, CMF stores a maximum of 100 of the most recent events per Flink
application. Recurring events are aggregated into a single record (see
Recurring events and occurrence counts), so a repeatedly failing application does not exhaust
this limit. You can change this limit by setting the
cmf.application-events.max-events-per-application property in your Helm values
when you install or upgrade CMF. When you delete a
Flink application, all associated events are also deleted.
Note that if you are using RBAC, you must have View permissions on the Flink application to view its events.
Event types tracked by CMF
You can use CMF to track the following events.
CMF Status:
Flink application resource creation.
Flink application resource updated.
Cluster status: Tracked from status.lifecycleState of the FlinkApplication:
CREATED: The resource was created in Kubernetes but not yet handled by the operator.
SUSPENDED: The (job) resource has been suspended.
UPGRADING: The resource is suspended before upgrading to a new spec.
DEPLOYED: The resource is deployed/submitted to Kubernetes, but it’s not yet considered to be stable and might be rolled back in the future.
STABLE: The resource deployment is considered to be stable and won’t be rolled back. This means the Flink cluster is healthy.
ROLLING_BACK: The resource is being rolled back to the last stable spec.
ROLLED_BACK: The resource is deployed with the last stable spec.
FAILED: The job terminally failed.
Flink Job status:
Any change to the Flink job status. Tracked from the
FlinkApplication.status.jobStatus.state.
Flink Exceptions: Any exception causing a restart of a Flink job will be tracked as an event.
Deployment events:
Operational conditions the Kubernetes Operator reports while deploying or
running an application, such as failed or missing deployments, image-pull
errors, and container crash loops. The specific condition is carried in
data.reason, and the raw operator message is preserved in data.message.
Common reasons include Missing, Error, RecoverDeployment,
RestartUnhealthyJob, CrashLoopBackOff, and ErrImagePull.
Autoscaler events:
Activity reported by the Flink autoscaler when enabled for an application, such as
scaling decisions and scaling problems, reported with reasons such as
ScalingReport, ScalingLimited, and AutoscalerError.
Recurring events and occurrence counts
CMF identifies each event by its reason and message, incrementing that record’s
count when the Kubernetes Operator reports the same event again rather than
storing a new one, so an event with a different message is a separate record even
when the reason is the same. A recurring job exception, for example, stays as one
record whose count climbs each time it repeats. Every event reports:
status.count: the number of times this event has been reported. It is1unless the same event recurs.metadata.updateTimestamp: the time of the most recent occurrence.metadata.creationTimestampremains the time of the first occurrence.
Aggregation lets you see both when a problem first appeared and how often it recurs, while keeping a flapping application from flooding the event history. When the per-application limit is reached, CMF evicts the events with the oldest most-recent-occurrence first, so an actively recurring event is retained over a stale one.
View events with the CMF UI
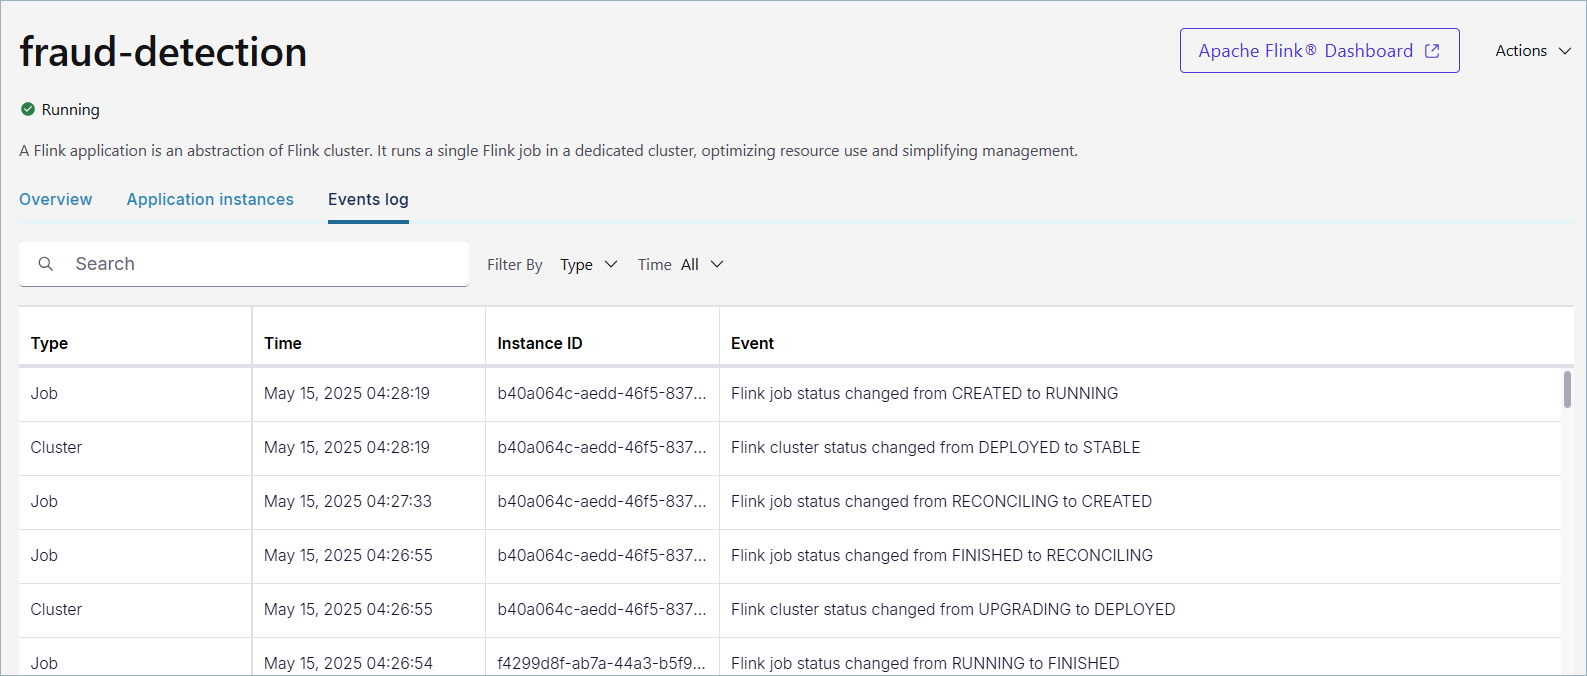
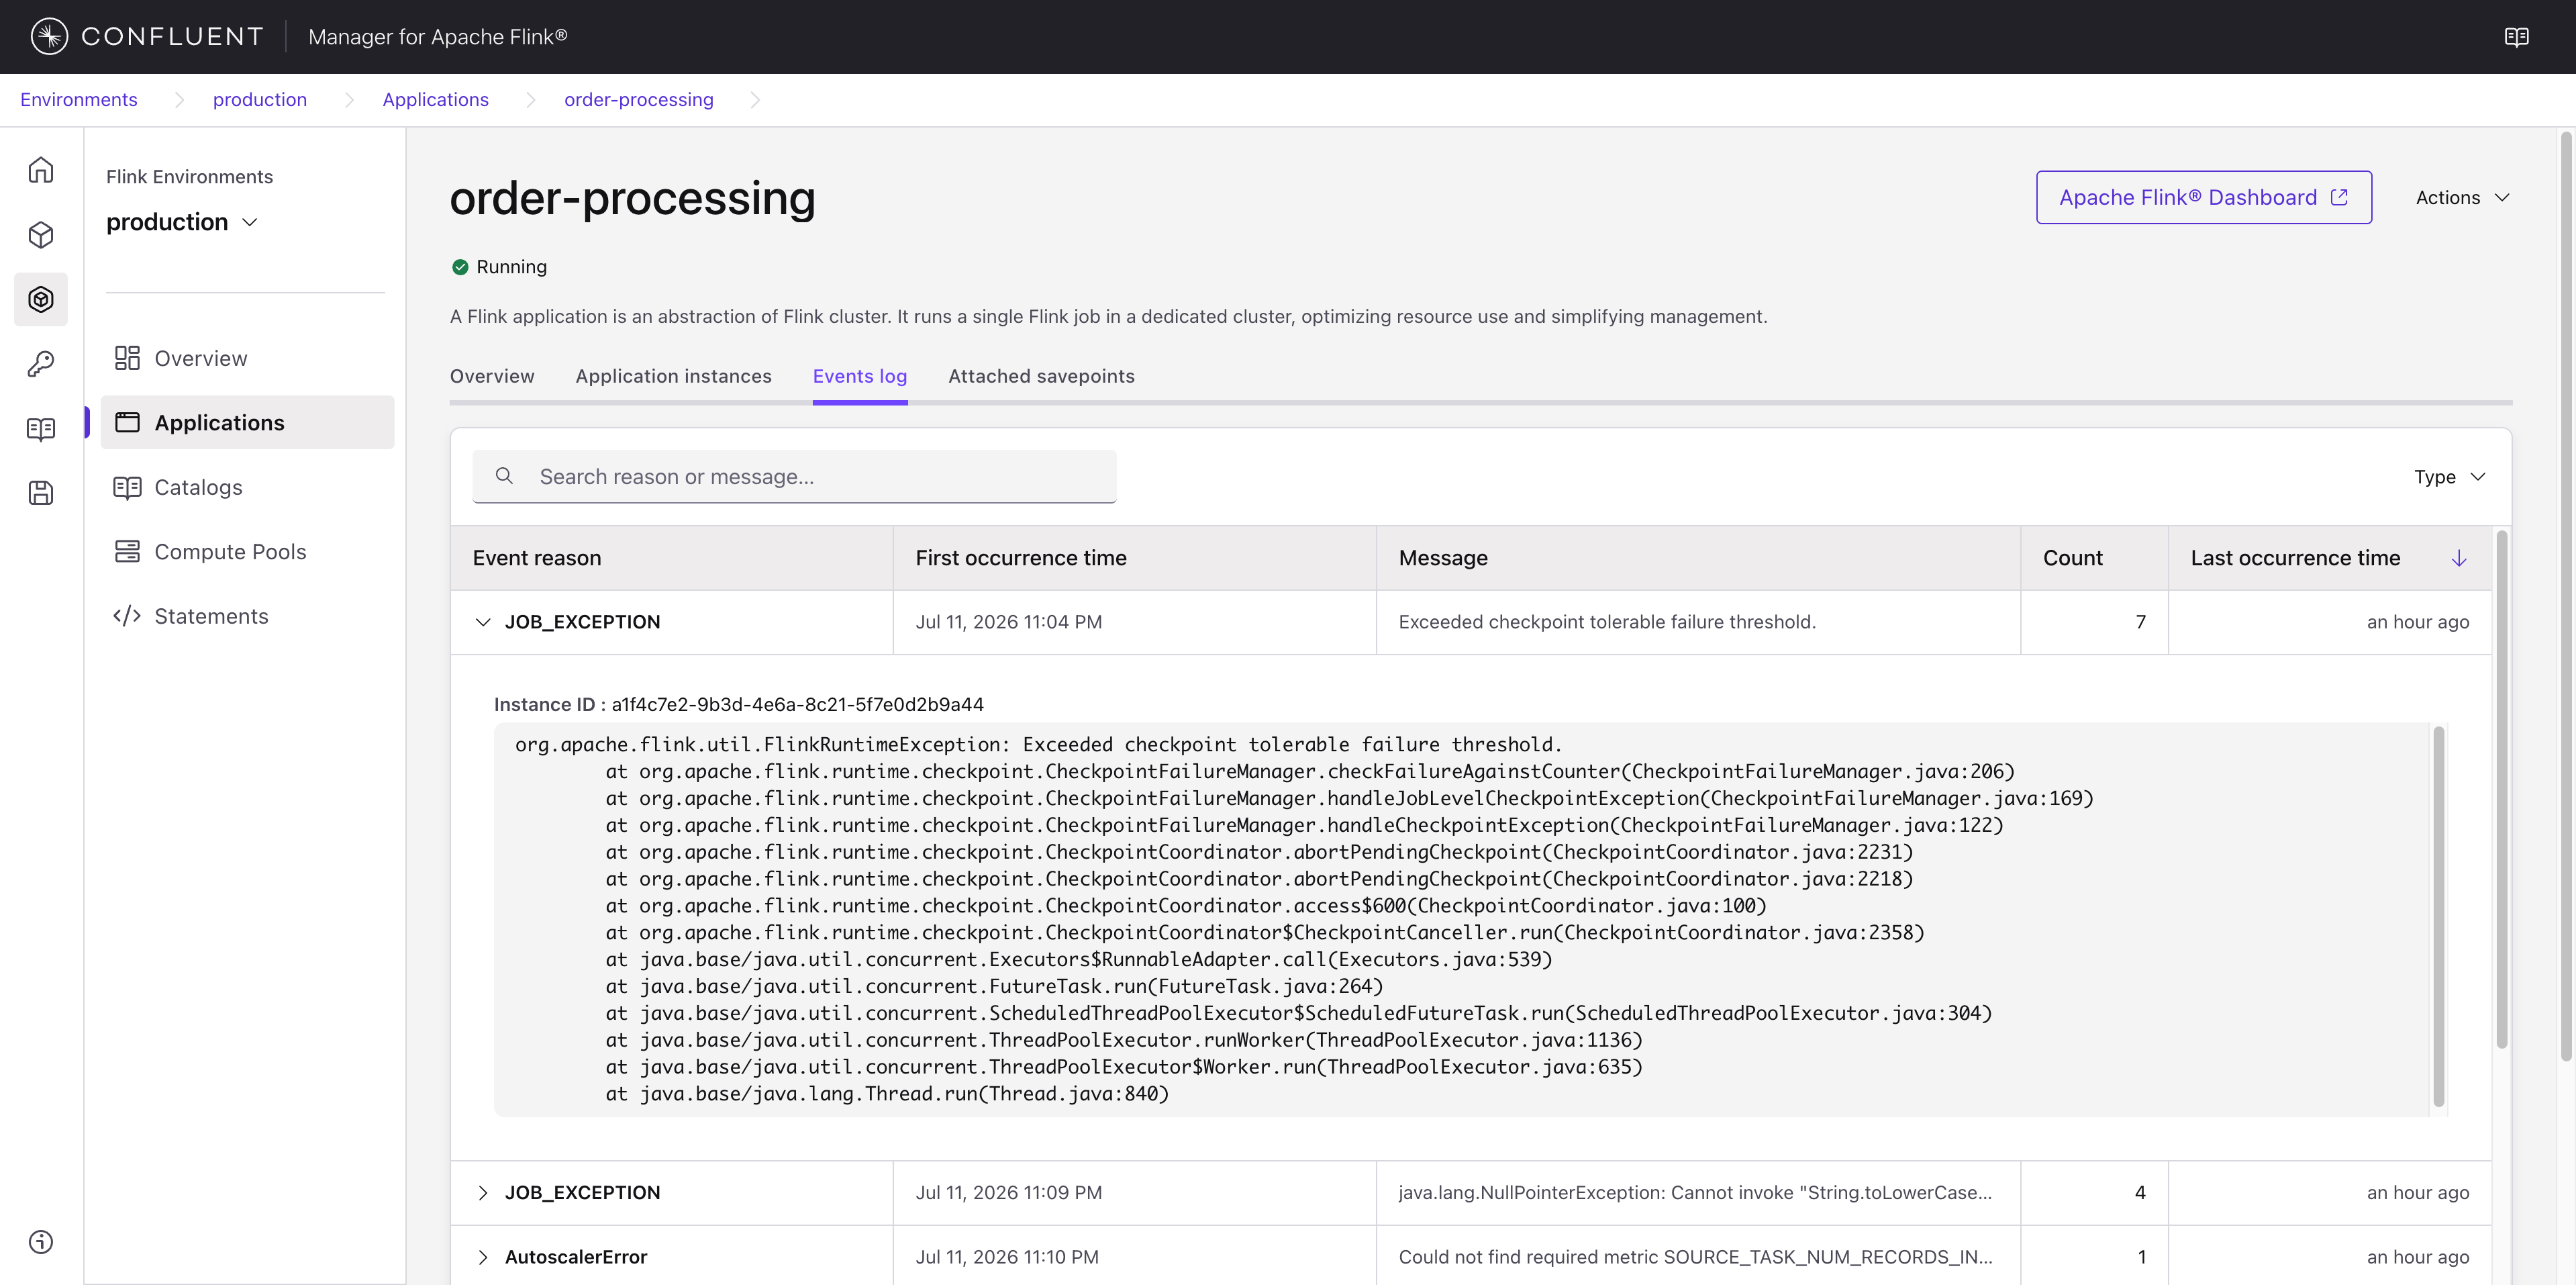
You can view events in the CMF UI on the Events log tab of an application’s details page. The table shows one row per event, with the following columns:
Event reason: the reason reported for the event.
First occurrence time: when the event first occurred.
Message: a summary of the event.
Count: how many times the event has occurred.
Last occurrence time: when the event most recently occurred.
Use the Type filter to show only a specific category of event, such as deployment events, autoscaler events, or job exceptions, and use the search box to match on the reason or message. You can sort the table by Count or Last occurrence time.
Select an event to expand it and see the full message, including any stack trace, along with the Flink application instance ID:
Get events with the REST API
You can also use the events REST API to determine the status of your Flink applications and clusters. For example, you can use the following command to get a list of events for a specific Flink application:
GET /cmf/api/v1alpha1/environments/{envName}/applications/{appName}/events
An example response might look like the following:
{
  "pageable": null,
  "metadata": {
    "size": 3
  },
  "items": [
    {
      "apiVersion": "cmf.confluent.io/v1alpha1",
      "kind": "FlinkApplicationEvent",
      "metadata": {
        "name": "b3d1c2a4-7f6e-4a1b-9c8d-2e5f0a1b2c3d",
        "uid": "b3d1c2a4-7f6e-4a1b-9c8d-2e5f0a1b2c3d",
        "creationTimestamp": "2026-06-18T11:10:02.000Z",
        "updateTimestamp": "2026-06-18T11:10:02.000Z",
        "flinkApplicationInstance": "9f118068-3855-4442-919f-2007338a88b2",
        "labels": null,
        "annotations": null
      },
      "status": {
        "message": "CrashLoopBackOff: back-off restarting failed container",
        "type": "DEPLOYMENT_EVENT",
        "count": 1,
        "data": {
          "reason": "CrashLoopBackOff",
          "message": "back-off 40s restarting failed container=flink-main-container pod=fraud-detection-6d9c7f9b8c-abcde"
        }
      }
    },
    {
      "apiVersion": "cmf.confluent.io/v1alpha1",
      "kind": "FlinkApplicationEvent",
      "metadata": {
        "name": "77d37980-4798-437b-8850-1ecd6b612ade",
        "uid": "77d37980-4798-437b-8850-1ecd6b612ade",
        "creationTimestamp": "2026-06-18T11:05:00.000Z",
        "updateTimestamp": "2026-06-18T11:16:38.061Z",
        "flinkApplicationInstance": "9f118068-3855-4442-919f-2007338a88b2",
        "labels": null,
        "annotations": null
      },
      "status": {
        "message": "Exceeded checkpoint tolerable failure threshold.",
        "type": "JOB_EXCEPTION",
        "count": 5,
        "data": {
          "exceptionString": "org.apache.flink.util.FlinkRuntimeException: Exceeded checkpoint tolerable failure threshold.\n\tat org.apache.flink.runtime.checkpoint.CheckpointFailureManager.checkFailureAgainstCounter(CheckpointFailureManager.java:206)"
        }
      }
    },
    {
      "apiVersion": "cmf.confluent.io/v1alpha1",
      "kind": "FlinkApplicationEvent",
      "metadata": {
        "name": "27102d2e-18f1-4135-a49e-62bd423c5023",
        "uid": "27102d2e-18f1-4135-a49e-62bd423c5023",
        "creationTimestamp": "2026-06-18T11:16:35.435Z",
        "updateTimestamp": "2026-06-18T11:16:35.435Z",
        "flinkApplicationInstance": null,
        "labels": null,
        "annotations": null
      },
      "status": {
        "message": "FlinkApplication created",
        "type": "CMF_STATUS",
        "count": 1,
        "data": null
      }
    }
  ]
}
To return only certain event types, or to sort by occurrence count or most recent
occurrence, add the filter and sort query parameters:
GET /cmf/api/v1alpha1/environments/{envName}/applications/{appName}/events?filter=type in (DEPLOYMENT_EVENT, AUTOSCALER_EVENT)&sort=count,desc