Important
You are viewing documentation for an older version of Confluent Platform. For the latest, click here.
Alerts navigation
Alerts Overview page
To access the Alerts Overview page, click the Alerts bell icon in the top banner. The icon appears in a light green focus thereafter until exiting the Alerts area.
The Alerts page has the following main sections, accessible by clicking the tabs:
- HISTORY - Historical alert log
- TRIGGERS - Trigger management
- ACTIONS - Actions management
- REST API - REST API for alerts history
Alerts History
To access the Alerts History page, click the Alerts ![]() icon in the top banner.
icon in the top banner.
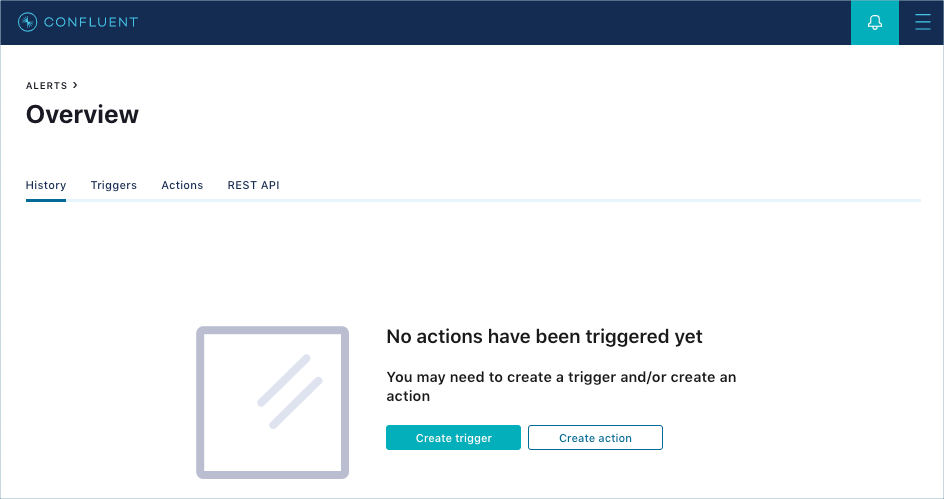
The Alerts page opens to the History tab by default. The page is blank when there isn’t any triggered history yet.
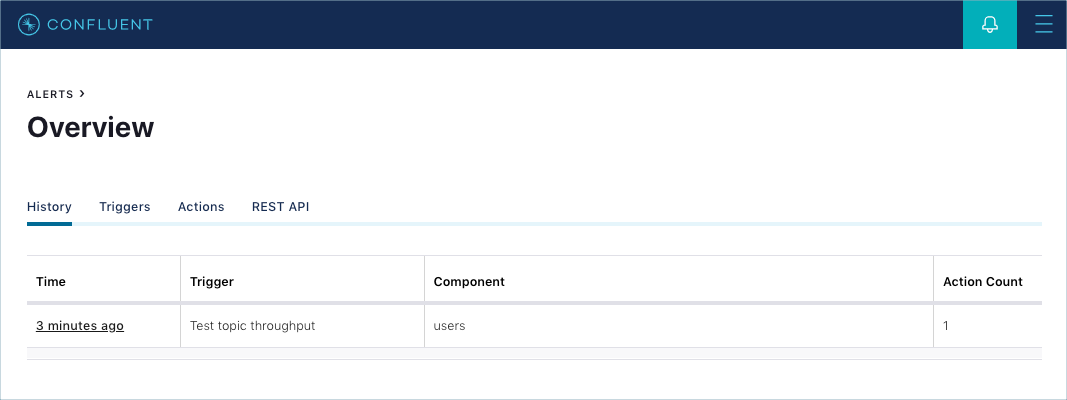
After actions have been triggered, the History page shows a summary of triggers that caused an action to be executed.
The History table shows the Time that the alert occurred, the Trigger that fired, the Component, and the number of Actions that were activated in Action Count.
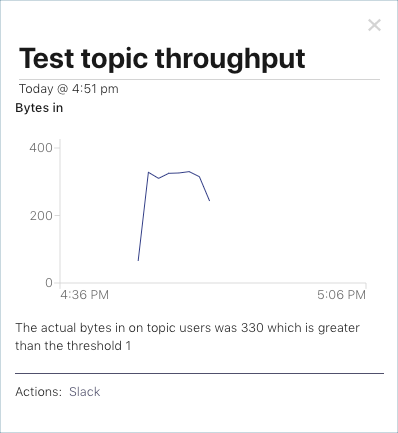
Click a link in the Time column to view more details for a triggered alert. Depending on the type of alert, there could be both a chart and text or just text.
The date and time the alert was triggered and the action that was sent for the trigger are displayed. The threshold information for the trigger is provided.
The alert history does not list every triggered event:
- Any alerts triggered by consumer lag, cluster status, or broker status events do not populate history. Alert emails sent do not contain an email link to alerts history.
- Only alerts triggered by topic status events (streams topology) populate history.
Alert emails are sent that contain
an email link to alerts history, as configured in
confluent.controlcenter.rest.listeners.


