Important
You are viewing documentation for an older version of Confluent Platform. For the latest, click here.
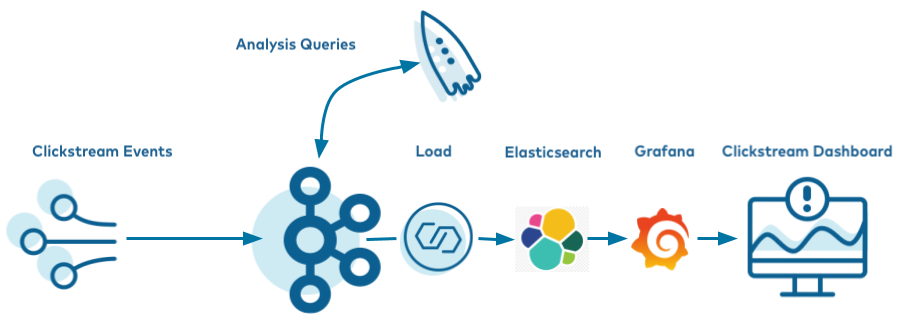
Clickstream Data Analysis Pipeline Using ksqlDB
These steps will guide you through how to setup your environment and run the clickstream analysis tutorial from a Docker container.
- Prerequisites:
- Docker:
- Docker version 1.11 or later is installed and running.
- Docker Compose is installed. Docker Compose is installed by default with Docker for Mac.
- Docker memory is allocated minimally at 8 GB. When using Docker Desktop for Mac, the default Docker memory allocation is 2 GB. You can change the default allocation to 8 GB in Docker > Preferences > Advanced.
- Git.
- Internet connectivity.
- Ensure you are on an Operating System currently supported by Confluent Platform.
- Networking and Kafka on Docker: Configure your hosts and ports to allow both internal and external components to the Docker network to communicate. For more details, see this article.
- Docker:
- If you are using Linux as your host, for the Elasticsearch container to start successfully you must first run:
sudo sysctl -w vm.max_map_count=262144
Download and run the tutorial
The tutorial is built using Docker Compose. It brings together several Docker images with the required networking and dependencies. The images are quite large and depending on your network connection may take 10-15 minutes to download.
Clone the Confluent examples repository.
git clone https://github.com/confluentinc/examples.git
Navigate to the
examples/clickstreamdirectory and switch to the Confluent Platform release branch:cd examples/clickstream git checkout 5.5.15-post
If you want to manually step through the Clickstream tutorial, which is advised for new users who want to gain familiarity with Confluent Platform, skip ahead to the next section. Alternatively, you can run the full solution end-to-end with this script, which automates all the steps in the tutorial:
./start.sh
Startup
Get the Jar files for
kafka-connect-datagen(source connector) andkafka-connect-elasticsearch(sink connector).docker run -v $PWD/confluent-hub-components:/share/confluent-hub-components confluentinc/ksqldb-server:0.8.0 confluent-hub install --no-prompt confluentinc/kafka-connect-datagen:0.3.2 docker run -v $PWD/confluent-hub-components:/share/confluent-hub-components confluentinc/ksqldb-server:0.8.0 confluent-hub install --no-prompt confluentinc/kafka-connect-elasticsearch:latest
Launch the tutorial in Docker.
docker-compose up -d
After a minute or so, run the
docker-compose psstatus command to ensure that everything has started correctly:docker-compose ps
Your output should resemble:
     Name                    Command               State                       Ports
---------------------------------------------------------------------------------------------------------
control-center    /etc/confluent/docker/run        Up      0.0.0.0:9021->9021/tcp
elasticsearch     /usr/local/bin/docker-entr ...   Up      0.0.0.0:9200->9200/tcp, 9300/tcp
grafana           /run.sh                          Up      0.0.0.0:3000->3000/tcp
kafka             /etc/confluent/docker/run        Up      9092/tcp
ksqldb-cli        /bin/sh                          Up
ksqldb-server     bash -c # Manually install ...   Up      0.0.0.0:8083->8083/tcp, 0.0.0.0:8088->8088/tcp
schema-registry   /etc/confluent/docker/run        Up      8081/tcp
tools             /bin/bash                        Up
zookeeper         /etc/confluent/docker/run        Up      2181/tcp, 2888/tcp, 3888/tcp
Create the Clickstream Data
Once you’ve confirmed all the Docker containers are running, create the source connectors that generate mock data. This demo leverages the embedded Connect worker in ksqlDB.
Launch the ksqlDB CLI:
docker-compose exec ksqldb-cli ksql http://ksqldb-server:8088
Run the script create-connectors.sql that executes the ksqlDB statements to create three source connectors for generating mock data.
RUN SCRIPT '/scripts/create-connectors.sql';
The output will show either a blank message, or
Executing statement, similar to this:Message --------- Executing statement ---------
After the
RUN SCRIPTcommand completes, exit out of theksqldb-cliwith aCTRL+DcommandNow the clickstream generator is running, simulating the stream of clicks. Sample these messages in
clickstream:docker-compose exec tools confluent local consume clickstream -- --bootstrap-server kafka:29092 --property print.key=true --max-messages 5
Your output should resemble:
122.245.174.122   {"ip":"122.245.174.122","userid":30,"remote_user":"-","time":"20/Mar/2020:02:05:52 +0000","_time":1584669952042,"request":"GET /images/logo-small.png HTTP/1.1","status":"200","bytes":"14096","referrer":"-","agent":"Mozilla/5.0 (Windows NT 10.0; Win64; x64) AppleWebKit/537.36 (KHTML, like Gecko) Chrome/59.0.3071.115 Safari/537.36"}
122.245.174.122   {"ip":"122.245.174.122","userid":30,"remote_user":"-","time":"20/Mar/2020:02:05:52 +0000","_time":1584669952042,"request":"GET /index.html HTTP/1.1","status":"407","bytes":"4196","referrer":"-","agent":"Mozilla/5.0 (Windows NT 10.0; Win64; x64) AppleWebKit/537.36 (KHTML, like Gecko) Chrome/59.0.3071.115 Safari/537.36"}
122.245.174.122   {"ip":"122.245.174.122","userid":30,"remote_user":"-","time":"20/Mar/2020:02:05:52 +0000","_time":1584669952042,"request":"GET /site/login.html HTTP/1.1","status":"406","bytes":"4006","referrer":"-","agent":"Mozilla/5.0 (Windows NT 10.0; Win64; x64) AppleWebKit/537.36 (KHTML, like Gecko) Chrome/59.0.3071.115 Safari/537.36"}
...
The second data generator running is for the HTTP status codes. Samples these messages in
clickstream_codes:docker-compose exec tools confluent local consume clickstream_codes -- --bootstrap-server kafka:29092 --from-beginning --property print.key=true --property key.deserializer=org.apache.kafka.common.serialization.IntegerDeserializer --max-messages 3
Your output should resemble:
406      {"code":406,"definition":"Not acceptable"}
302      {"code":302,"definition":"Redirect"}
302      {"code":302,"definition":"Redirect"}
The third data generator is for the user information. Samples these messages in
clickstream_users:docker-compose exec tools confluent local consume clickstream_users -- --bootstrap-server kafka:29092 --from-beginning --property print.key=true --property key.deserializer=org.apache.kafka.common.serialization.IntegerDeserializer --max-messages 3
Your output should resemble:
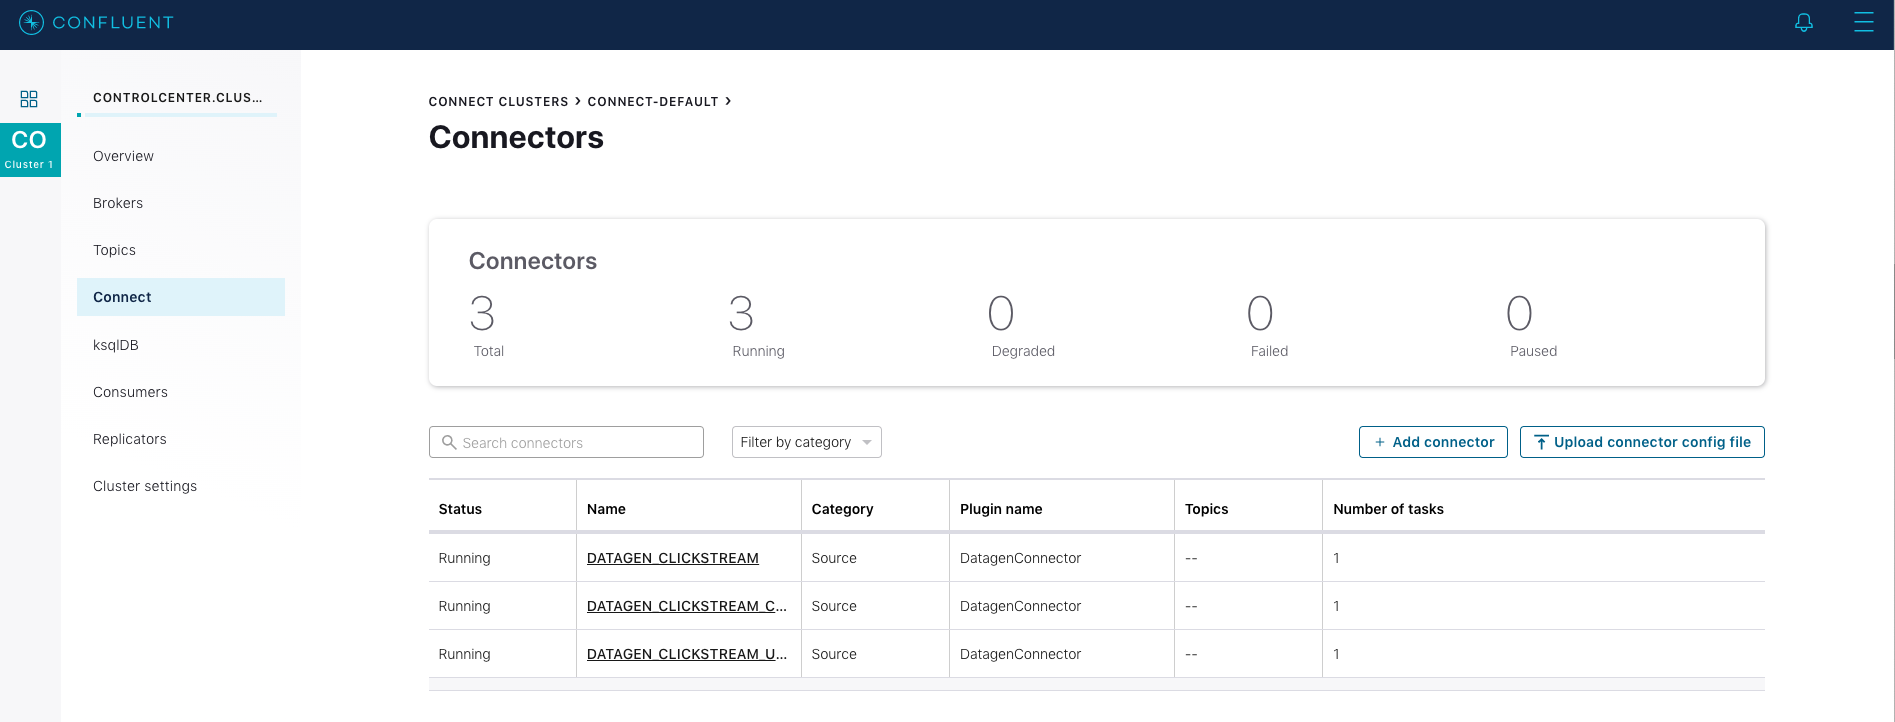
1        {"user_id":1,"username":"Ferd88","registered_at":1490759617459,"first_name":"Curran","last_name":"Vanyard","city":"Palo Alto","level":"Gold"}
2        {"user_id":2,"username":"bobk_43","registered_at":1457530469406,"first_name":"Antonio","last_name":"De Banke","city":"London","level":"Platinum"}
3        {"user_id":3,"username":"Ferd88","registered_at":1481373367271,"first_name":"Dimitri","last_name":"Jushcke","city":"Raleigh","level":"Silver"}
Go to Confluent Control Center UI at http://localhost:9021 and view the three kafka-connect-datagen source connectors created with the ksqlDB CLI.
Load the Streaming Data to ksqlDB
Launch the ksqlDB CLI:
docker-compose exec ksqldb-cli ksql http://ksqldb-server:8088
Load the statements.sql file that runs the tutorial app.
Important: Before running this step, you must have already run ksql-datagen utility to create the clickstream data, status codes, and set of users.
RUN SCRIPT '/scripts/statements.sql';
The output will show either a blank message, or
Executing statement, similar to this:Message --------- Executing statement ---------
Verify the data
Go to Confluent Control Center UI at http://localhost:9021, and view the ksqlDB view
Flow.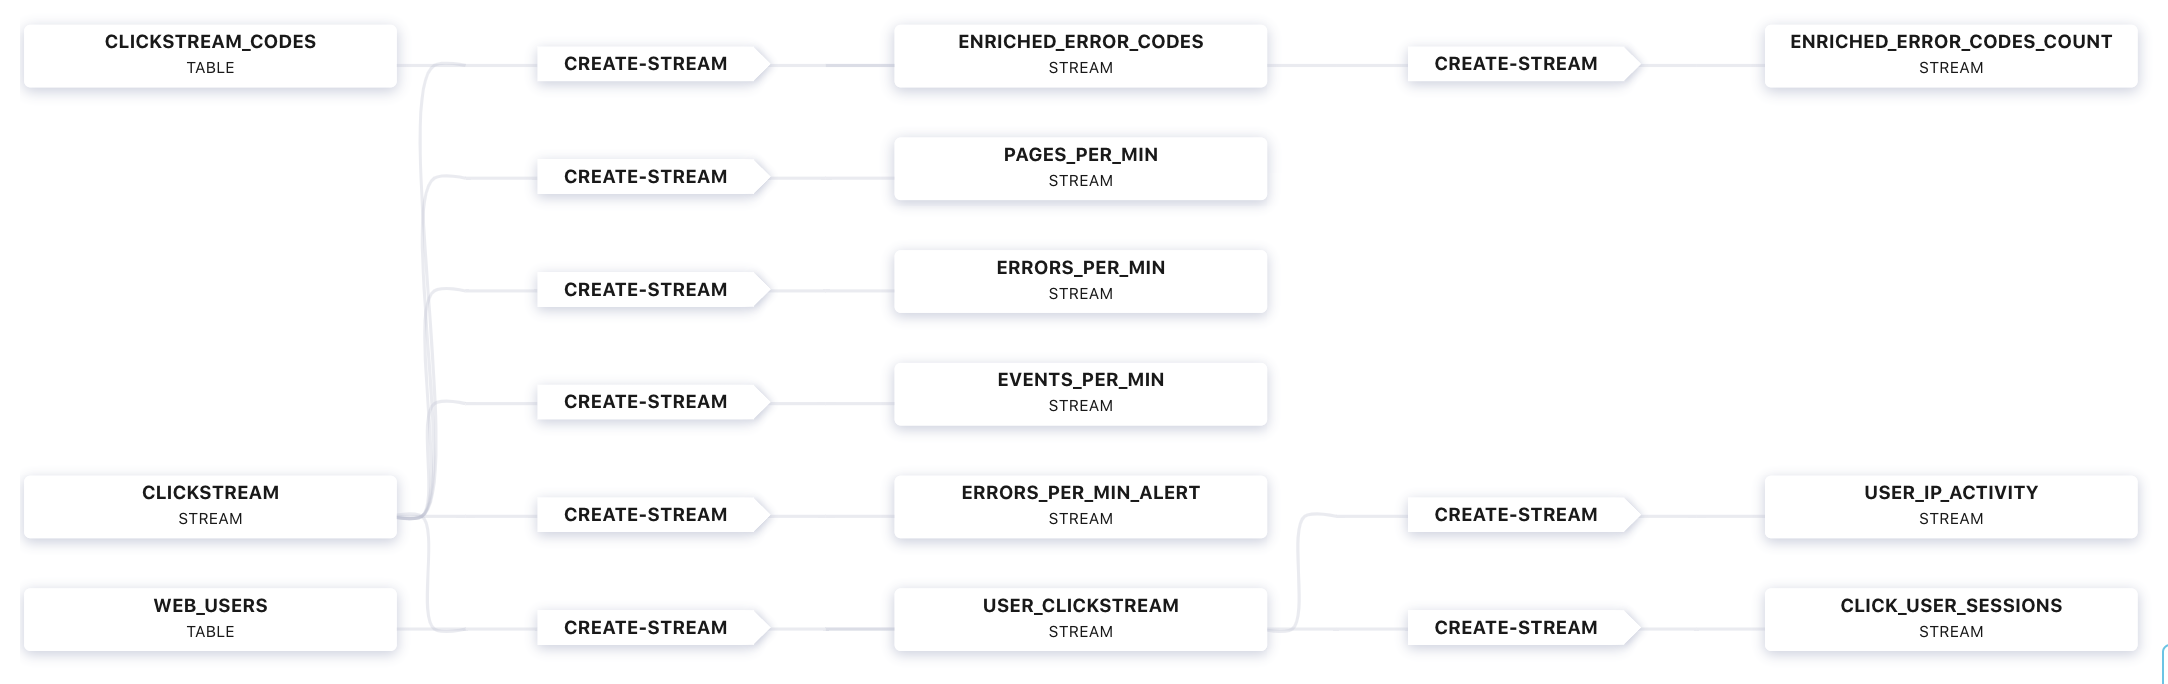
Verify that data is being streamed through various tables and streams. Query one of the streams
CLICKSTREAM: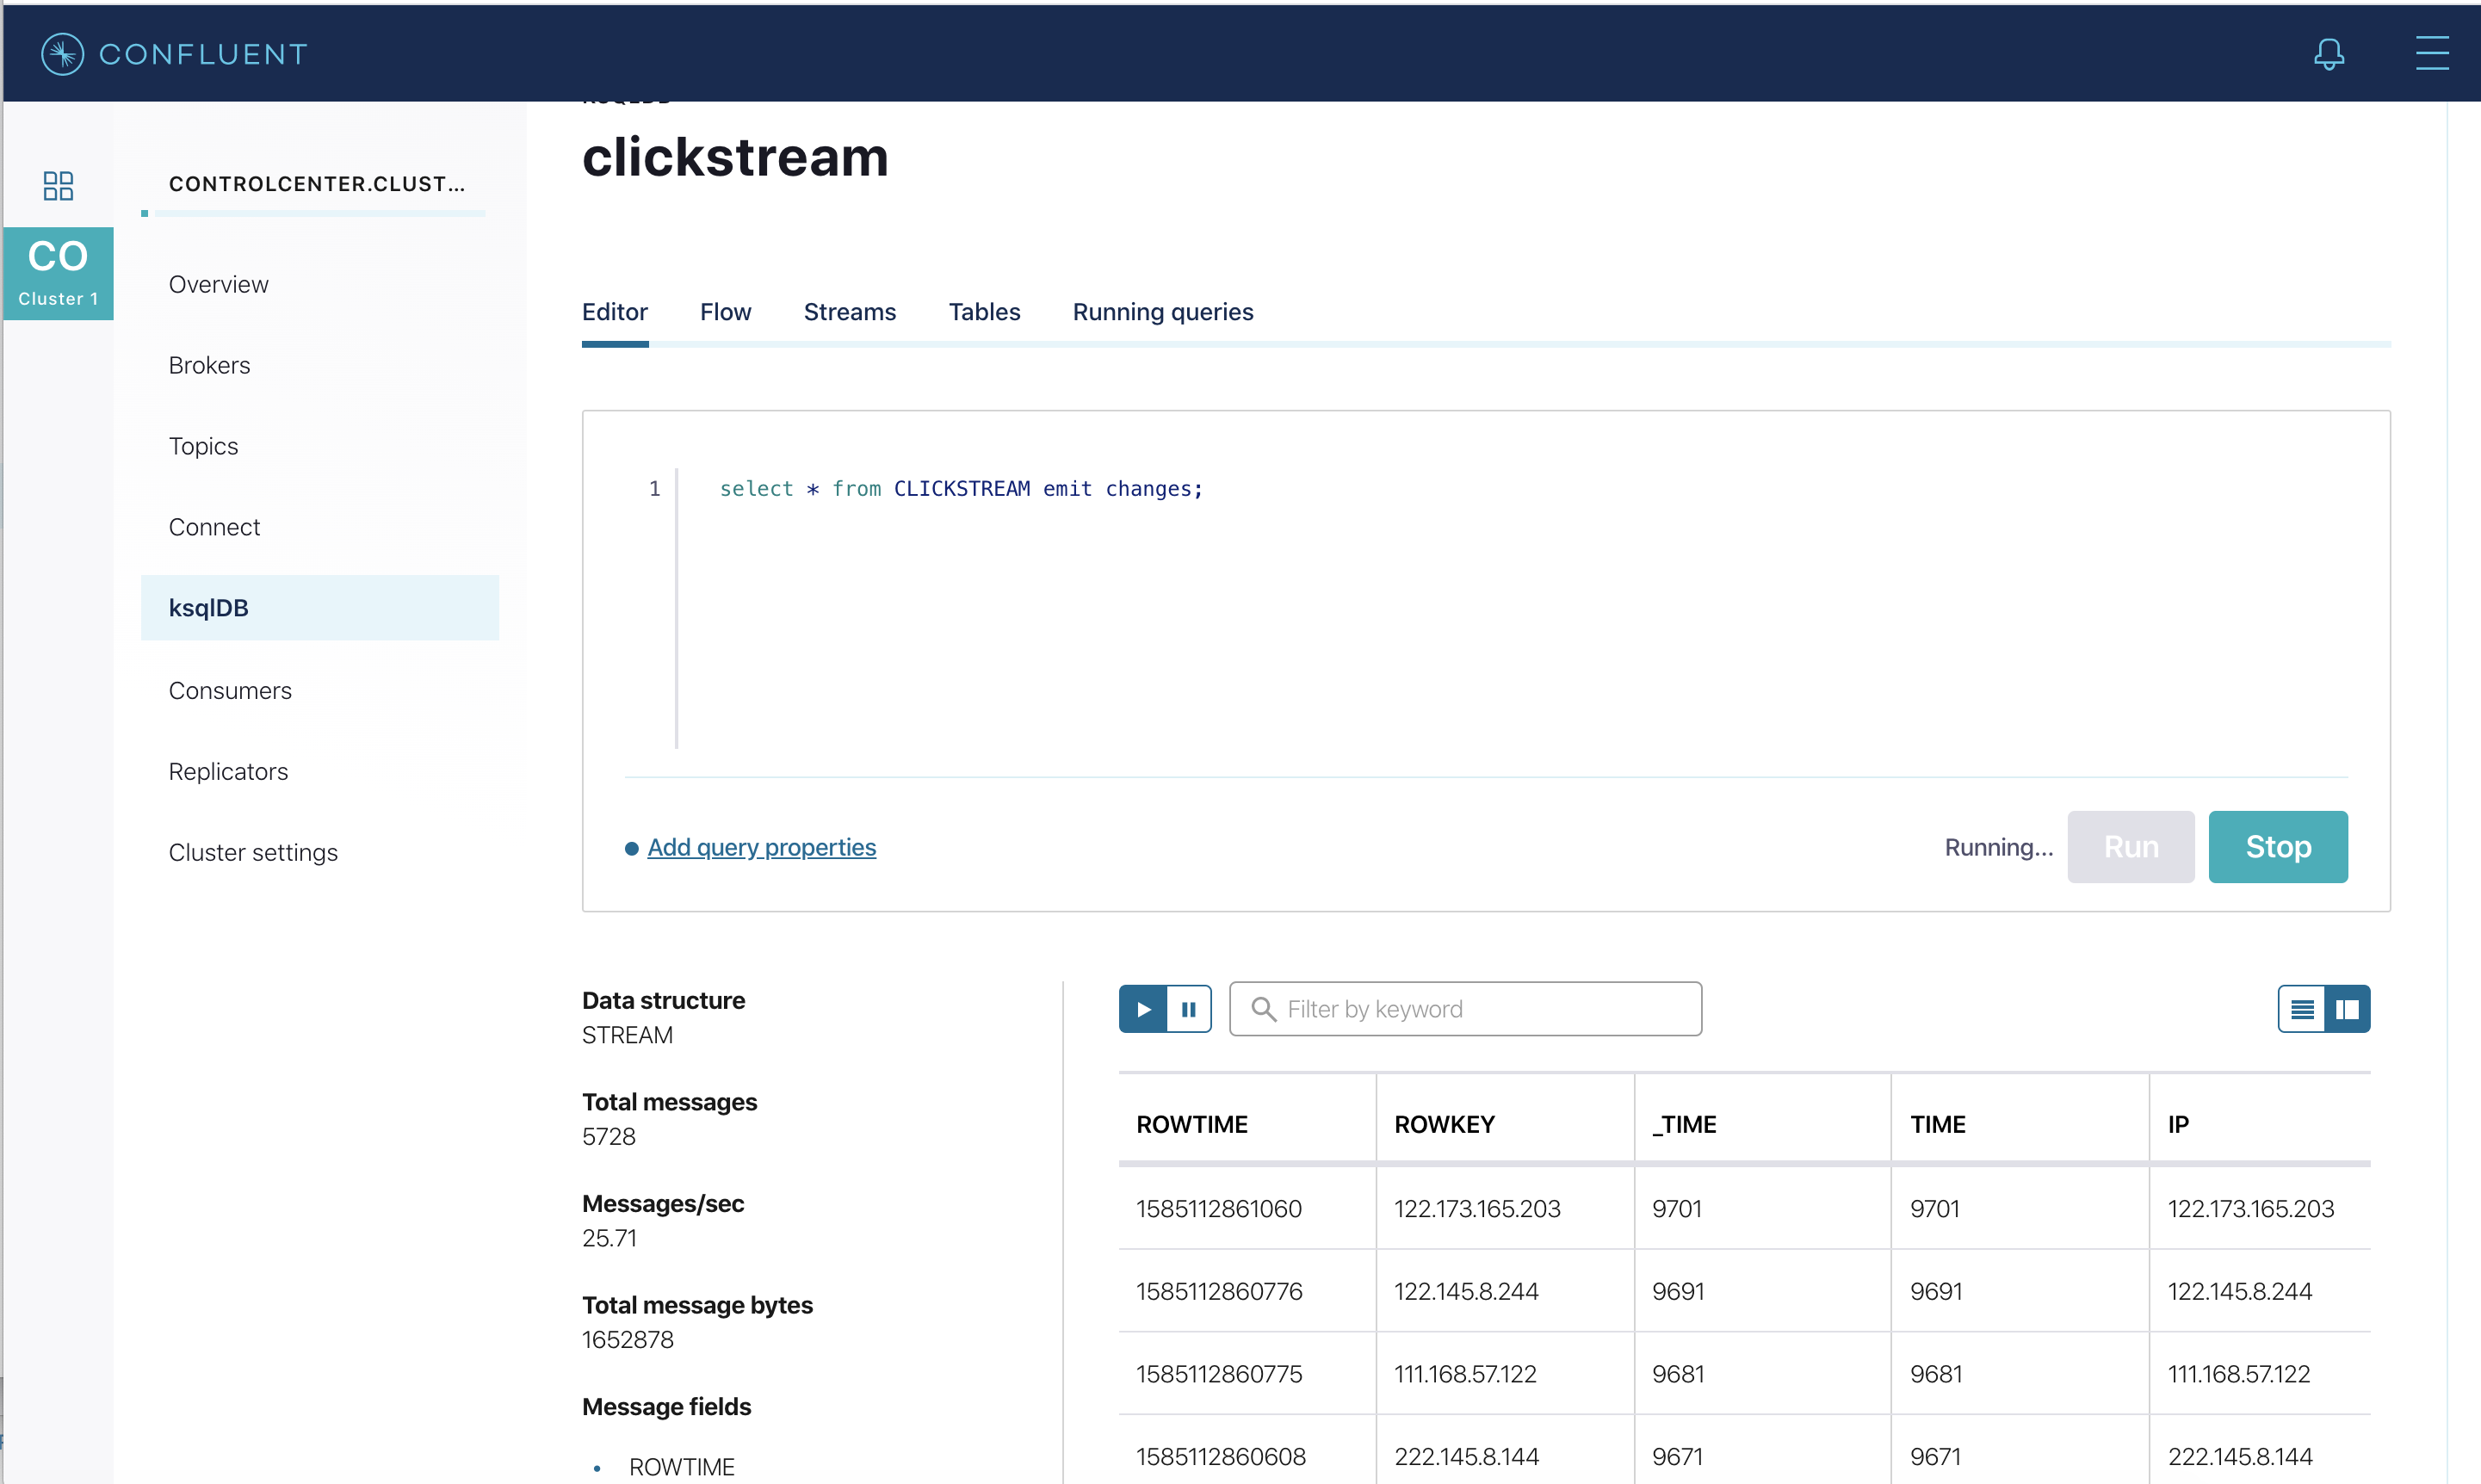
Load the Clickstream Data in Grafana
Send the ksqlDB tables to Elasticsearch and Grafana.
Set up the required Elasticsearch document mapping template
docker-compose exec elasticsearch bash -c '/scripts/elastic-dynamic-template.sh'
Run this command to send the ksqlDB tables to Elasticsearch and Grafana:
docker-compose exec ksqldb-server bash -c '/scripts/ksql-tables-to-grafana.sh'
Your output should resemble:
Loading Clickstream-Demo TABLES to Confluent-Connect => Elastic => Grafana datasource


==================================================================
Charting  CLICK_USER_SESSIONS
        -> Remove any existing Elastic search config
        -> Remove any existing Connect config
        -> Remove any existing Grafana config
        -> Connecting KSQL->Elastic->Grafana  click_user_sessions
        -> Connecting: click_user_sessions
                -> Adding Kafka Connect Elastic Source es_sink_CLICK_USER_SESSIONS
                ->Adding Grafana Source

[...]
Load the dashboard into Grafana.
docker-compose exec grafana bash -c '/scripts/clickstream-analysis-dashboard.sh'
Your output should resemble:
Loading Grafana ClickStream Dashboard
{"id":1,"slug":"click-stream-analysis","status":"success","uid":"lUHTGDTmz","url":"/d/lUHTGDTmz/click-stream-analysis","version":4}
Navigate to the Grafana dashboard (username/password is user/user) at http://localhost:3000
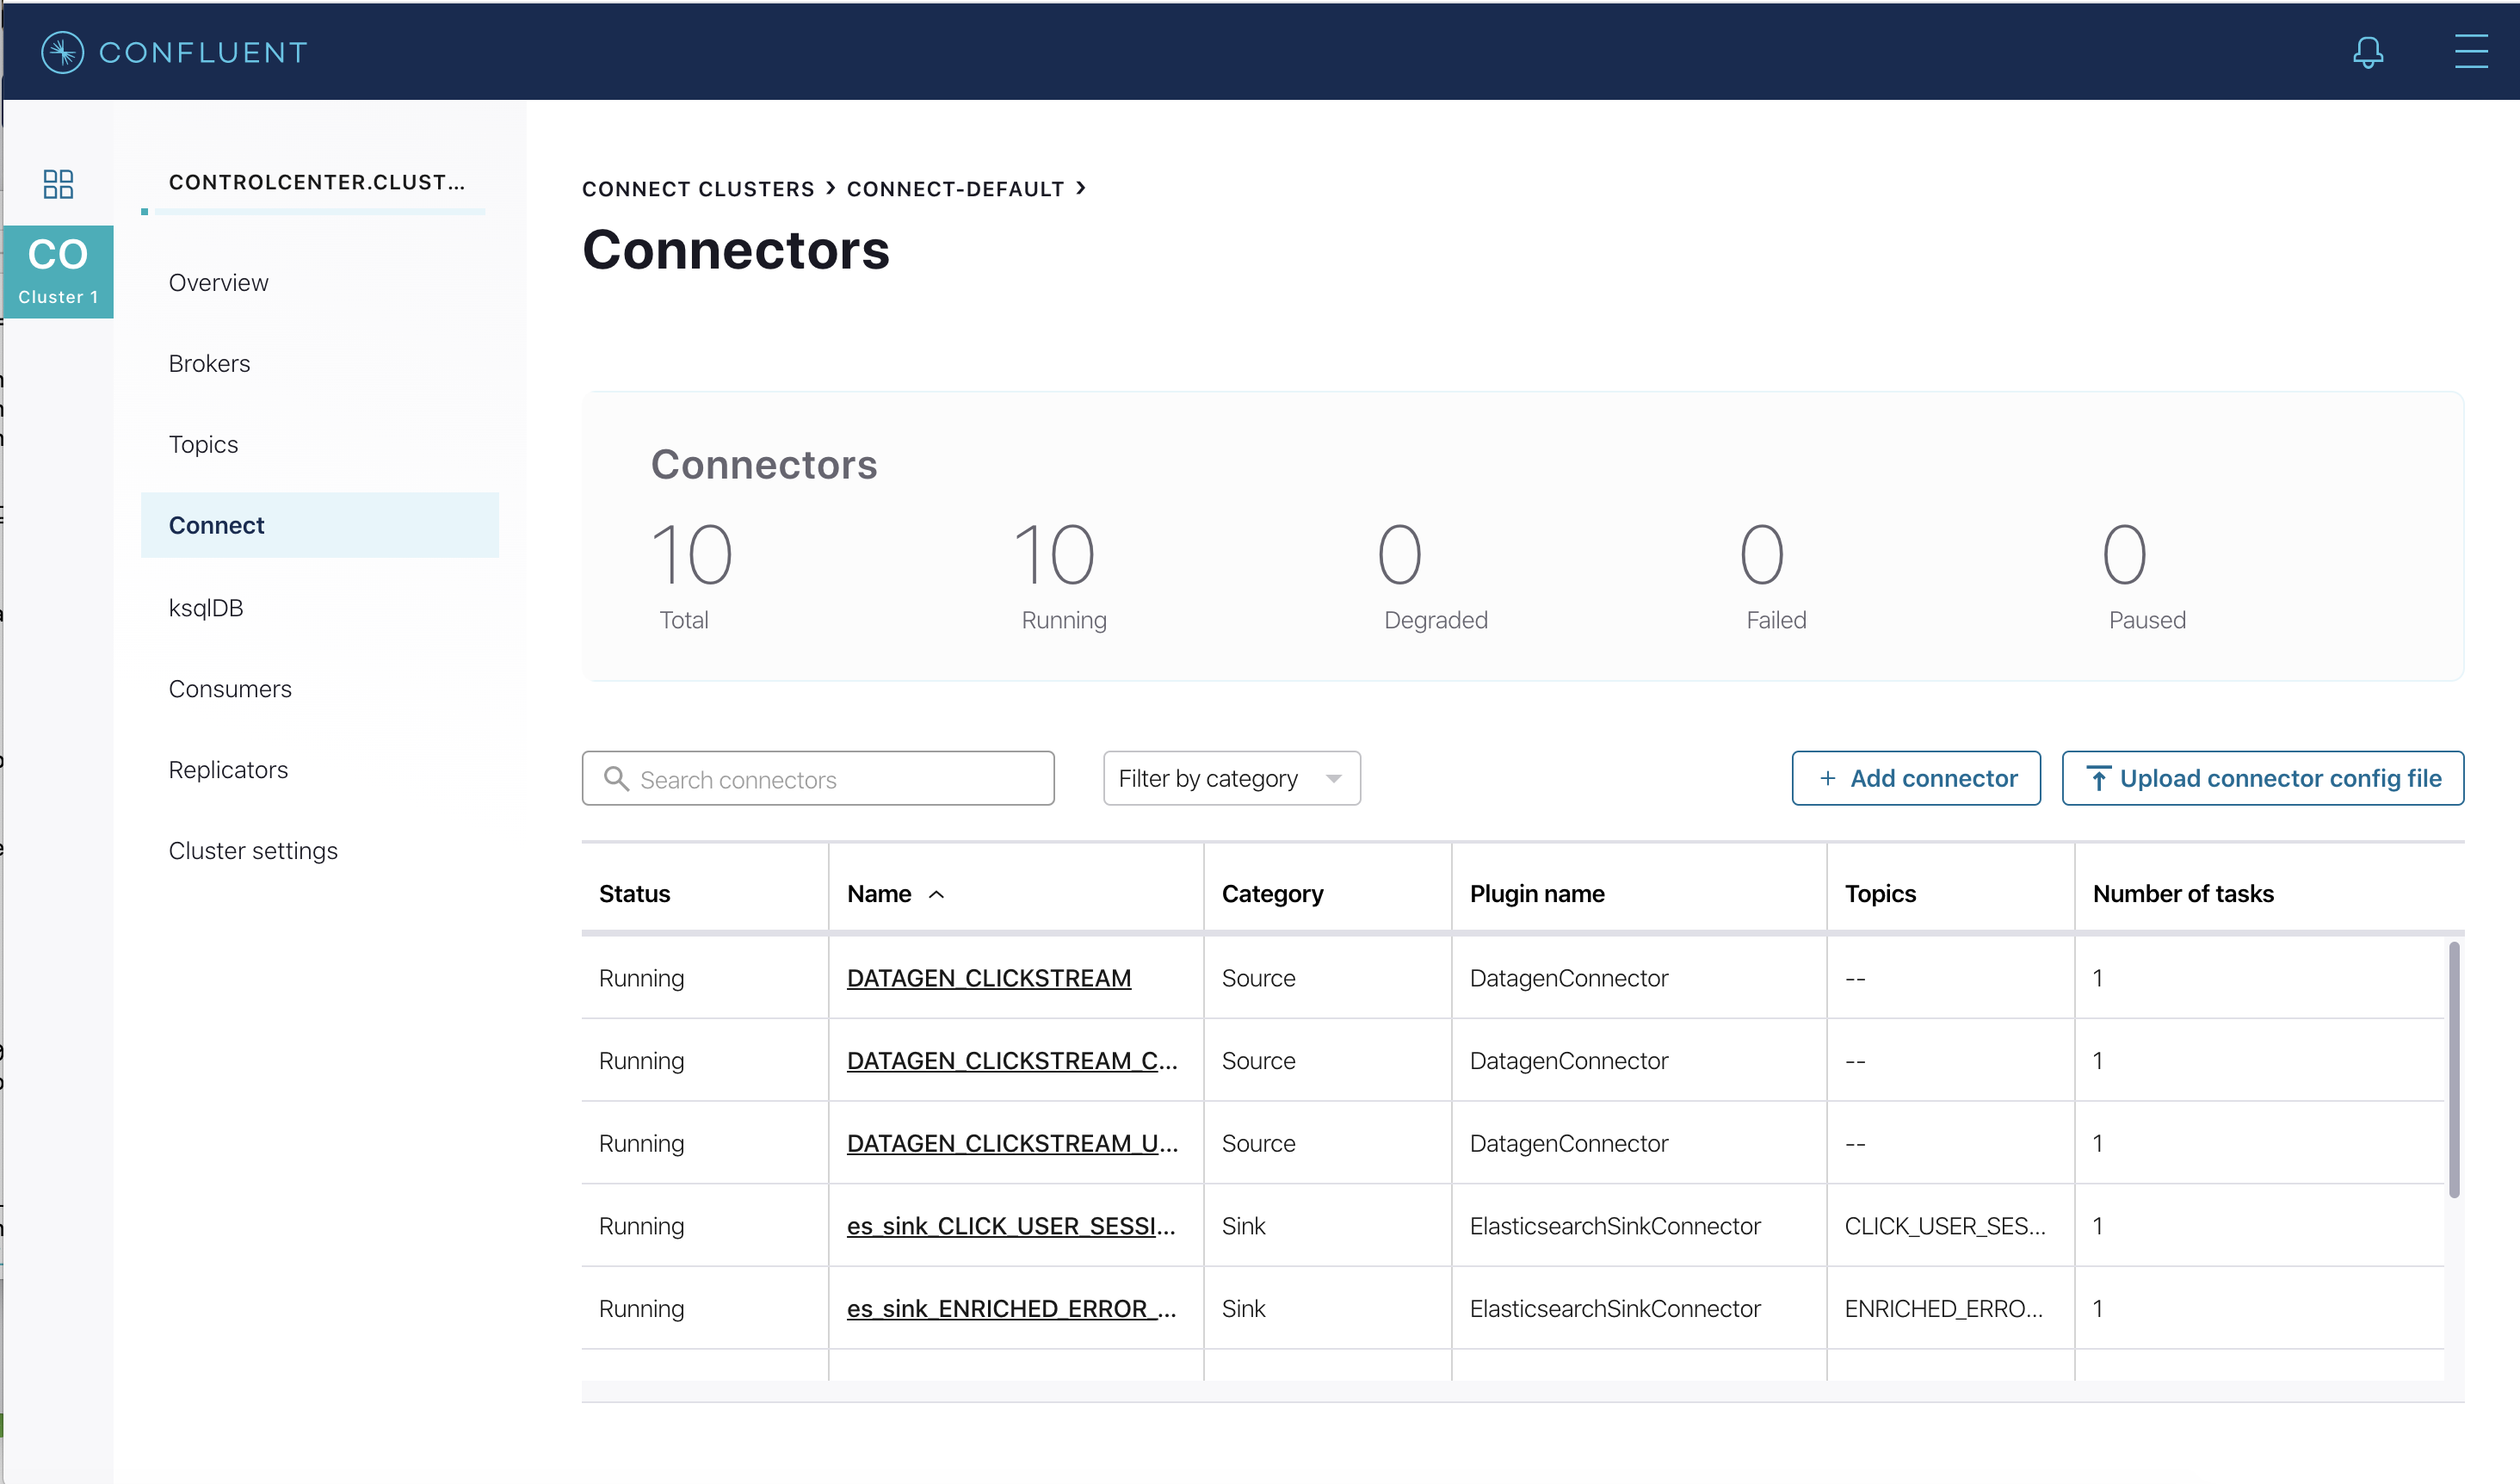
In the Confluent Control Center UI at http://localhost:9021, again view the running connectors. The three kafka-connect-datagen source connectors were created with the ksqlDB CLI, and the seven Elasticsearch sink connectors were created with the ksqlDB REST API.
Sessionize the data
One of the tables created by the demo, CLICK_USER_SESSIONS, shows a count of user activity for a given user session. All clicks from the user count towards the total user activity for the current session. If a user is inactive for 30 seconds, then any subsequent click activity is counted towards a new session.
The clickstream demo simulates user sessions with a script. The script pauses the DATAGEN_CLICKSTREAM connector every 90 seconds for a 35 second period of inactivity. By stopping the DATAGEN_CLICKSTREAM connector for some time greater than 30 seconds, you will see distinct user sessions.
You’ll probably use a longer inactivity gap for session windows in practice. But the demo uses 30 seconds so you can see the sessions in action in a reasonable amount of time.
Session windows are different because they monitor user behavior and other window implementations consider only time.
To generate the session data execute the following statement from the examples/clickstream directory:
./sessionize-data.sh
The script will issue some statements to the console about where it is in the process.
View the data in Grafana
- Now open your your browser using the URL output from the step where you loaded the data into Grafana.
You can login with user ID
userand passworduser.Important: If you already have Grafana UI open, you may need to enter the specific clickstream URL output by the previous step
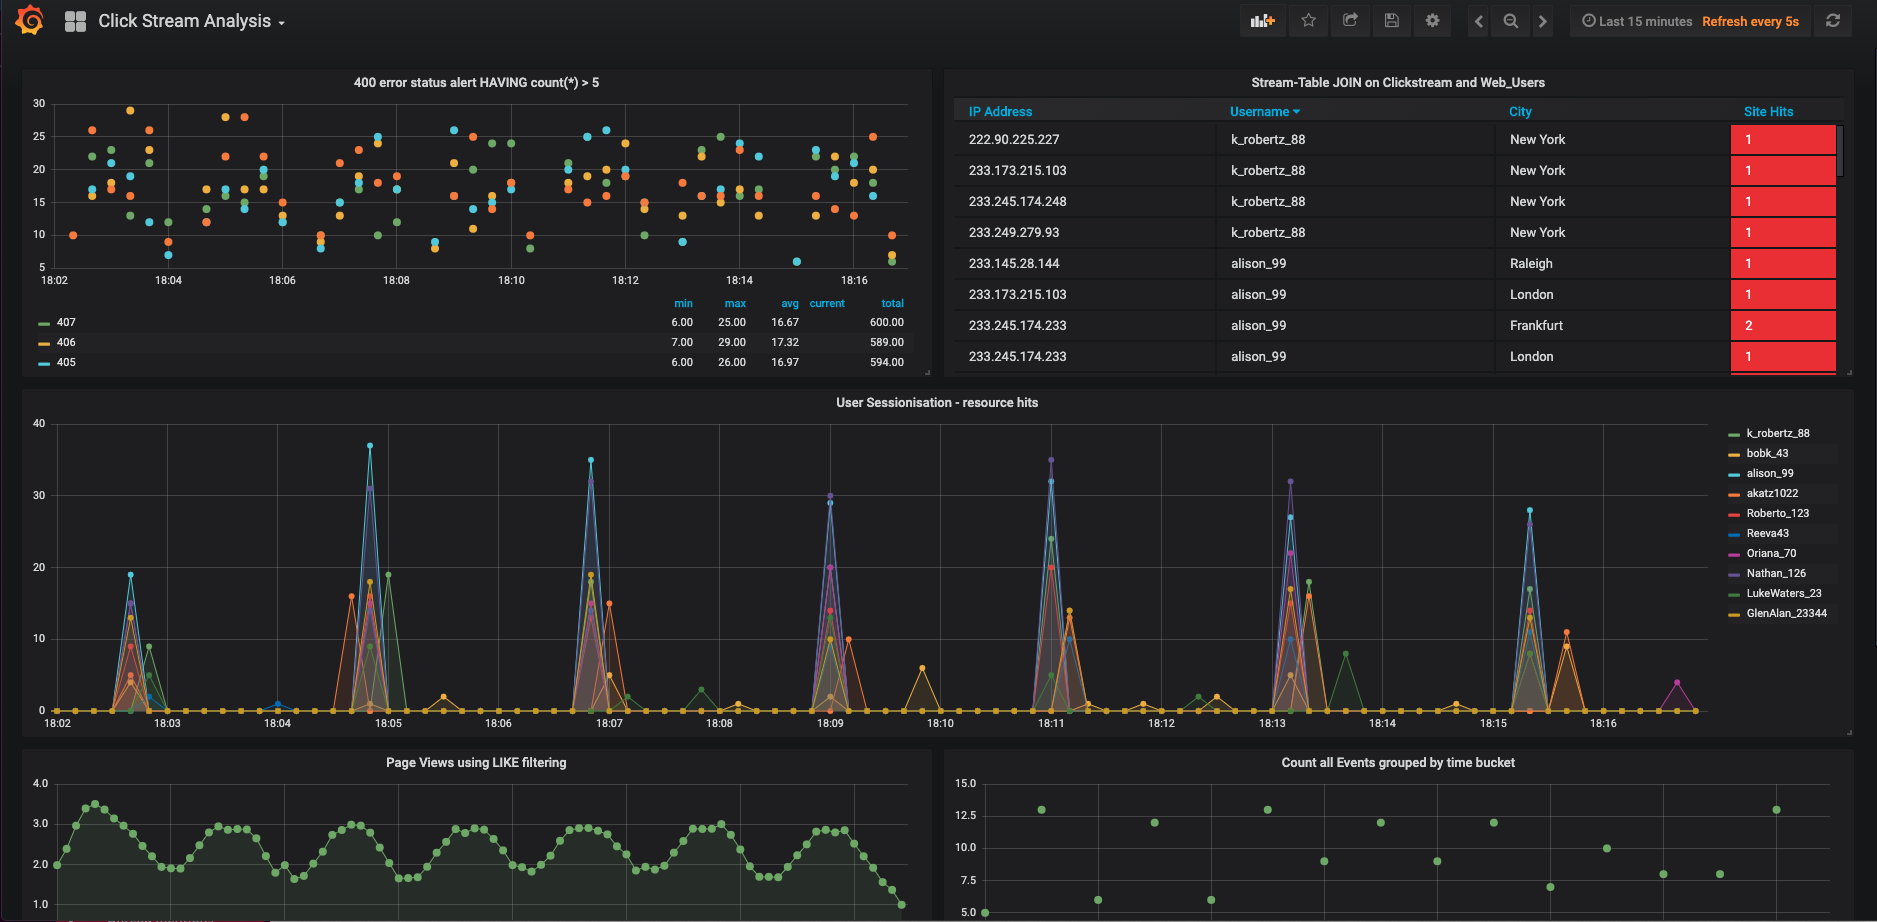
This dashboard demonstrates a series of streaming functionality where the title of each panel describes the type of stream
processing required to generate the data. For example, the large chart in the middle is showing web-resource requests on a per-username basis
using a Session window - where a sessions expire after 300 seconds of inactivity. Editing the panel allows you to view the datasource - which
is named after the streams and tables captured in the statements.sql file.
Troubleshooting
- Check the Data Sources page in Grafana.
- If your data source is shown, select it and scroll to the bottom and click the Save & Test button. This will indicate whether your data source is valid.