Important
You are viewing documentation for an older version of Confluent Platform. For the latest, click here.
Confluent Platform Demo (cp-demo)
This example builds a full Confluent Platform deployment with an Apache Kafka® event streaming application using ksqlDB and Kafka Streams for stream processing, and all the components have security enabled end-to-end. Follow the accompanying guided tutorial that steps through the example so that you can learn how it all works together.
Overview
Use Case
The use case is an Apache Kafka® event streaming application that processes real-time edits to real Wikipedia pages.
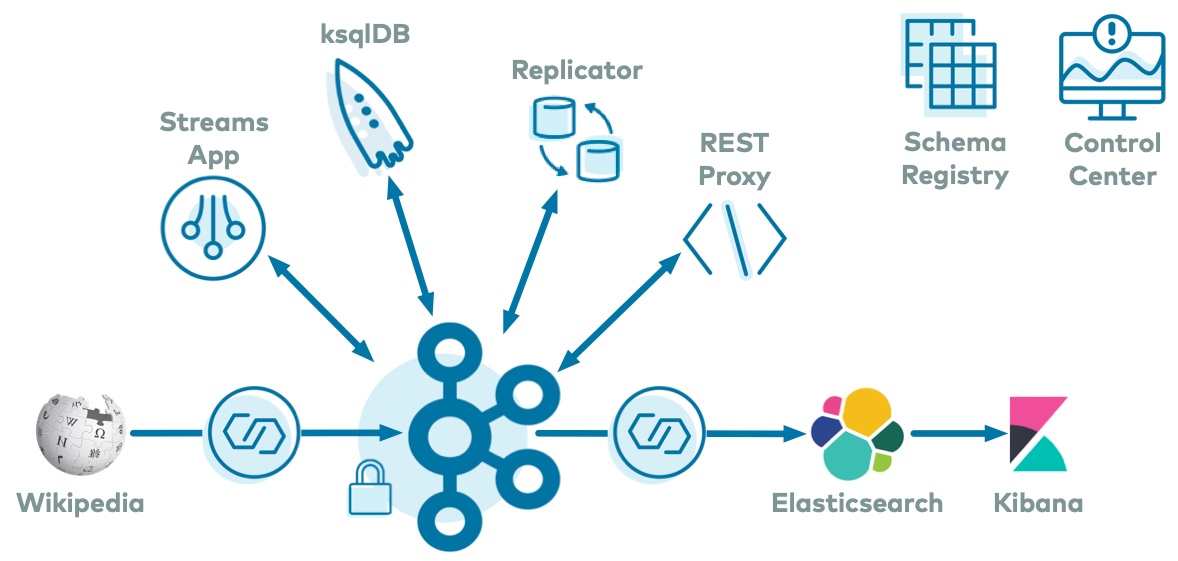
Wikimedia Foundation has IRC channels that publish edits happening to real wiki pages (e.g. #en.wikipedia, #en.wiktionary) in real time.
Using Kafka Connect, a Kafka source connector kafka-connect-irc streams raw messages from these IRC channels, and a custom Kafka Connect transform kafka-connect-transform-wikiedit transforms these messages and then the messages are written to a Kafka cluster.
This example uses ksqlDB and a Kafka Streams application for data processing.
Then a Kafka sink connector kafka-connect-elasticsearch streams the data out of Kafka, and the data is materialized into Elasticsearch for analysis by Kibana.
Confluent Replicator is also copying messages from a topic to another topic in the same cluster.
All data is using Confluent Schema Registry and Avro.
Confluent Control Center is managing and monitoring the deployment.
Data Pattern
Data pattern is as follows:
| Components | Consumes From | Produces To |
|---|---|---|
| IRC source connector | Wikipedia | wikipedia.parsed |
| ksqlDB | wikipedia.parsed |
ksqlDB streams and tables |
| Kafka Streams application | wikipedia.parsed |
wikipedia.parsed.count-by-channel |
| Confluent Replicator | wikipedia.parsed |
wikipedia.parsed.replica |
| Elasticsearch sink connector | WIKIPEDIABOT (from ksqlDB) |
Elasticsearch/Kibana |
Run Example
Prerequisites
This example has been validated with:
- Docker version 17.06.1-ce
- Docker Compose version 1.14.0 with Docker Compose file format 2.3
- Java version 1.8.0_92
- MacOS 10.15.3 (note for Ubuntu environments)
- OpenSSL 1.1.1d
- git
- jq
Docker
This is a Docker environment and has all services running on one host. It is meant exclusively to easily demo Confluent Platform, but in production, do not deploy all Confluent Platform services on a single host.
Also, in production, Confluent Control Center should be deployed with a valid license and with its own dedicated metrics cluster, separate from the cluster with production data. Using a dedicated metrics cluster is more resilient because it continues to provide system health monitoring even if the production traffic cluster experiences issues.
If you prefer non-Docker examples, please go to confluentinc/examples GitHub repository.
Start Example
In Docker’s advanced settings, increase the memory dedicated to Docker to at least 8GB (default is 2GB).
Clone the confluentinc/cp-demo GitHub repository:
git clone https://github.com/confluentinc/cp-demo
Navigate to the
cp-demodirectory and switch to the Confluent Platform release branch:cd cp-demo git checkout 5.5.15-post
From the
cp-demodirectory, start the entire example by running a single command that generates the keys and certificates, brings up the Docker containers, and configures and validates the environment. This will take approximately 7 minutes to complete../scripts/start.sh
Using a web browser, view the Confluent Control Center GUI at http://localhost:9021. For this tutorial, log in as
superUserand passwordsuperUser, which has super user access to the cluster. You may also log in as other users to learn how each user’s view changes depending on their permissions.To see the end of the entire pipeline, view the Kibana dashboard at http://localhost:5601/app/kibana#/dashboard/Wikipedia
After you run through the guided tutorial below, apply the concepts you learn here to build your own event streaming pipeline in Confluent Cloud, a fully managed, cloud-native event streaming platform powered by Kafka.
Note
When you sign up for Confluent Cloud, use the promo code C50INTEG to receive an additional $50 free usage (details).
Guided Tutorial
Brokers
Select the cluster named “Kafka Raleigh”.
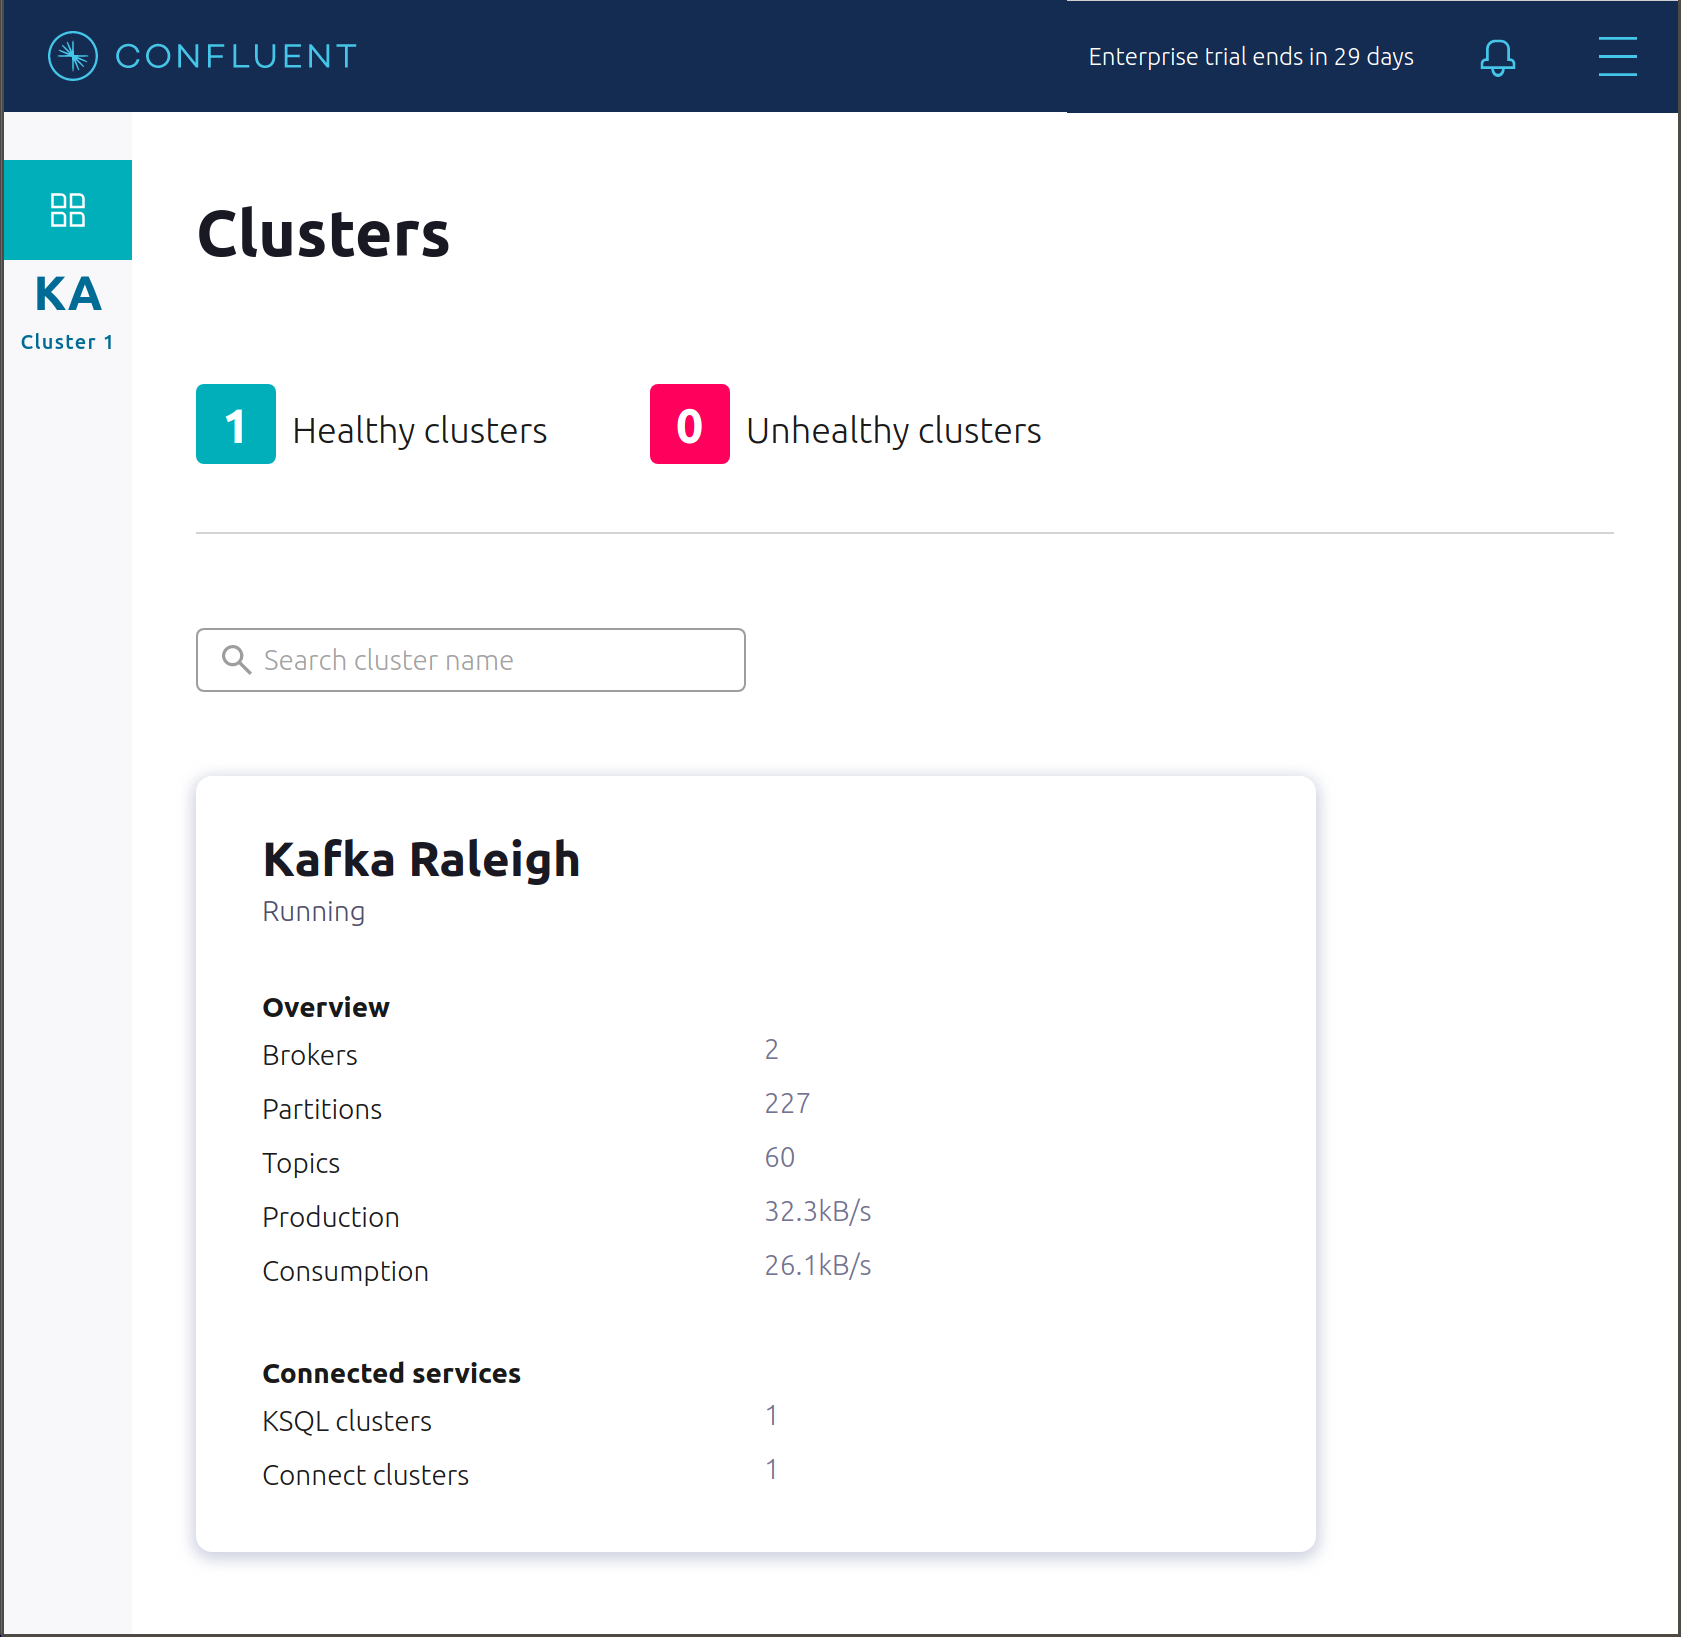
Click on “Brokers”.
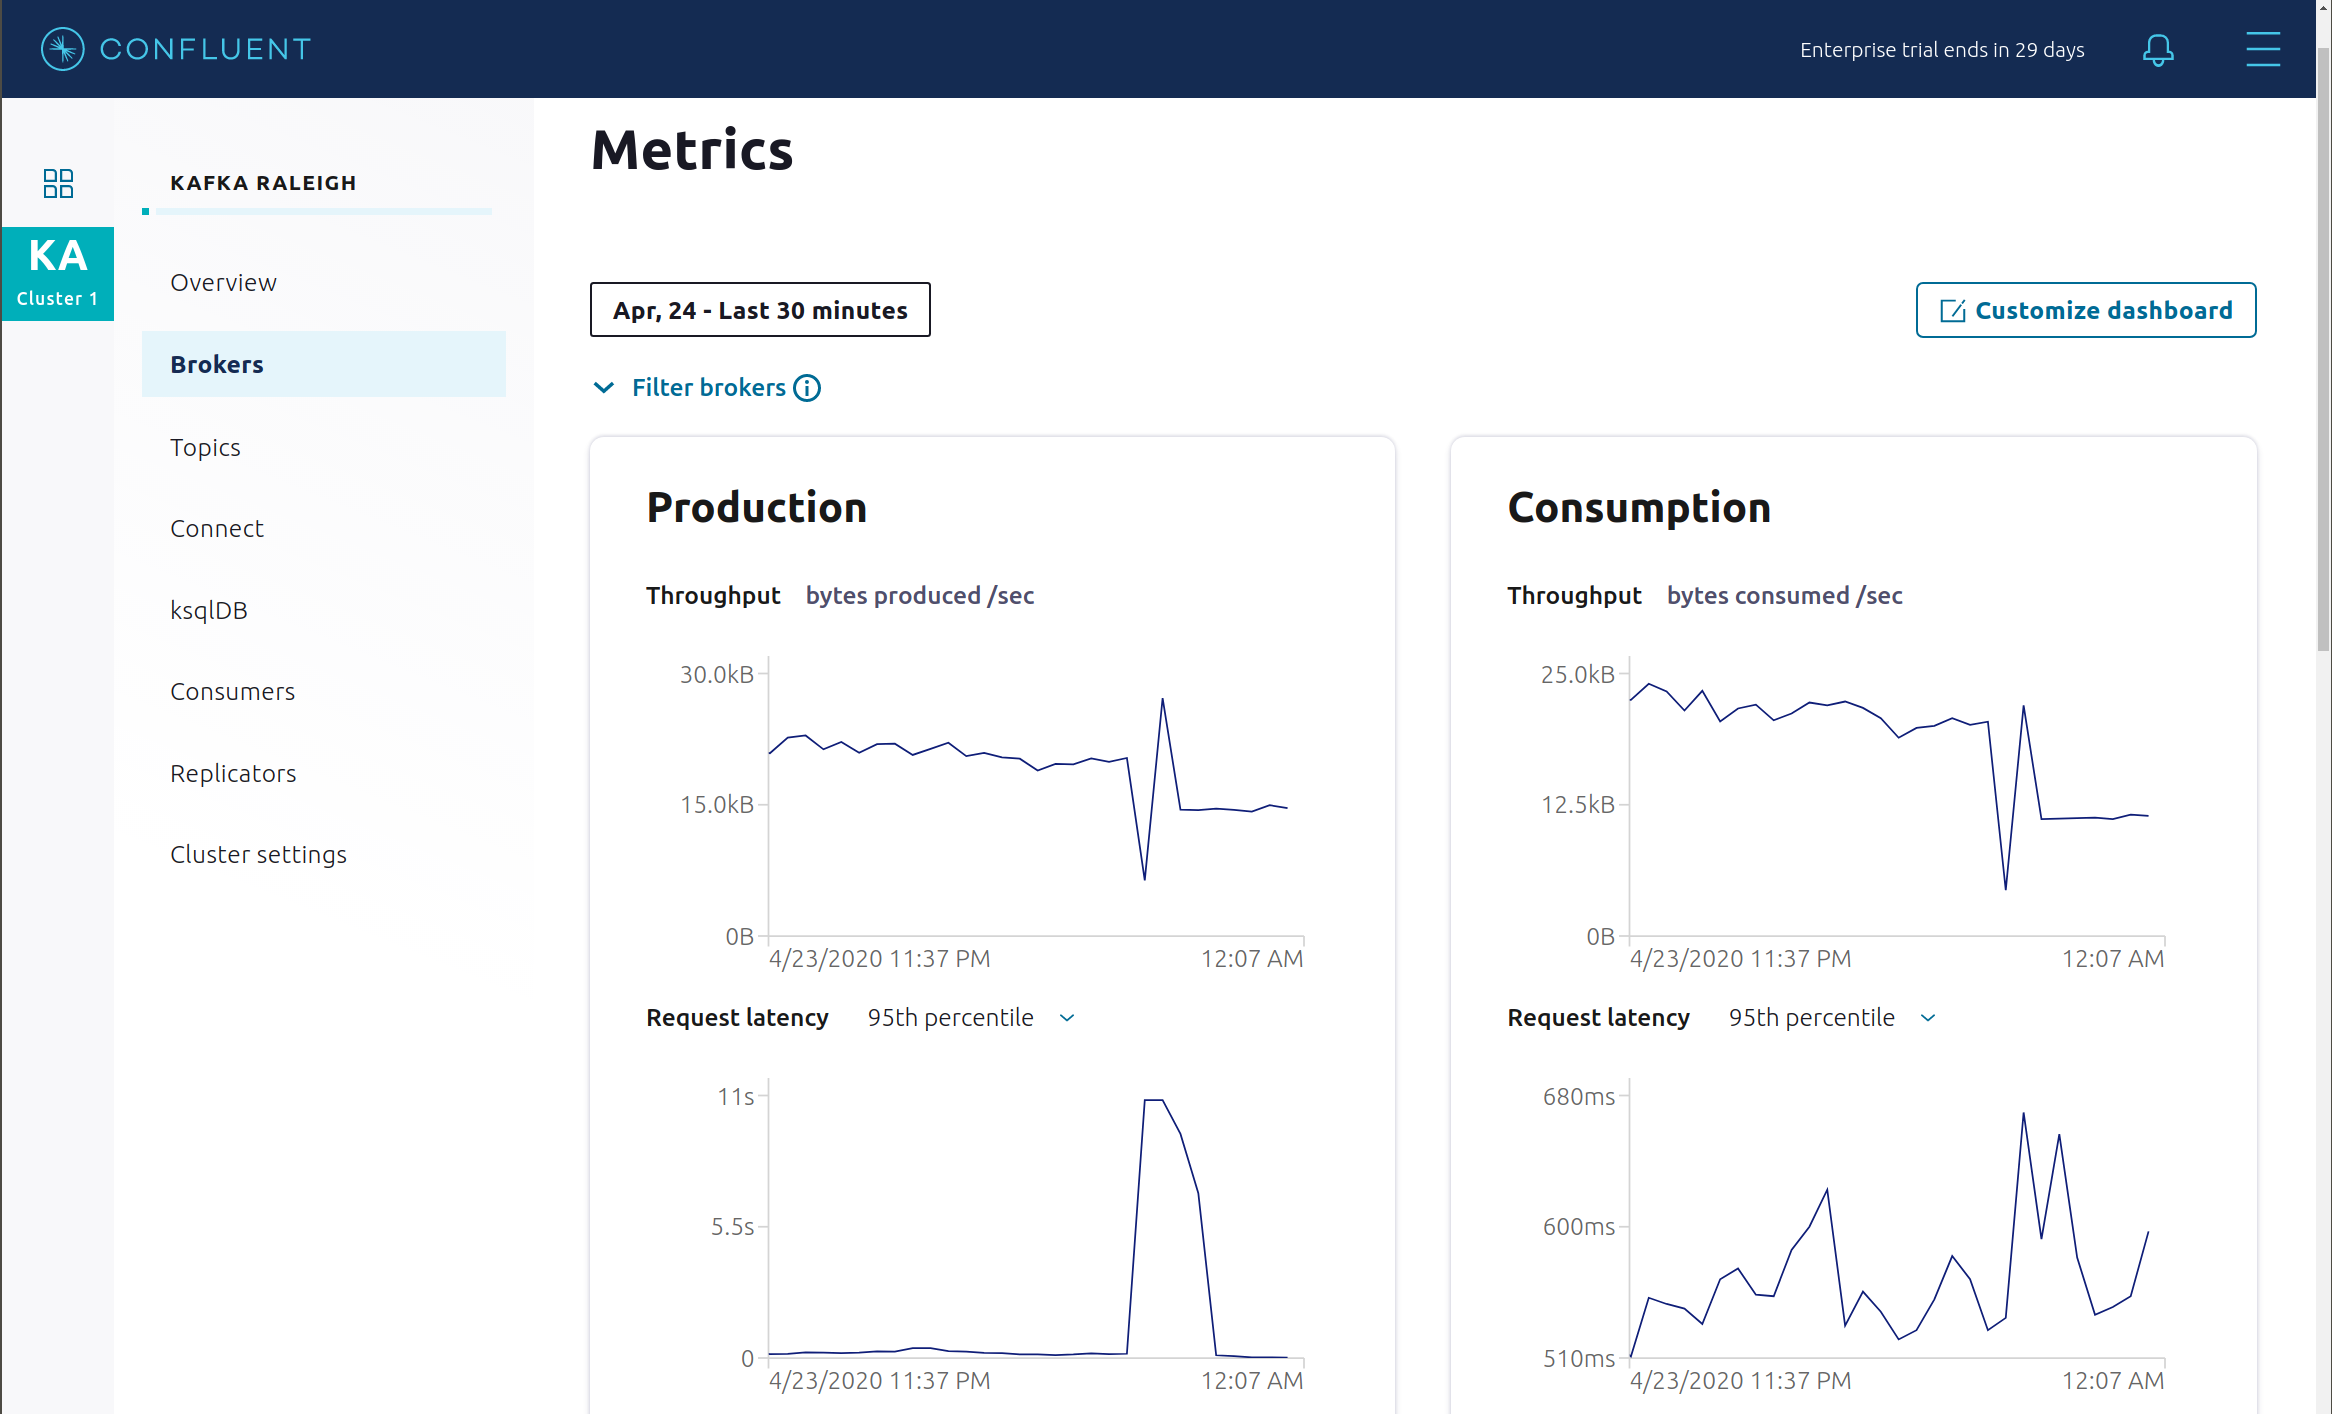
View the status of the Brokers in the cluster:
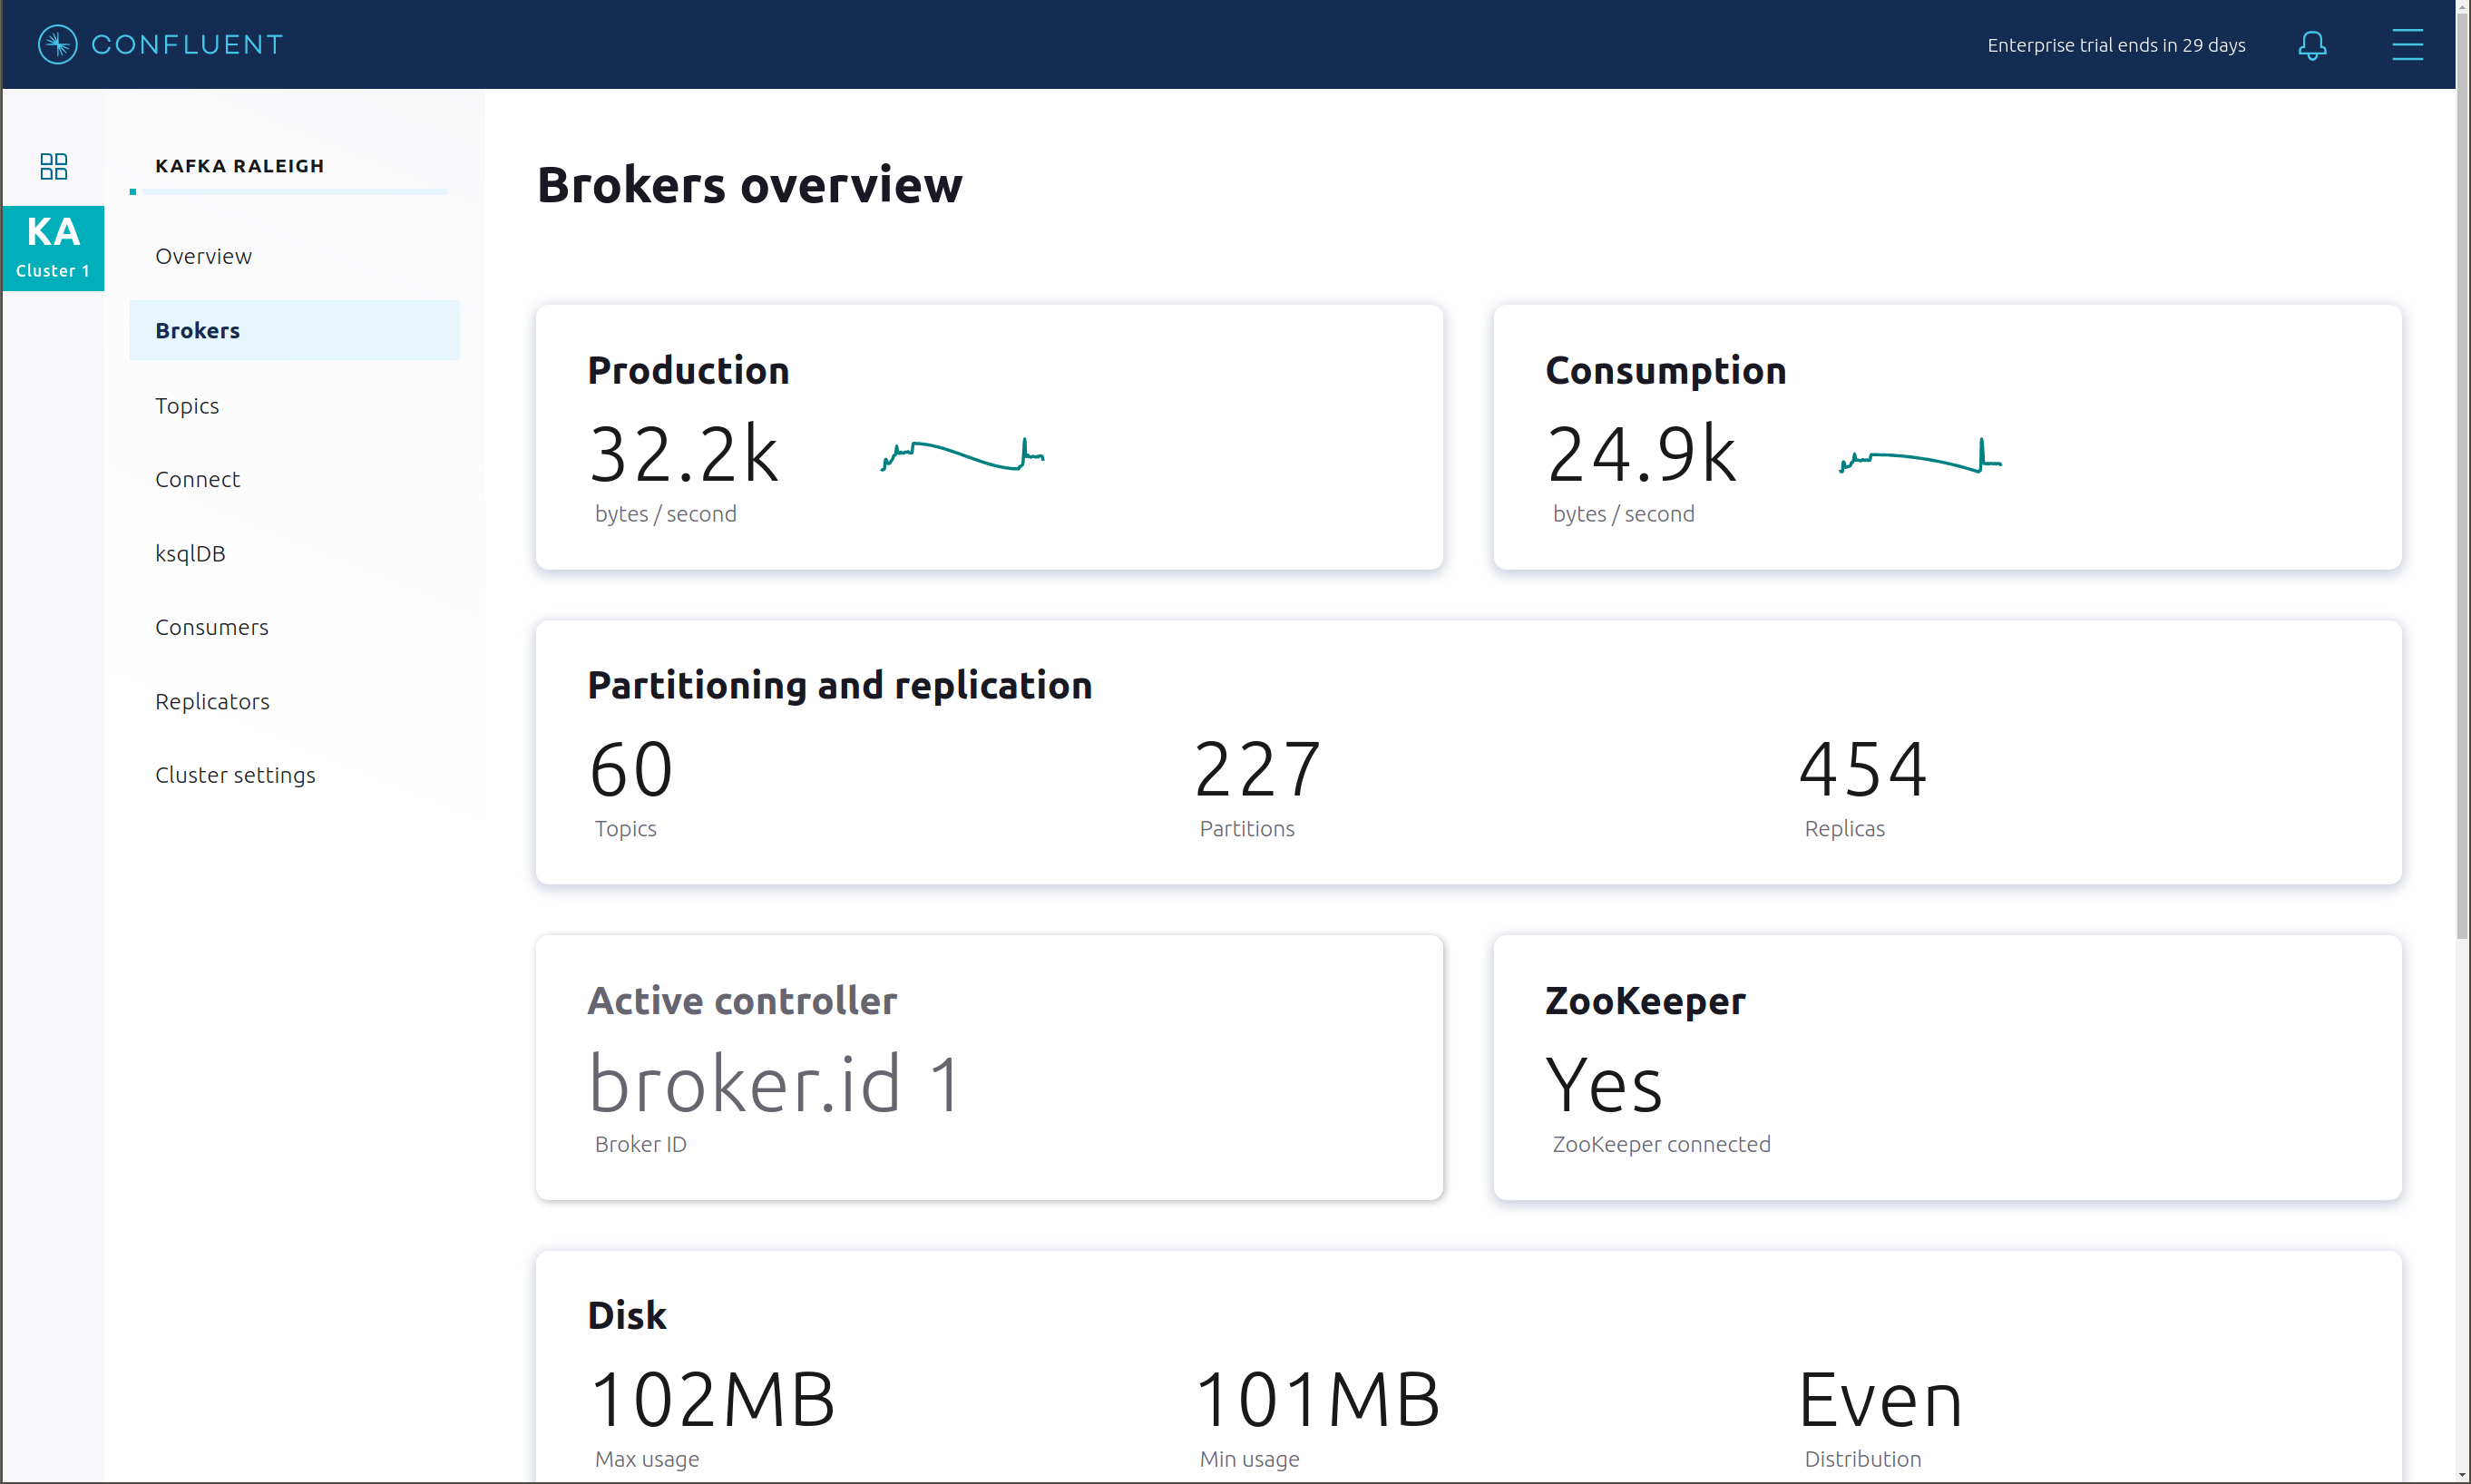
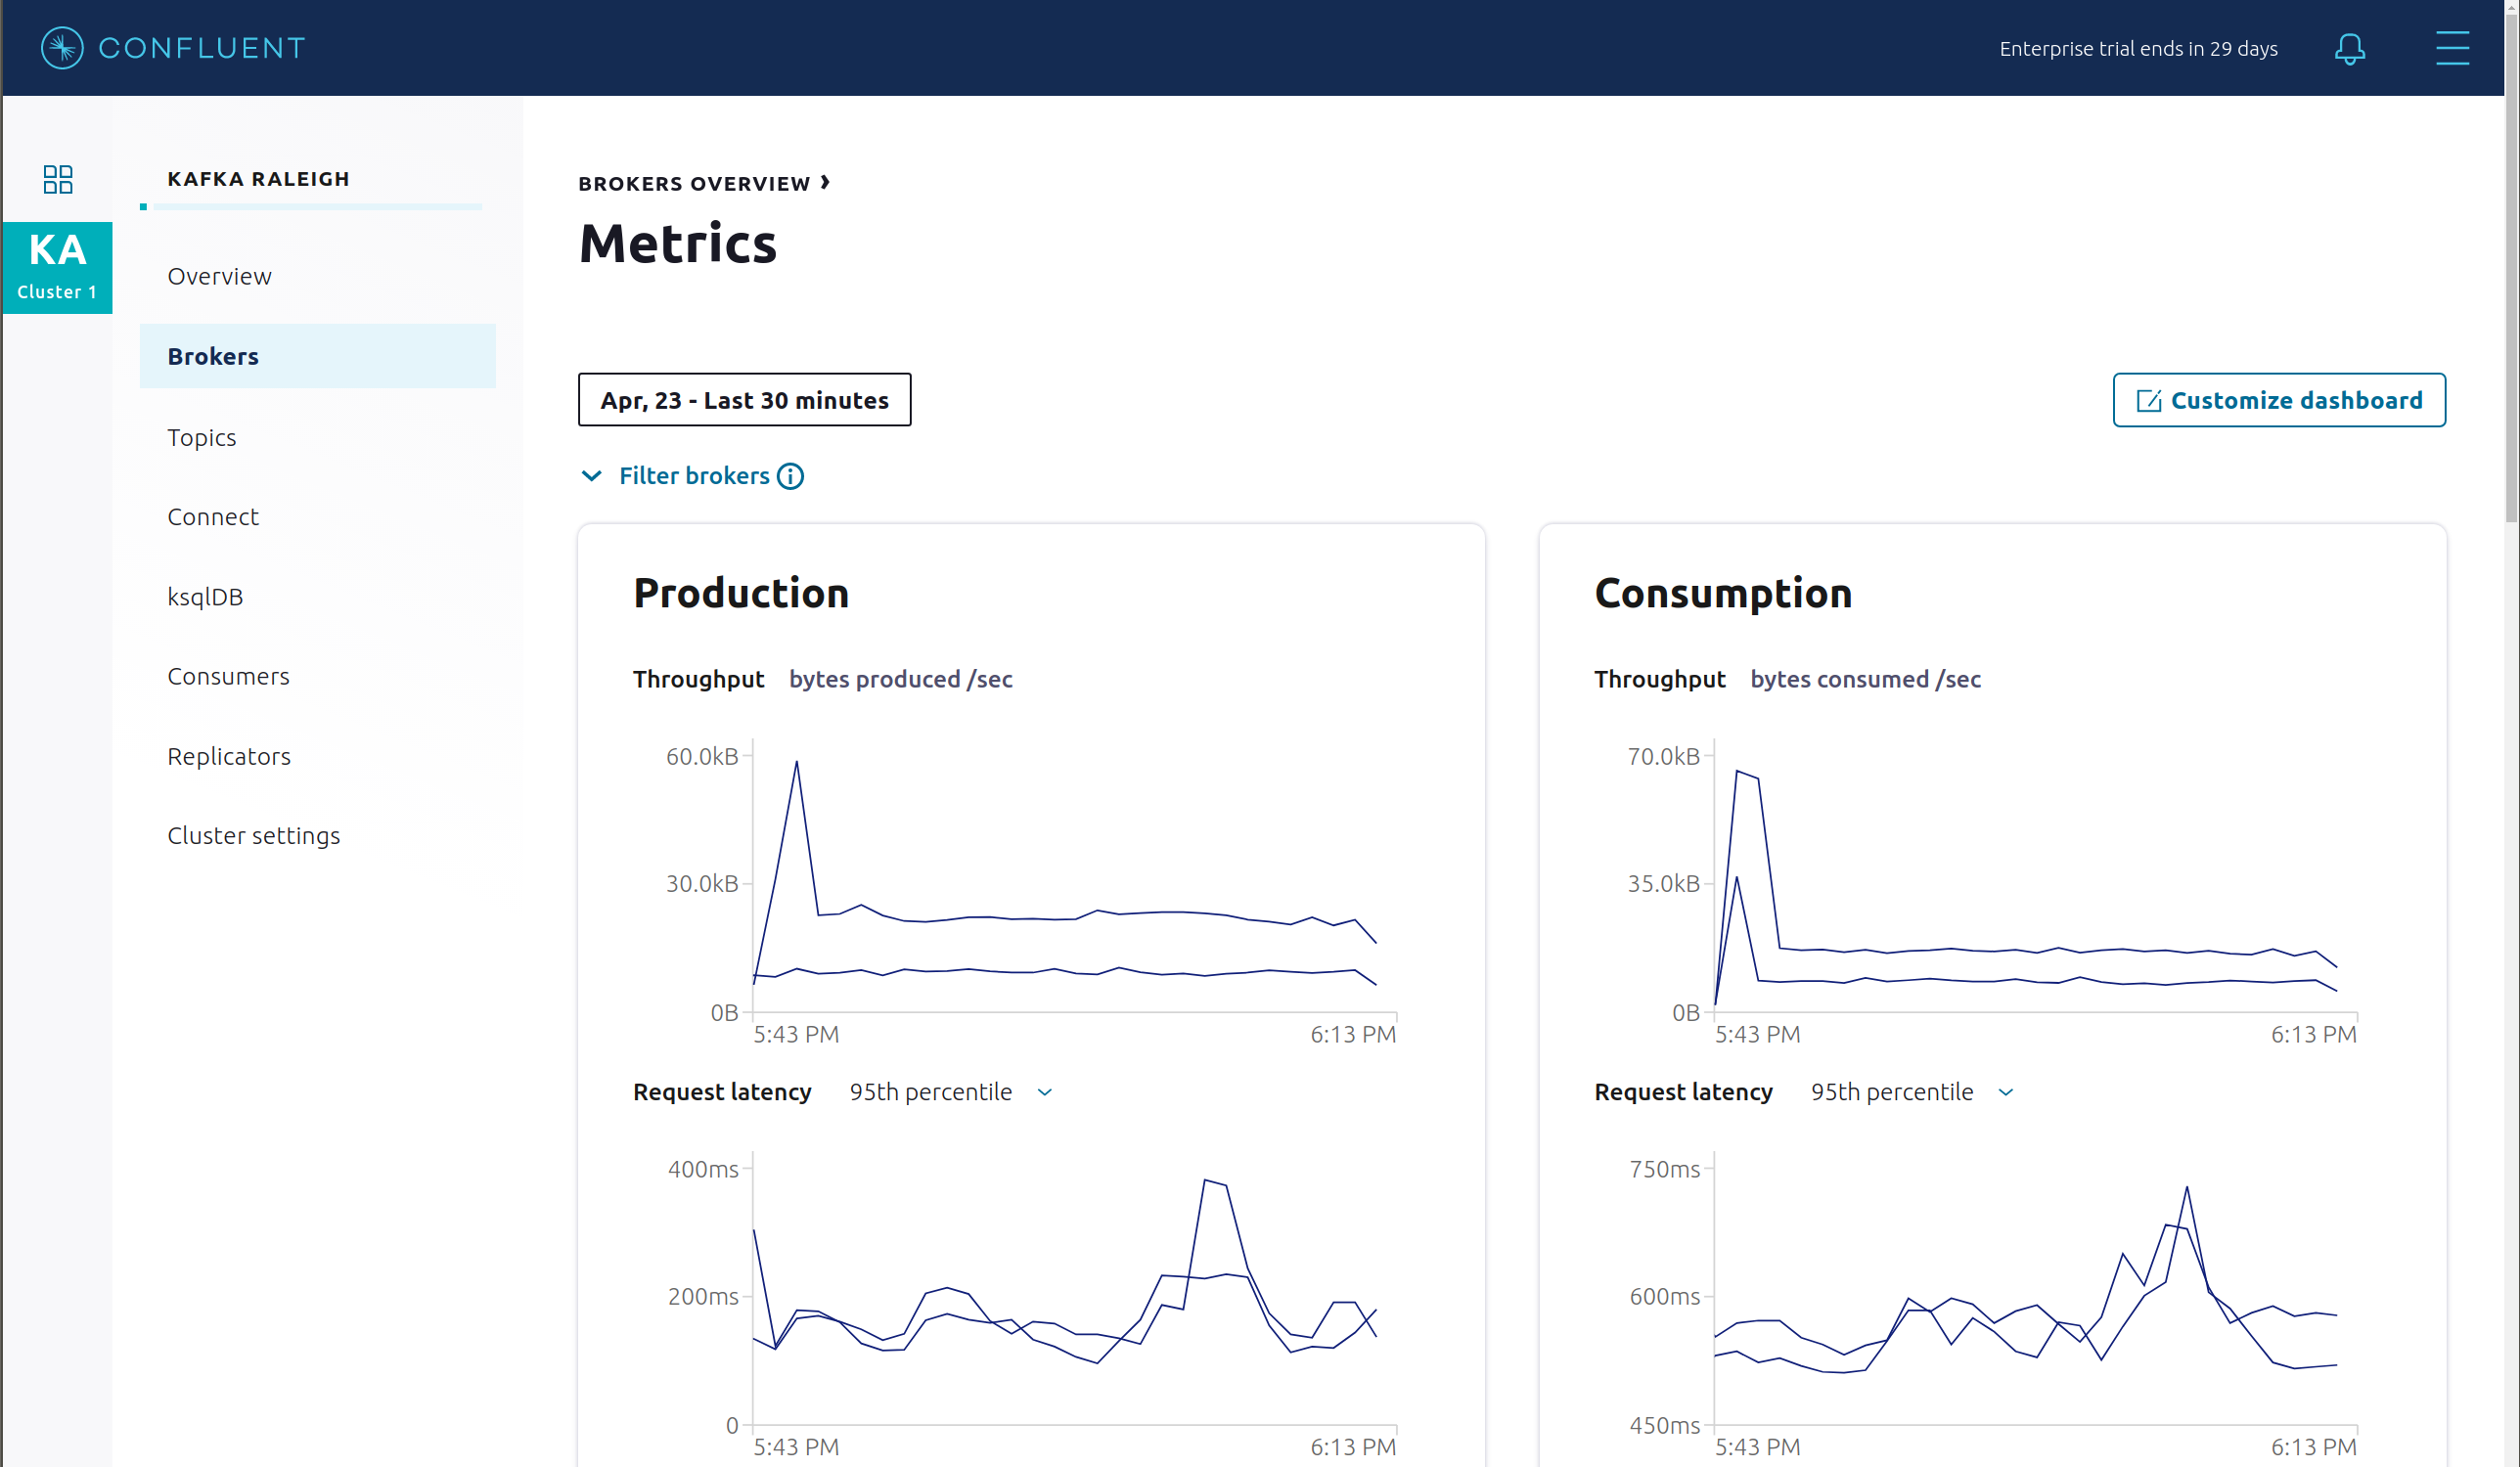
Click through on Production or Consumption to view: Production and Consumption metrics, Broker uptime, Partitions: online, under replicated, total replicas, out of sync replicas, Disk utilization, System: network pool usage, request pool usage.
Topics
Confluent Control Center can manage topics in a Kafka cluster. Click on “Topics”.
Scroll down and click on the topic
wikipedia.parsed.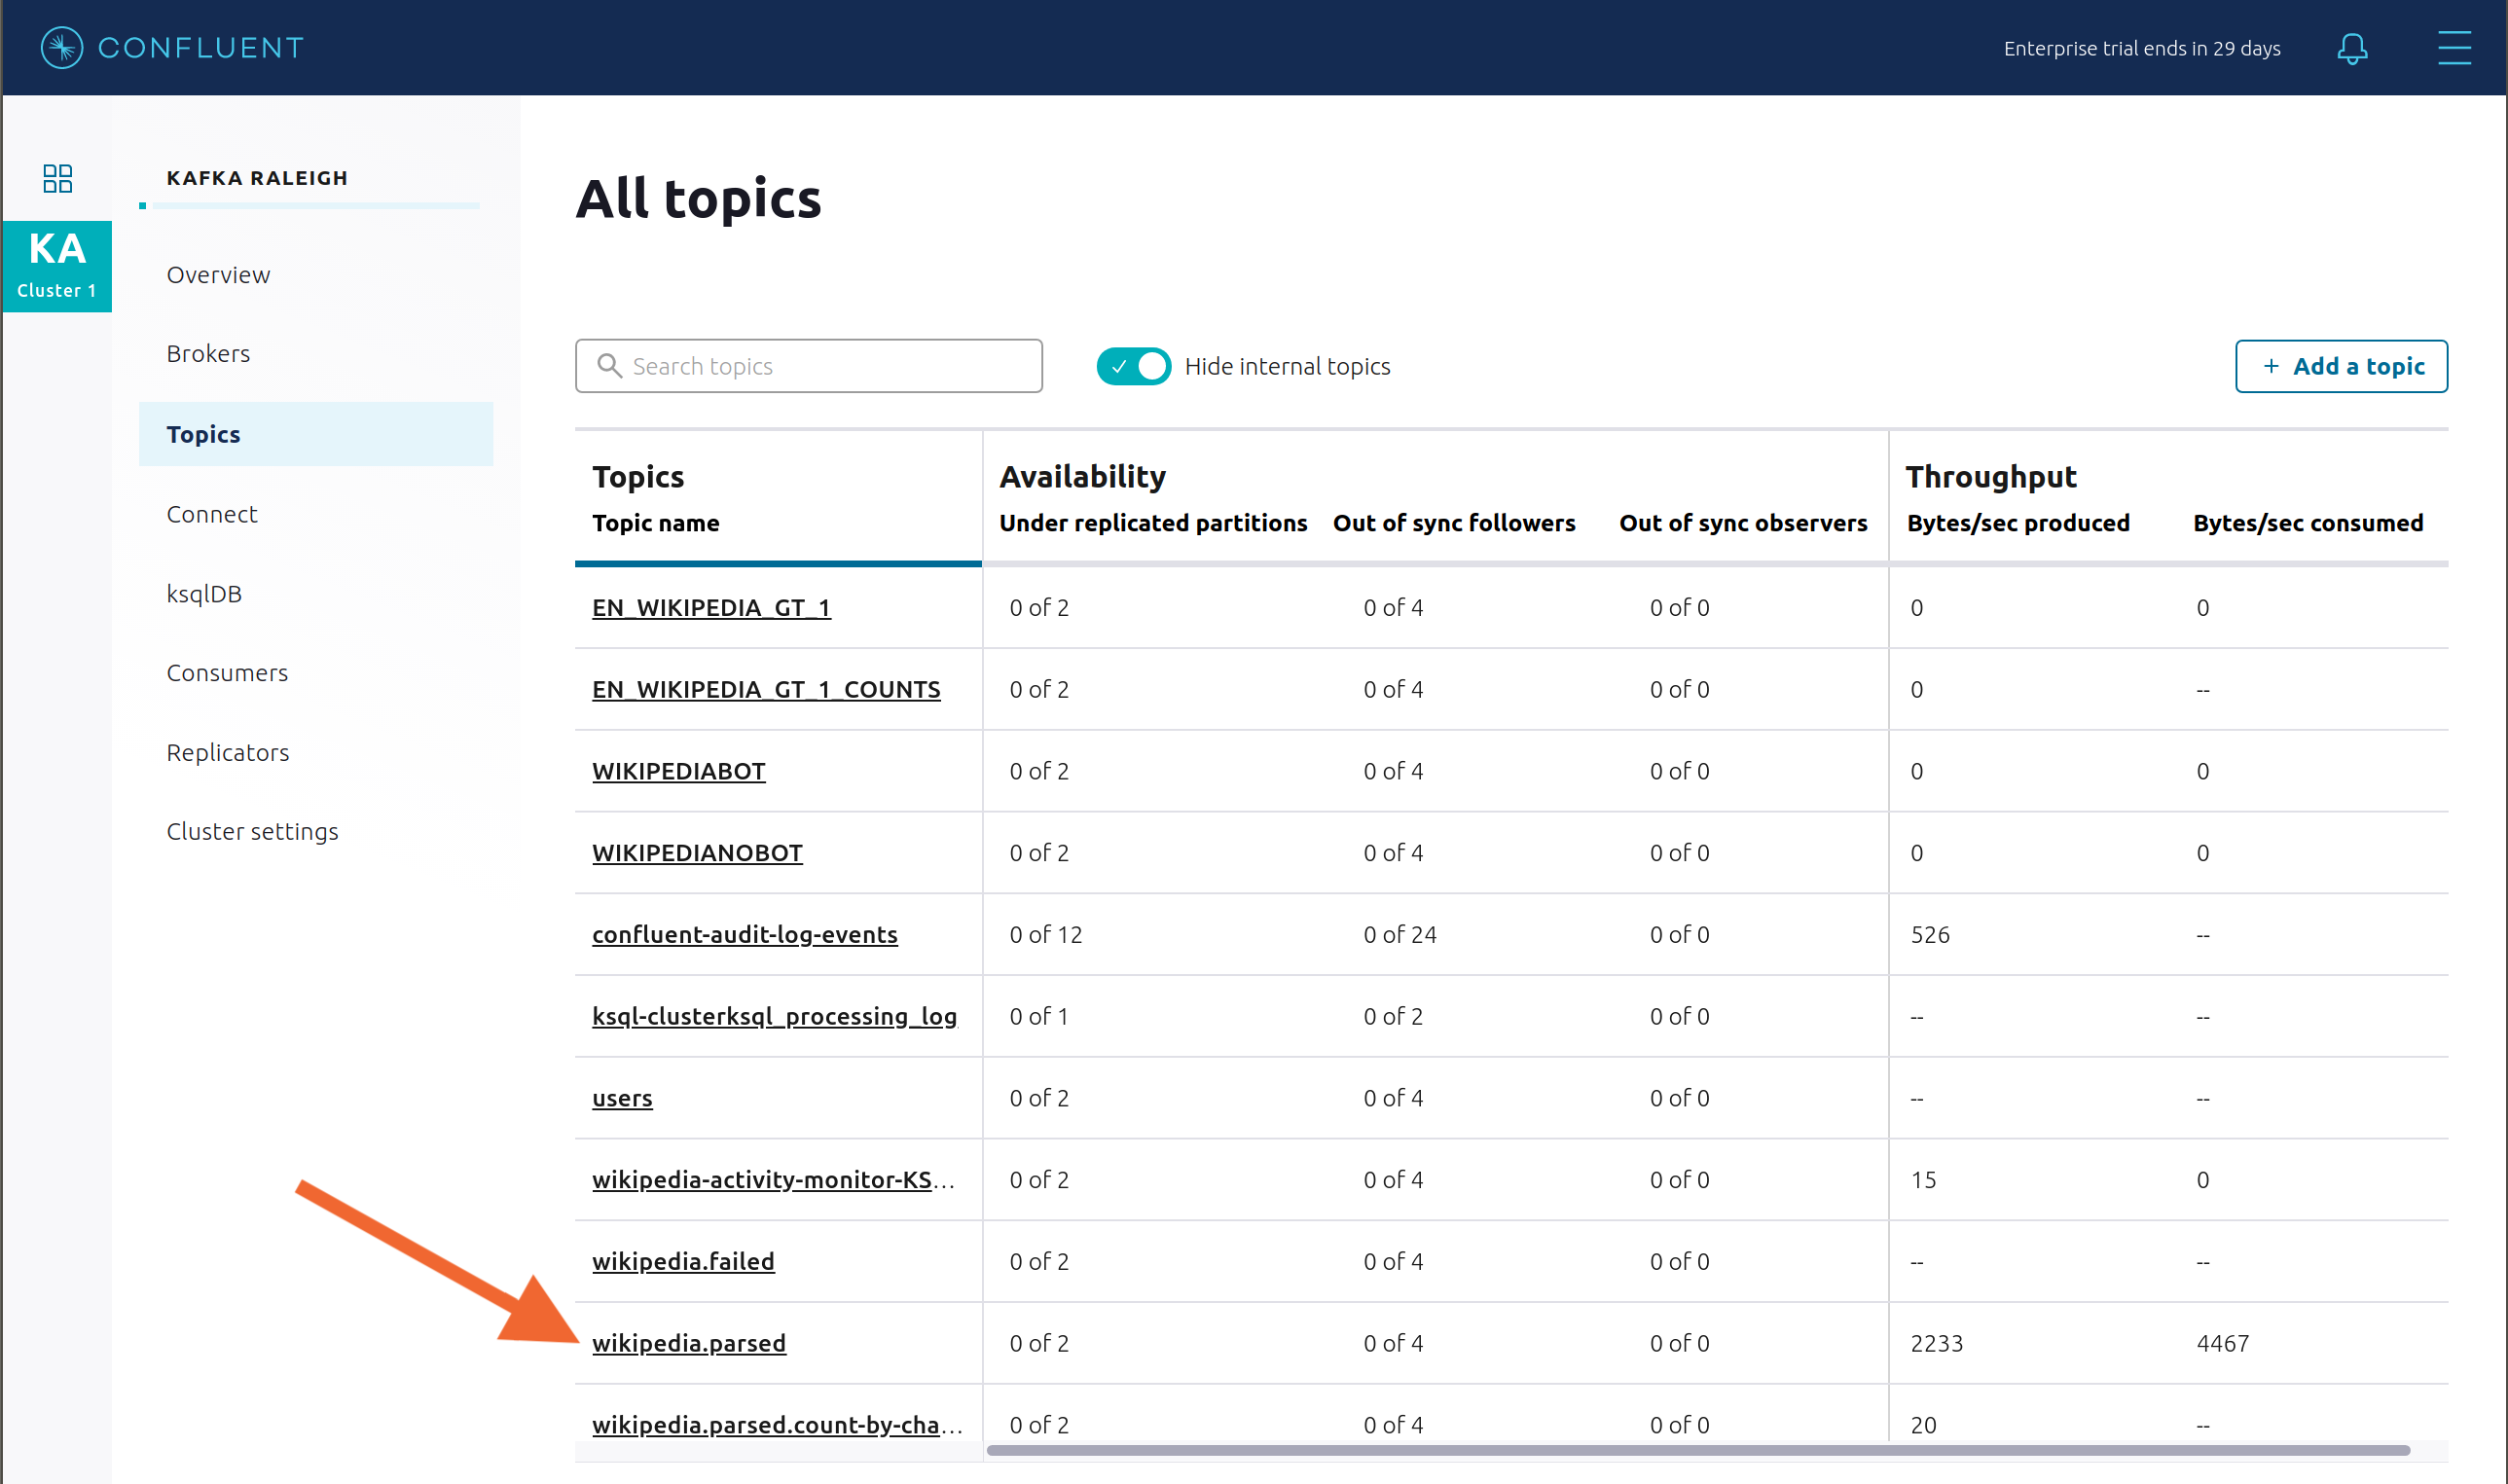
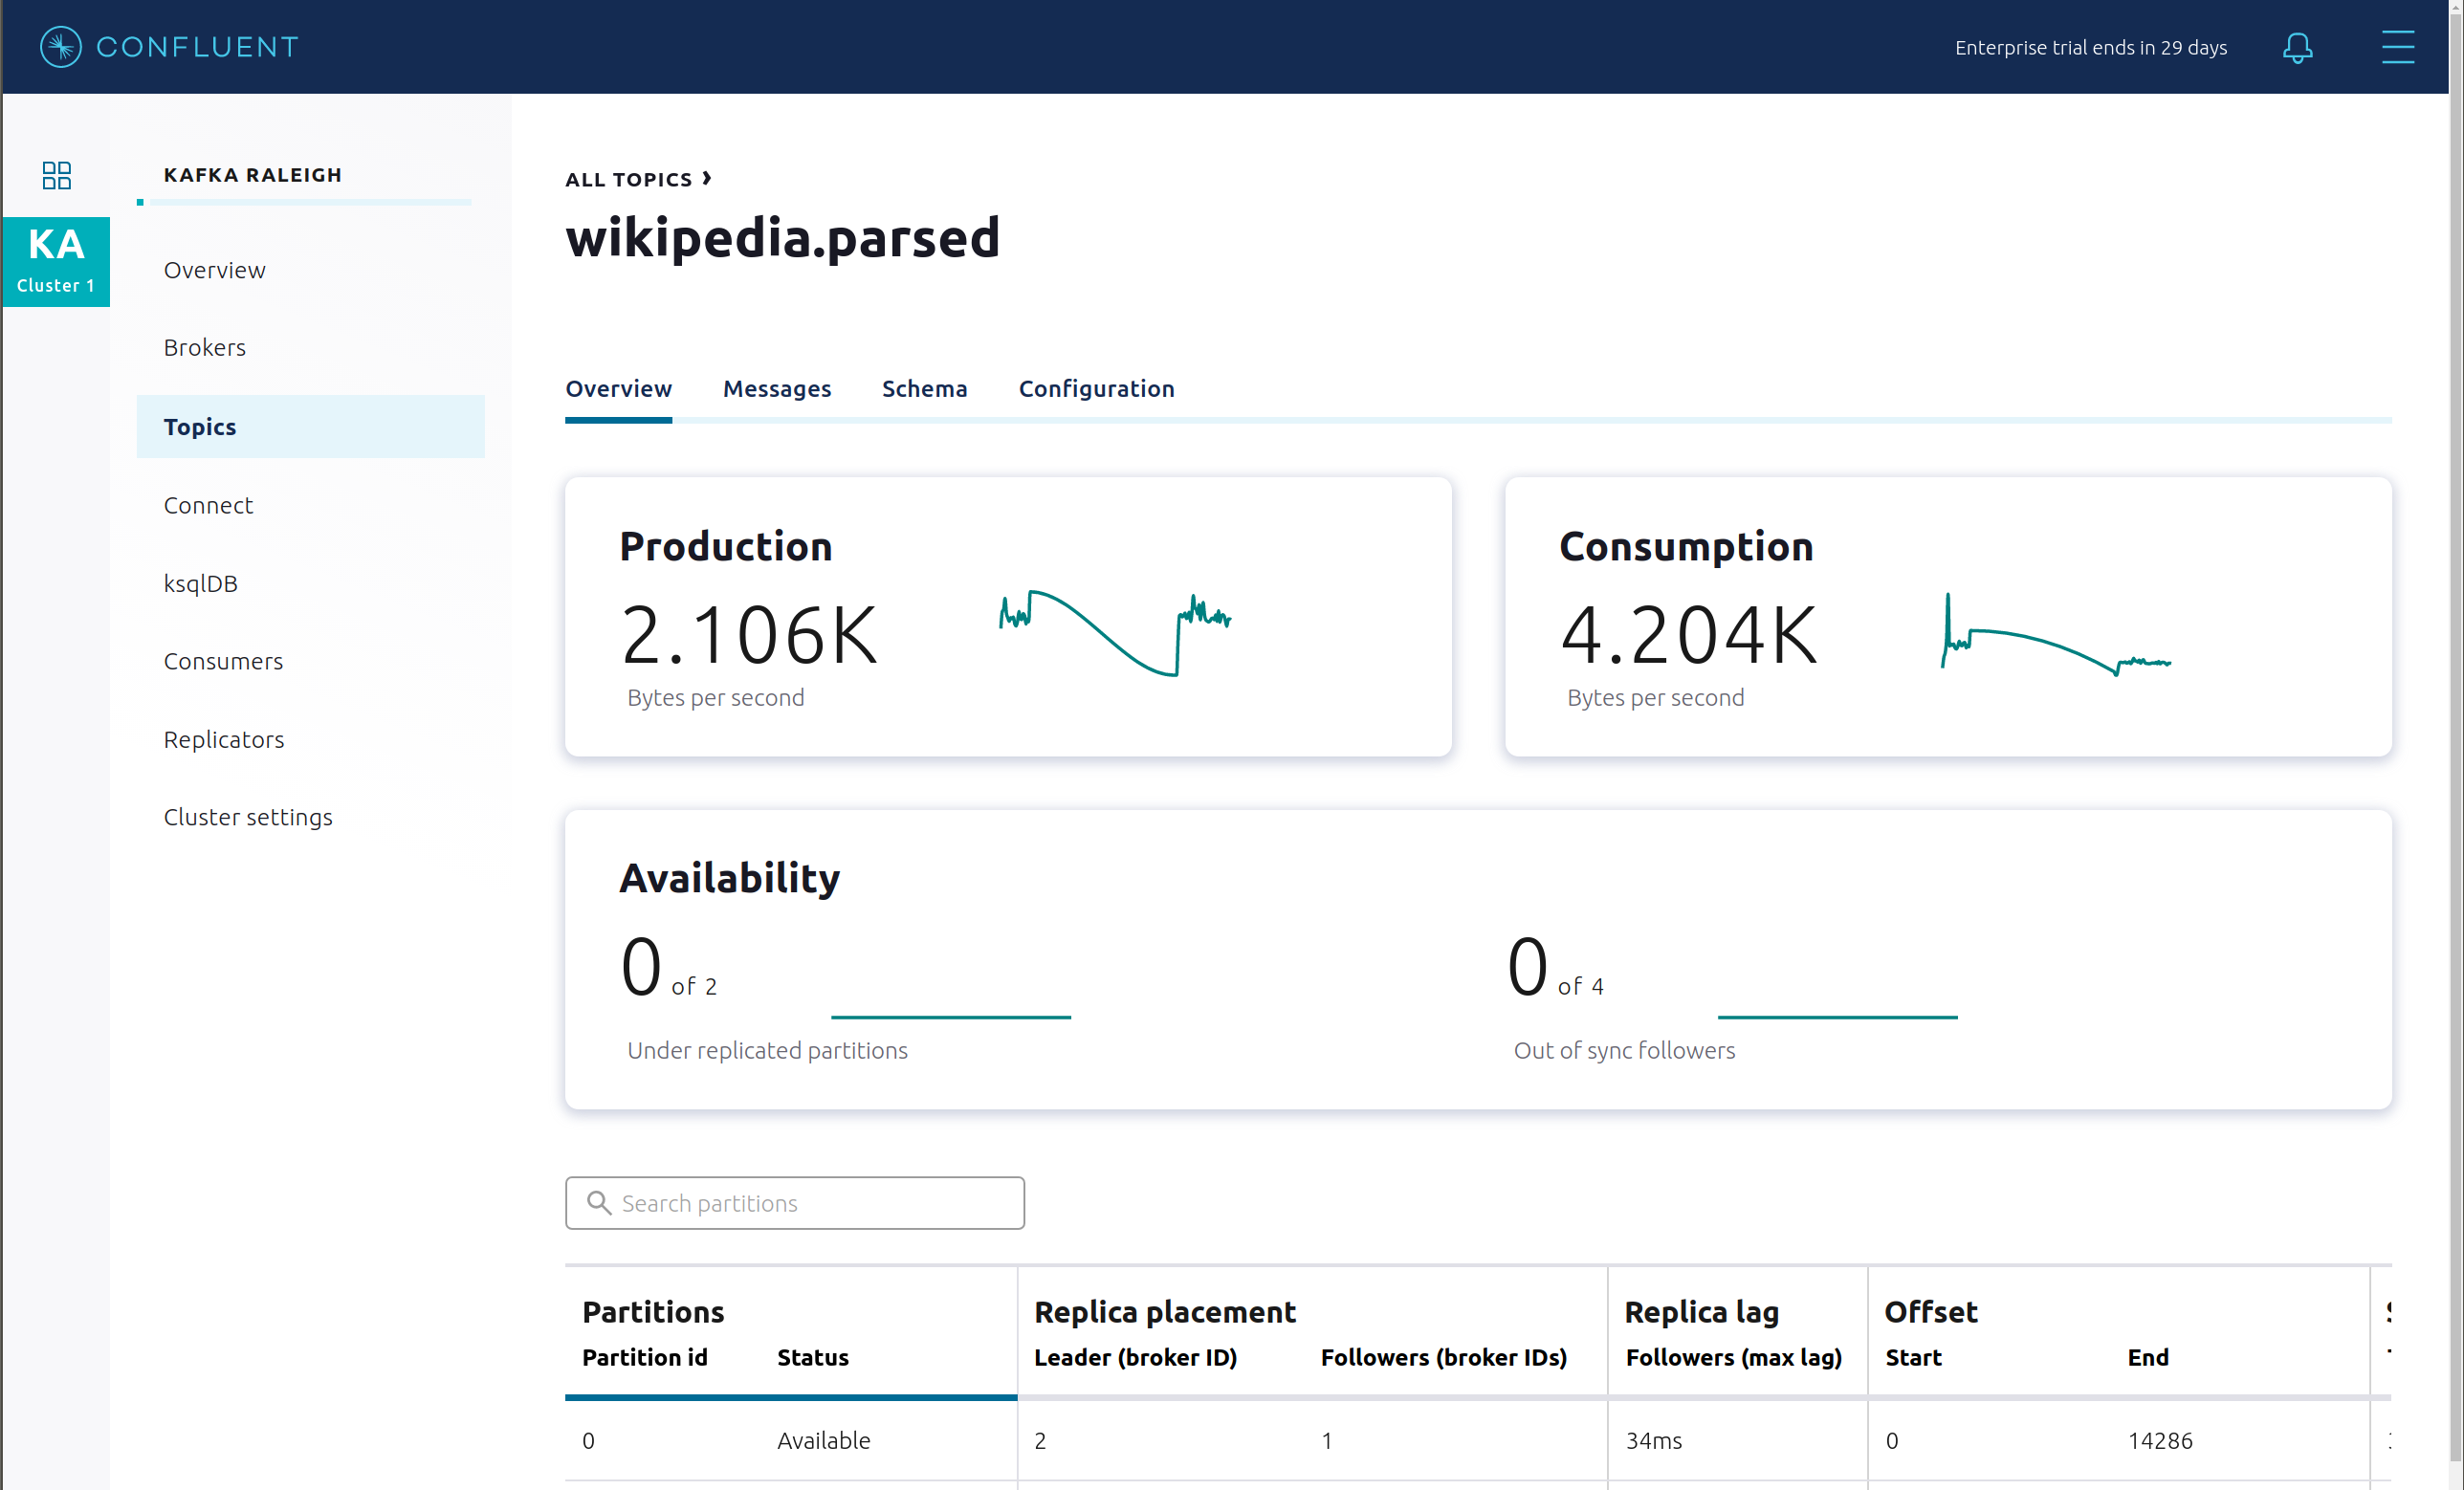
View an overview of this topic:
- Throughput
- Partition replication status
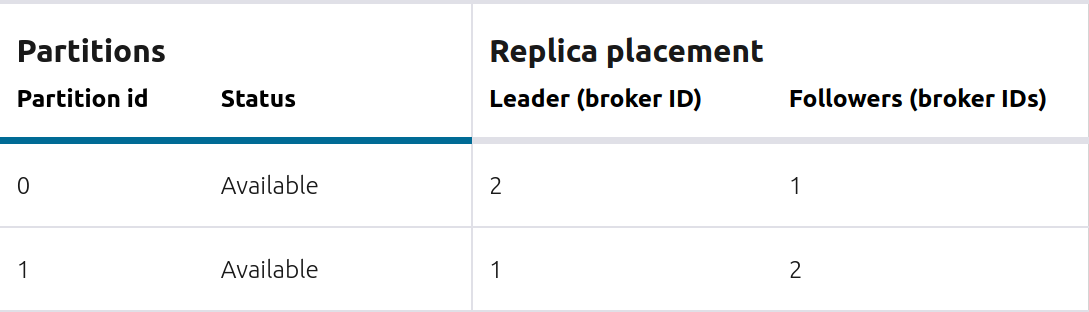
View which brokers are leaders for which partitions and where all partitions reside.
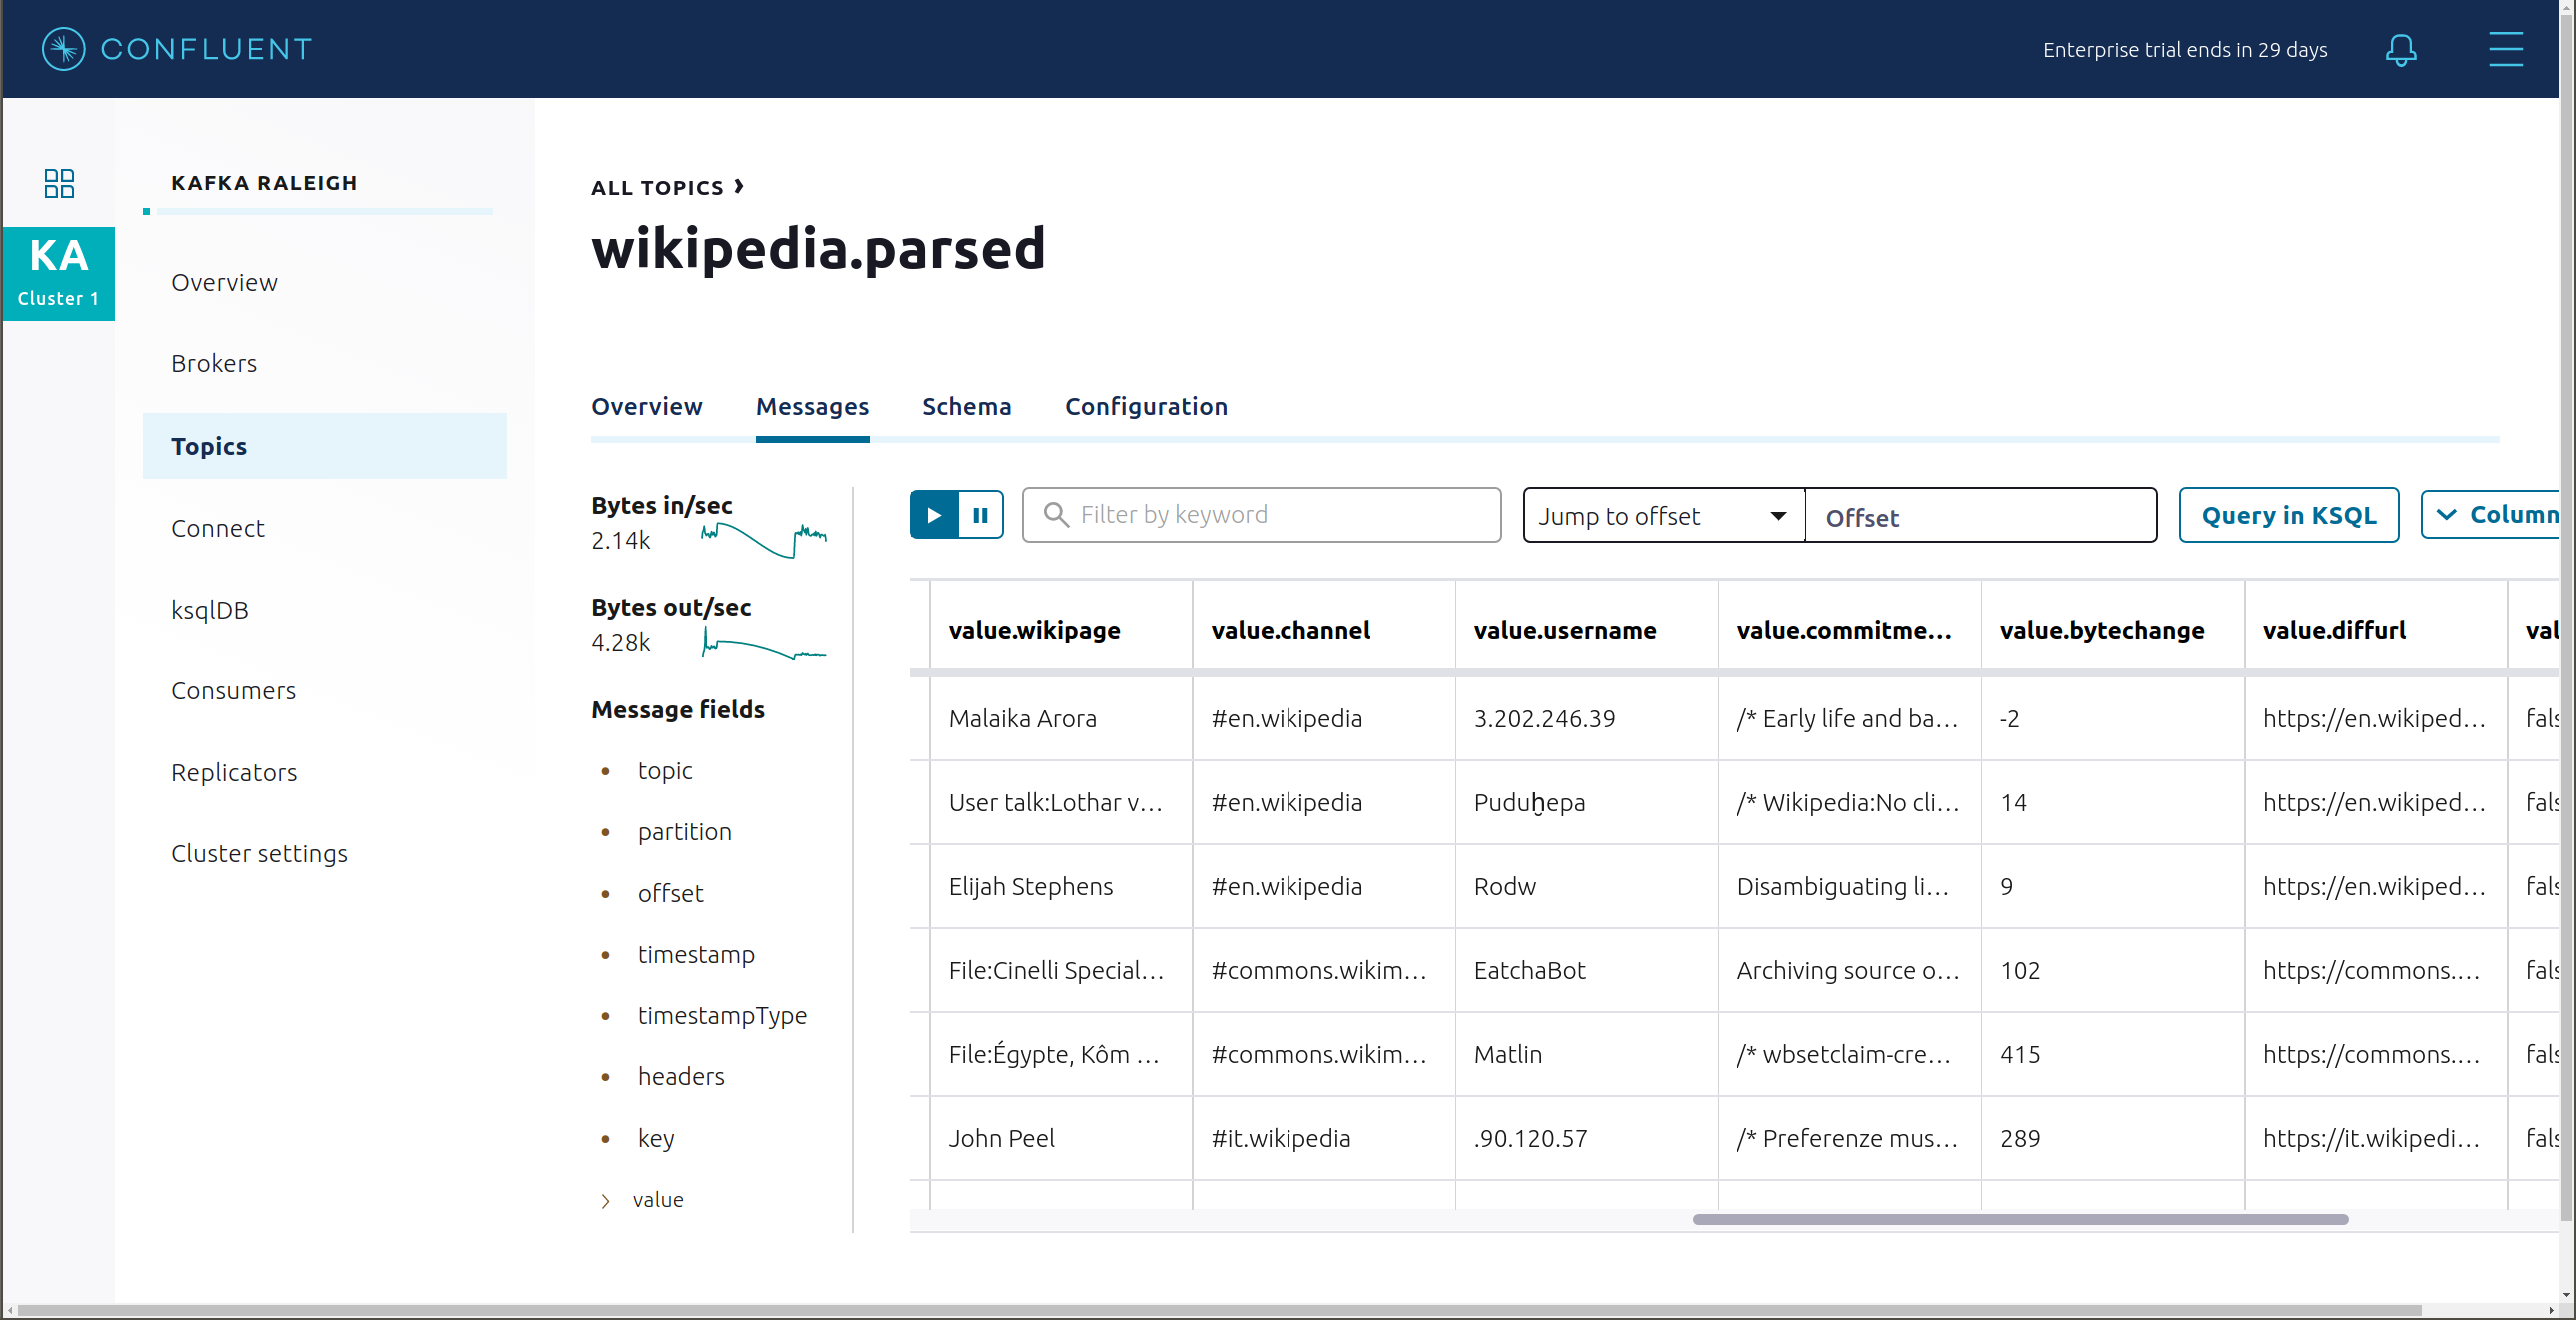
Inspect messages for this topic, in real-time.
View the schema for this topic. For
wikipedia.parsed, the topic value is using a Schema registered with Schema Registry (the topic key is just a string).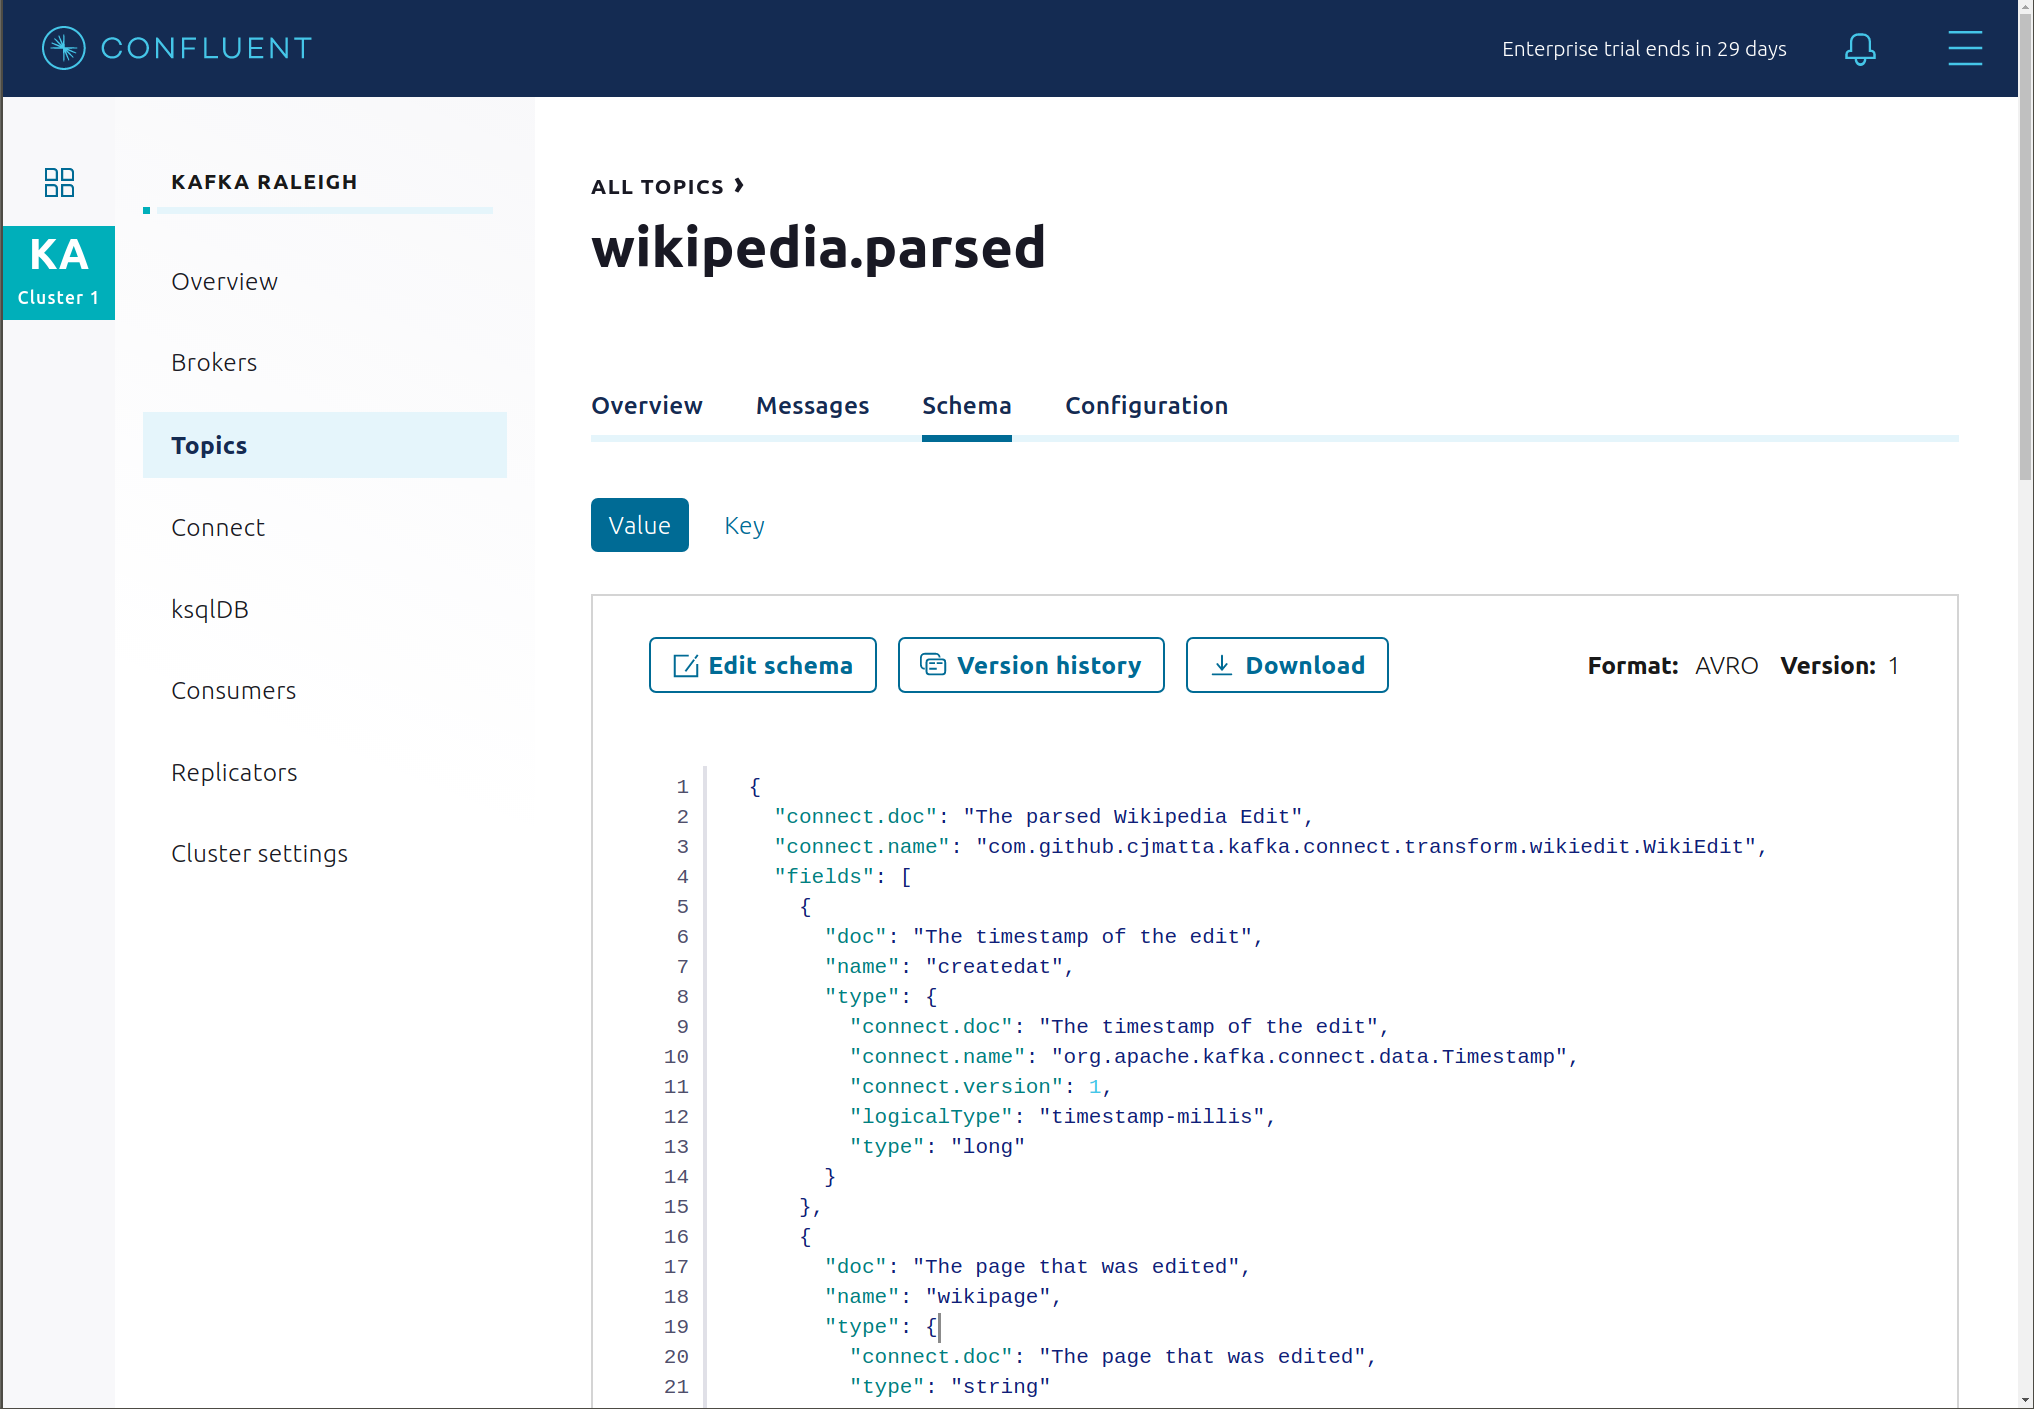
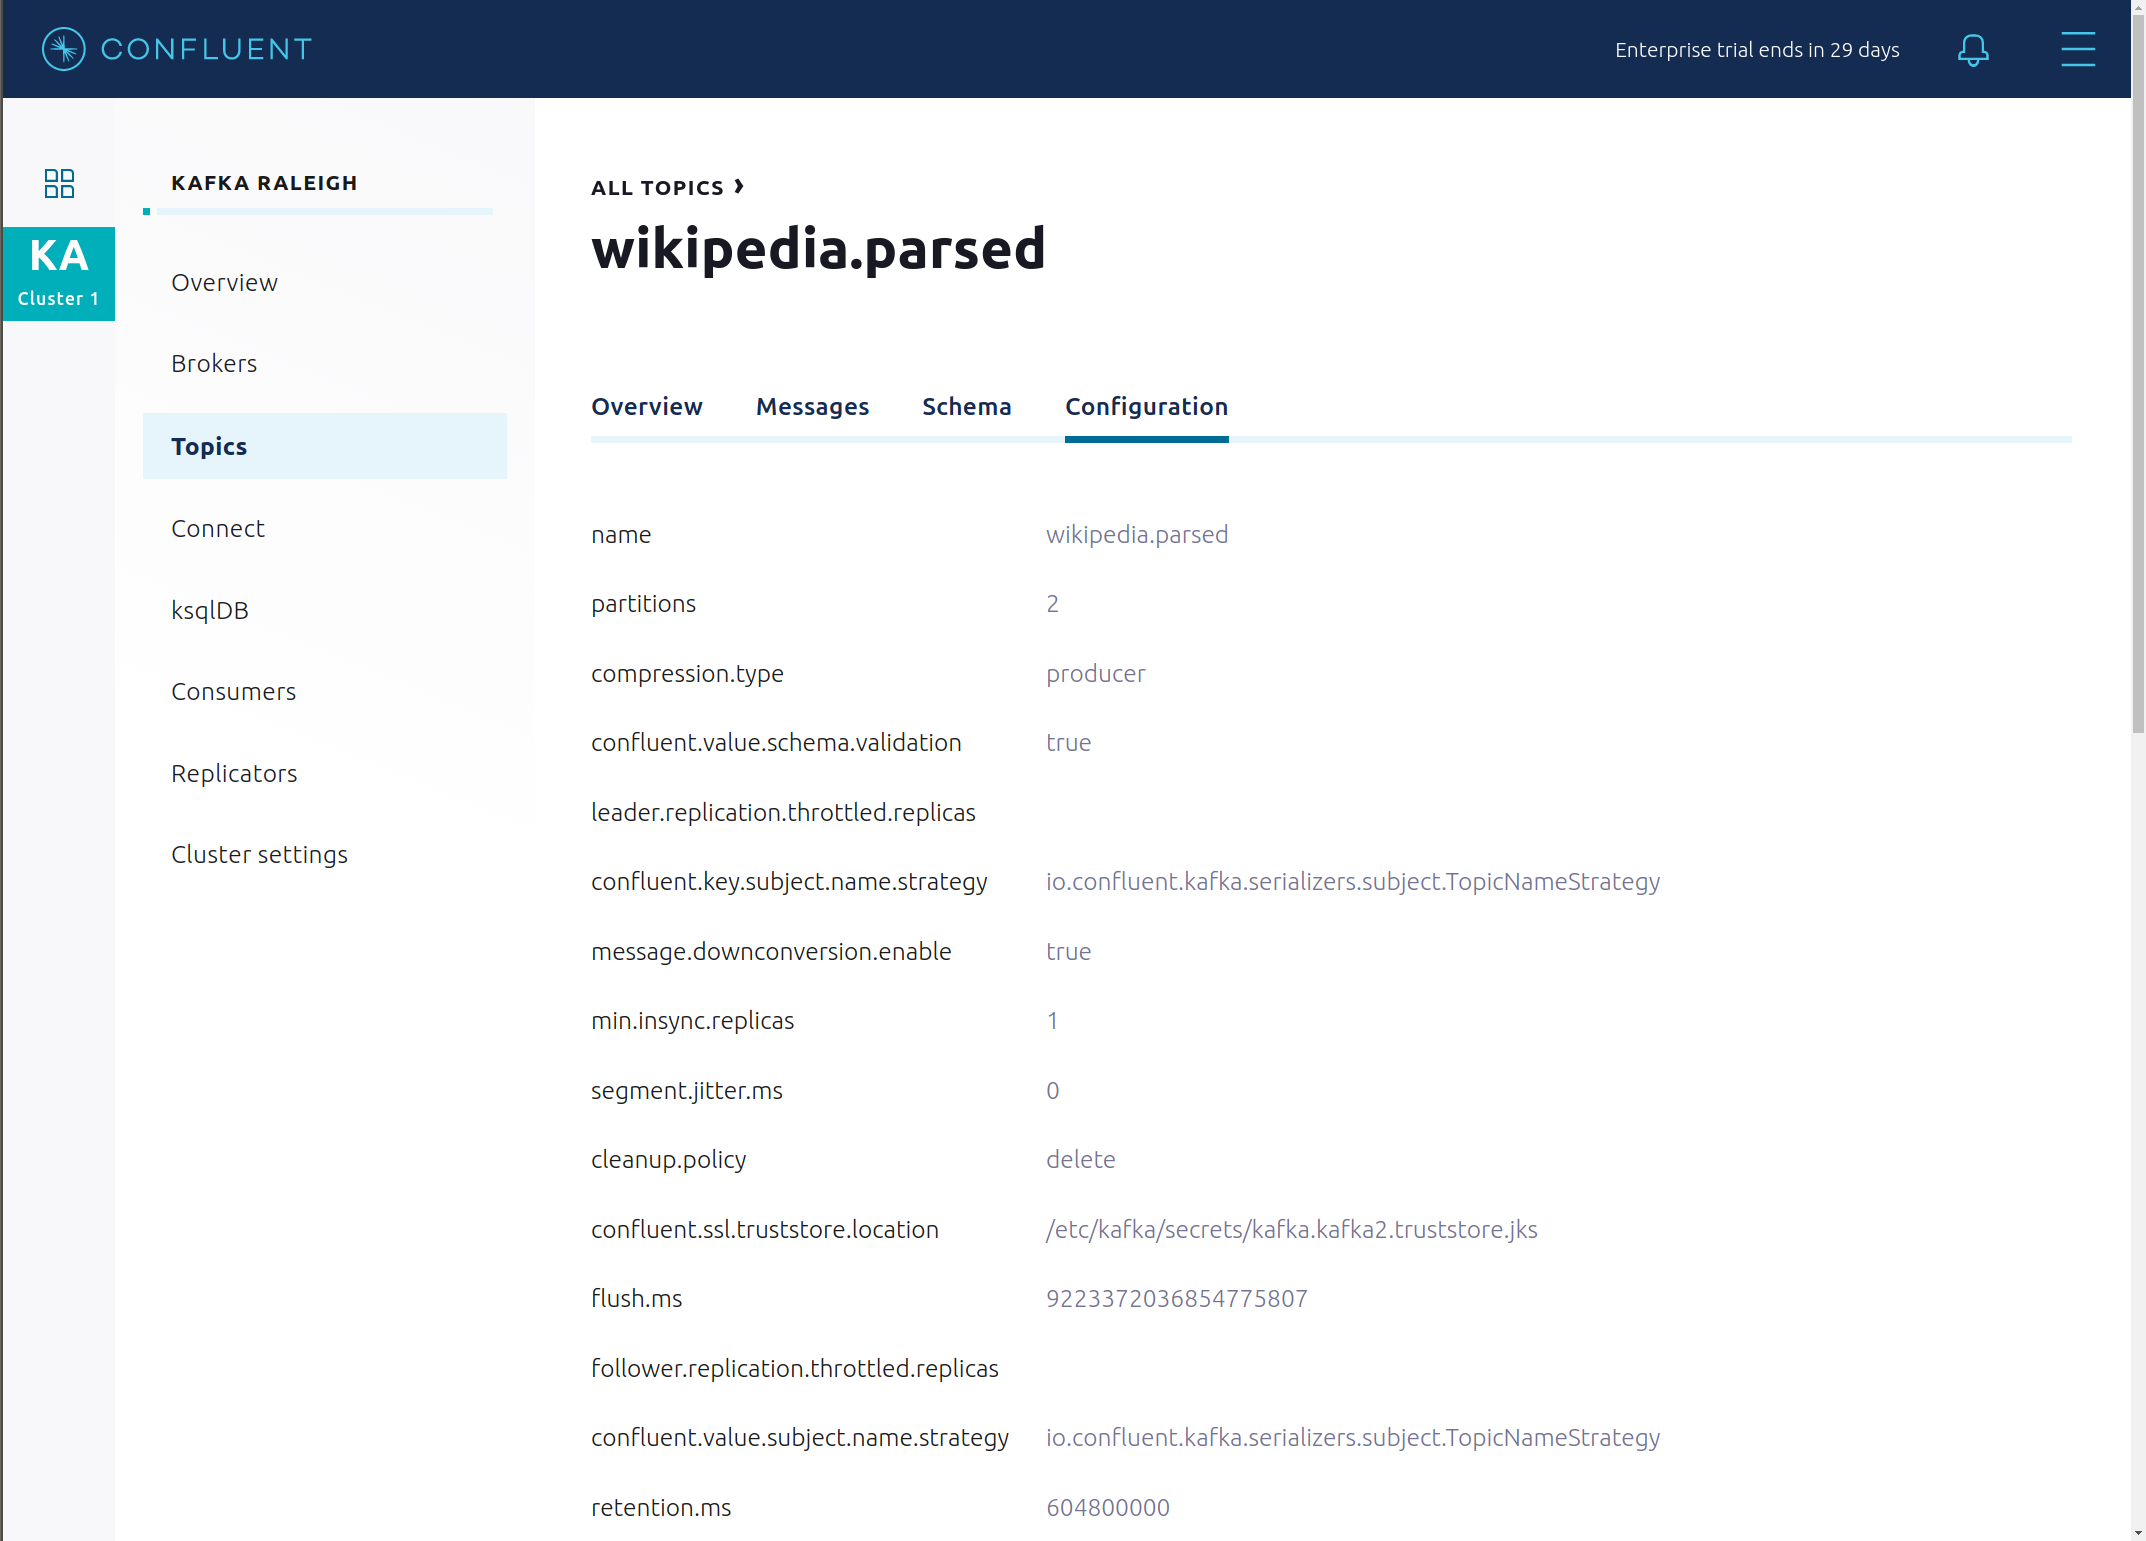
View configuration settings for this topic.
Return to “All Topics”, click on
wikipedia.parsed.count-by-channelto view the output topic from the Kafka Streams application.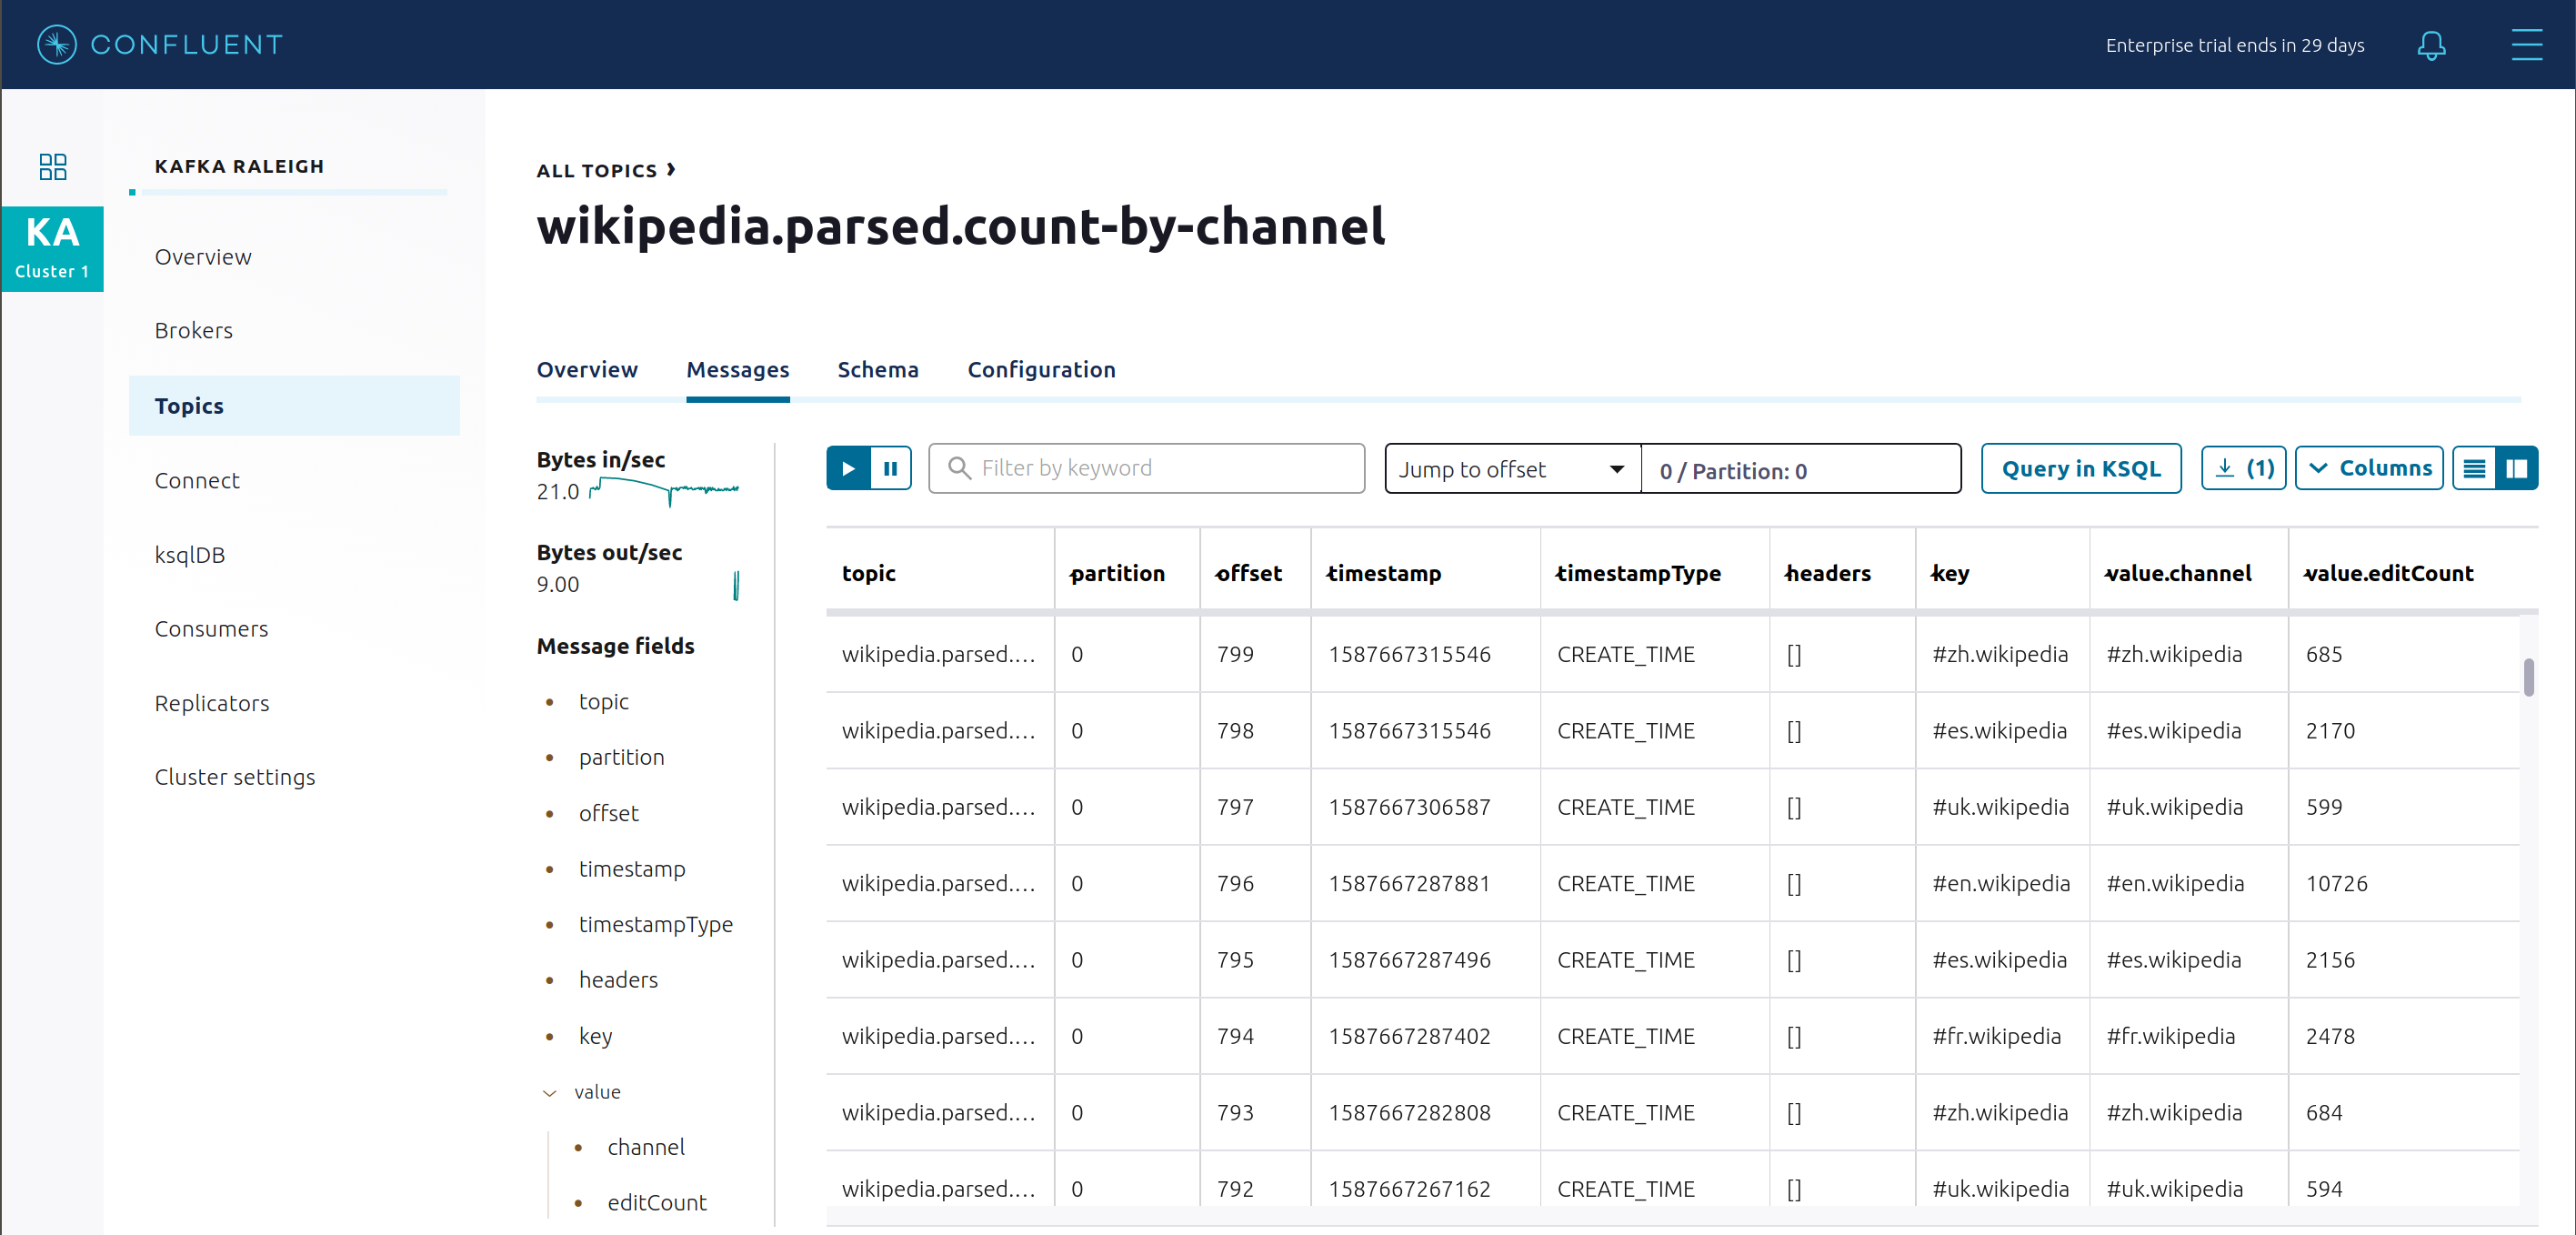
Return to the
All topicsview and click the + Add a topic button on the top right to create a new topic in your Kafka cluster. You can also view and edit settings of Kafka topics in the cluster. Read more on Confluent Control Center topic management.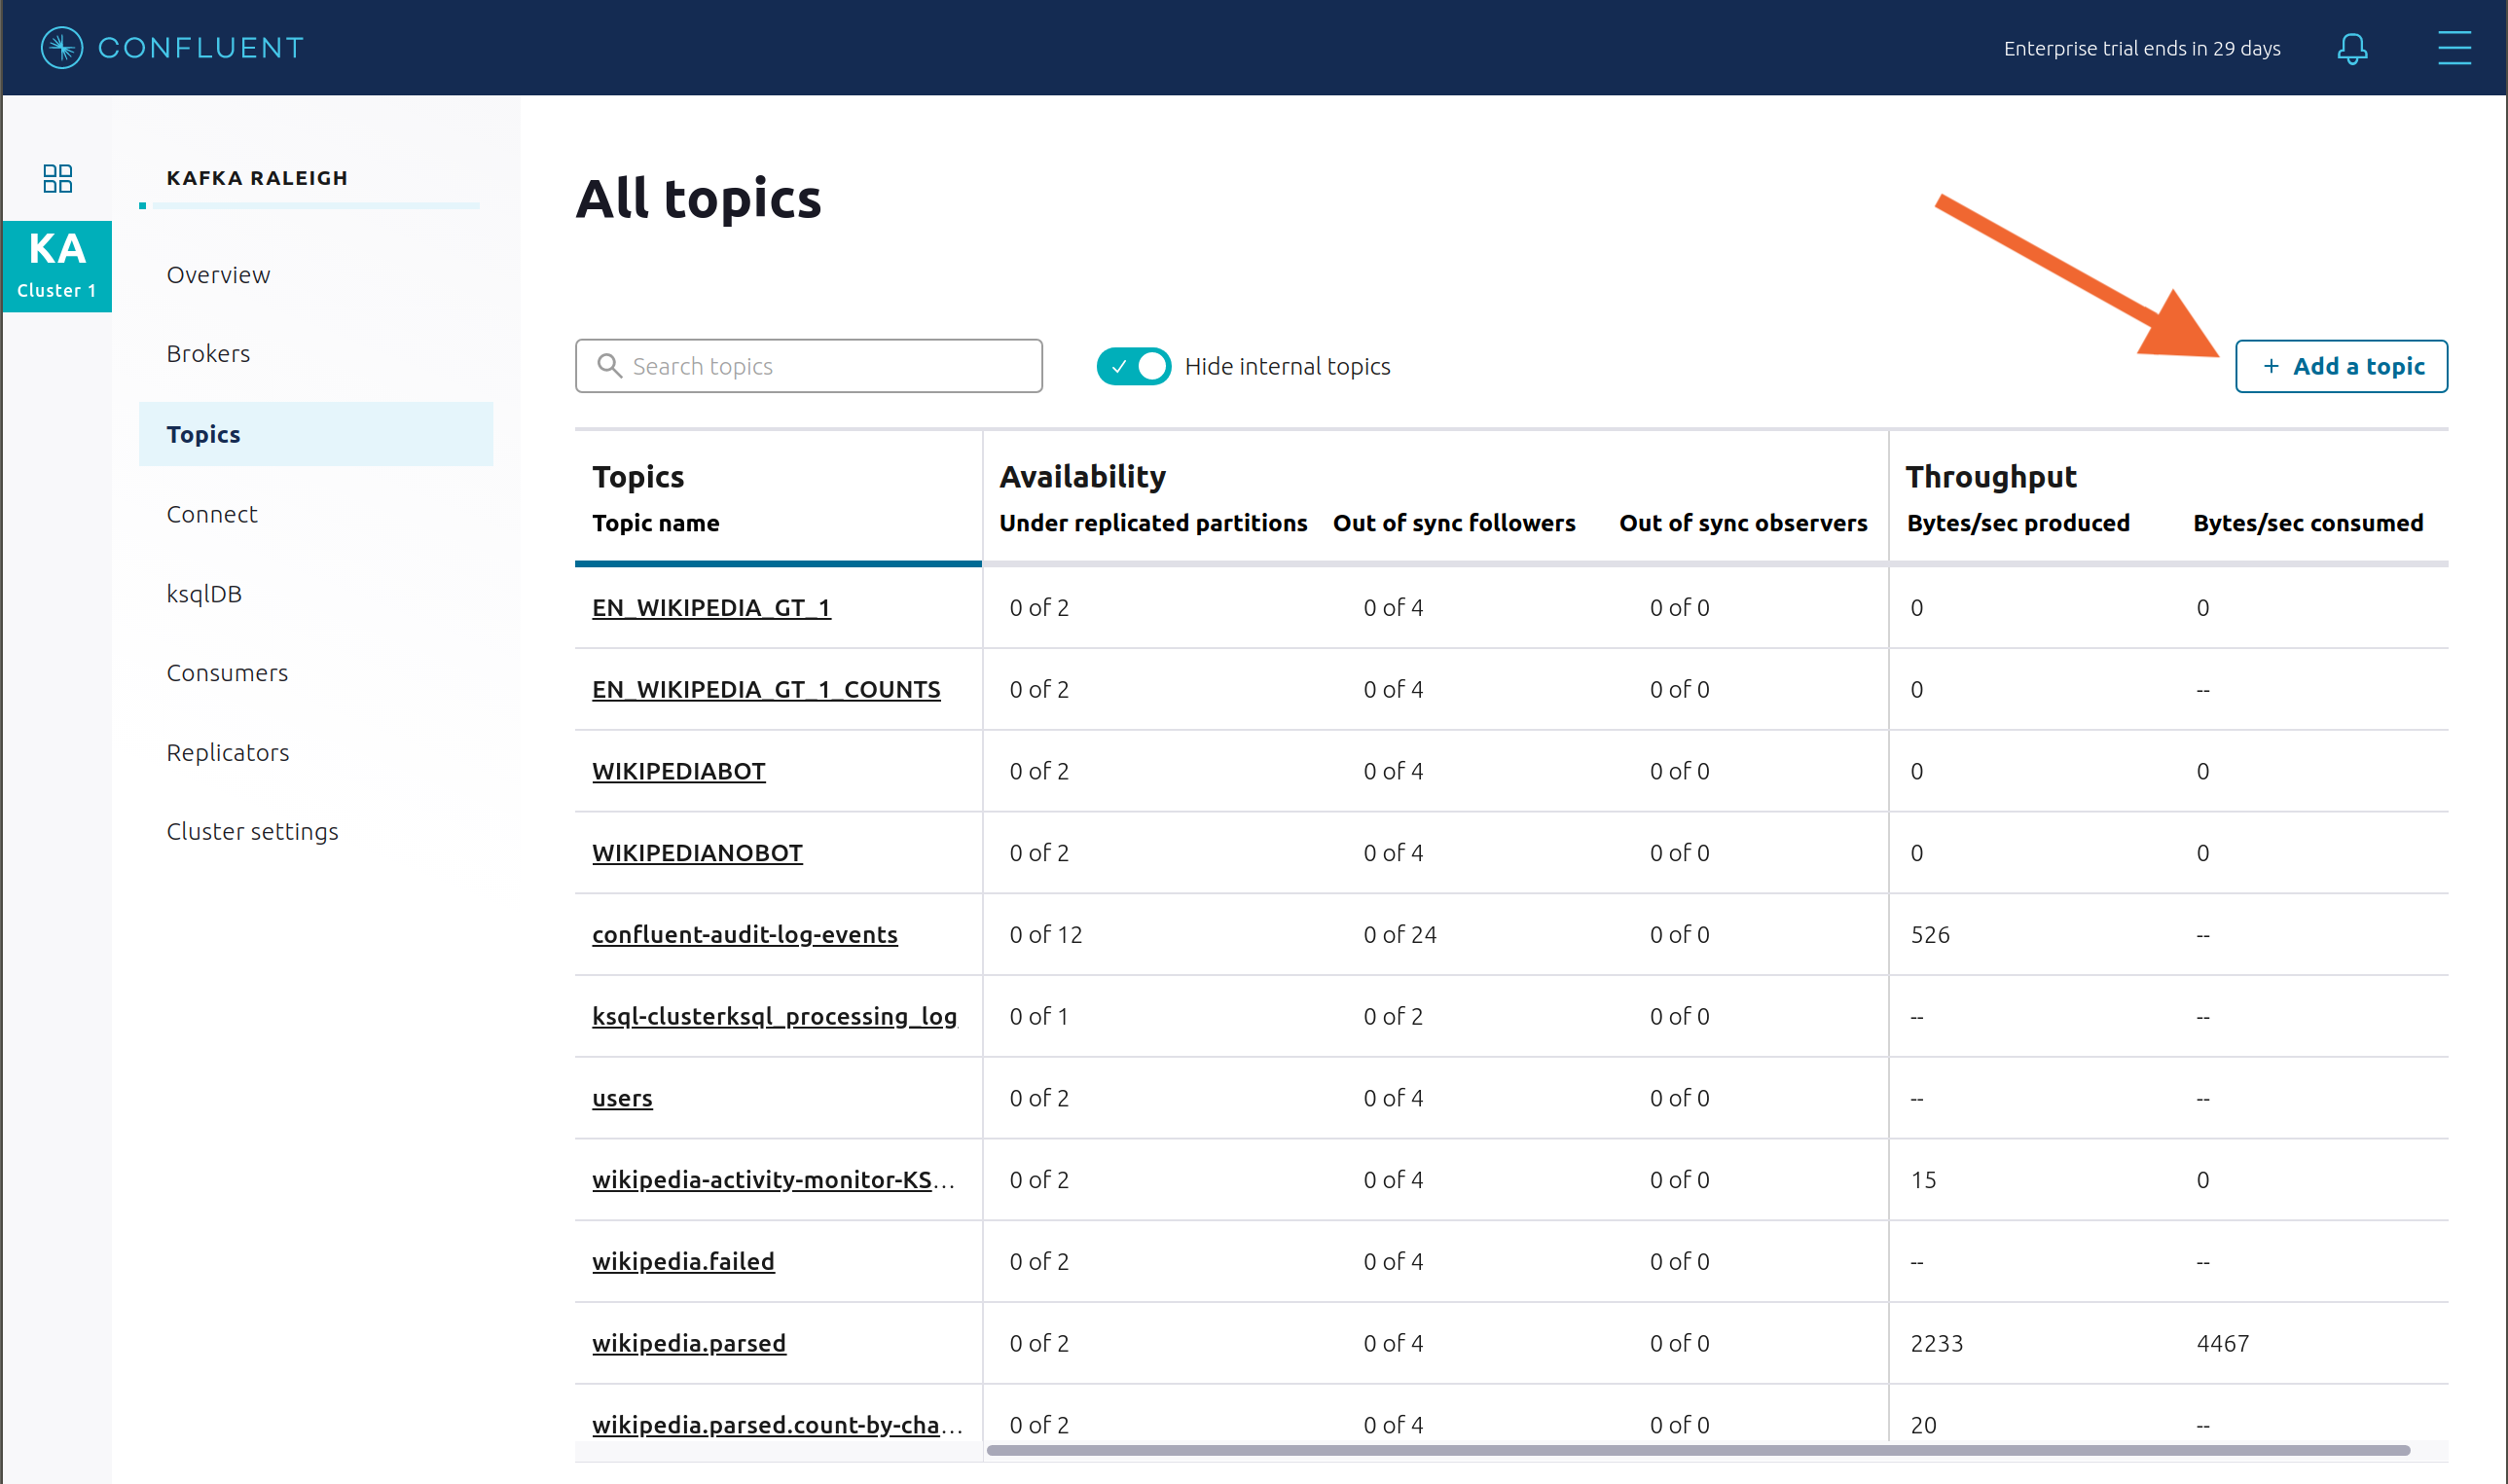
Connect
This example runs three connectors:
- IRC source connector
- Elasticsearch sink connector
- Confluent Replicator
They are running on a Connect worker that is configured with Confluent Platform security features. The connect worker’s embedded producer is configured to be idempotent, exactly-once in order semantics per partition (in the event of an error that causes a producer retry, the same message—which is still sent by the producer multiple times—will only be written to the Kafka log on the broker once).
Confluent Control Center uses the Kafka Connect API to manage multiple connect clusters. Click on “Connect”.
Select
connect1, the name of the cluster of Connect workers.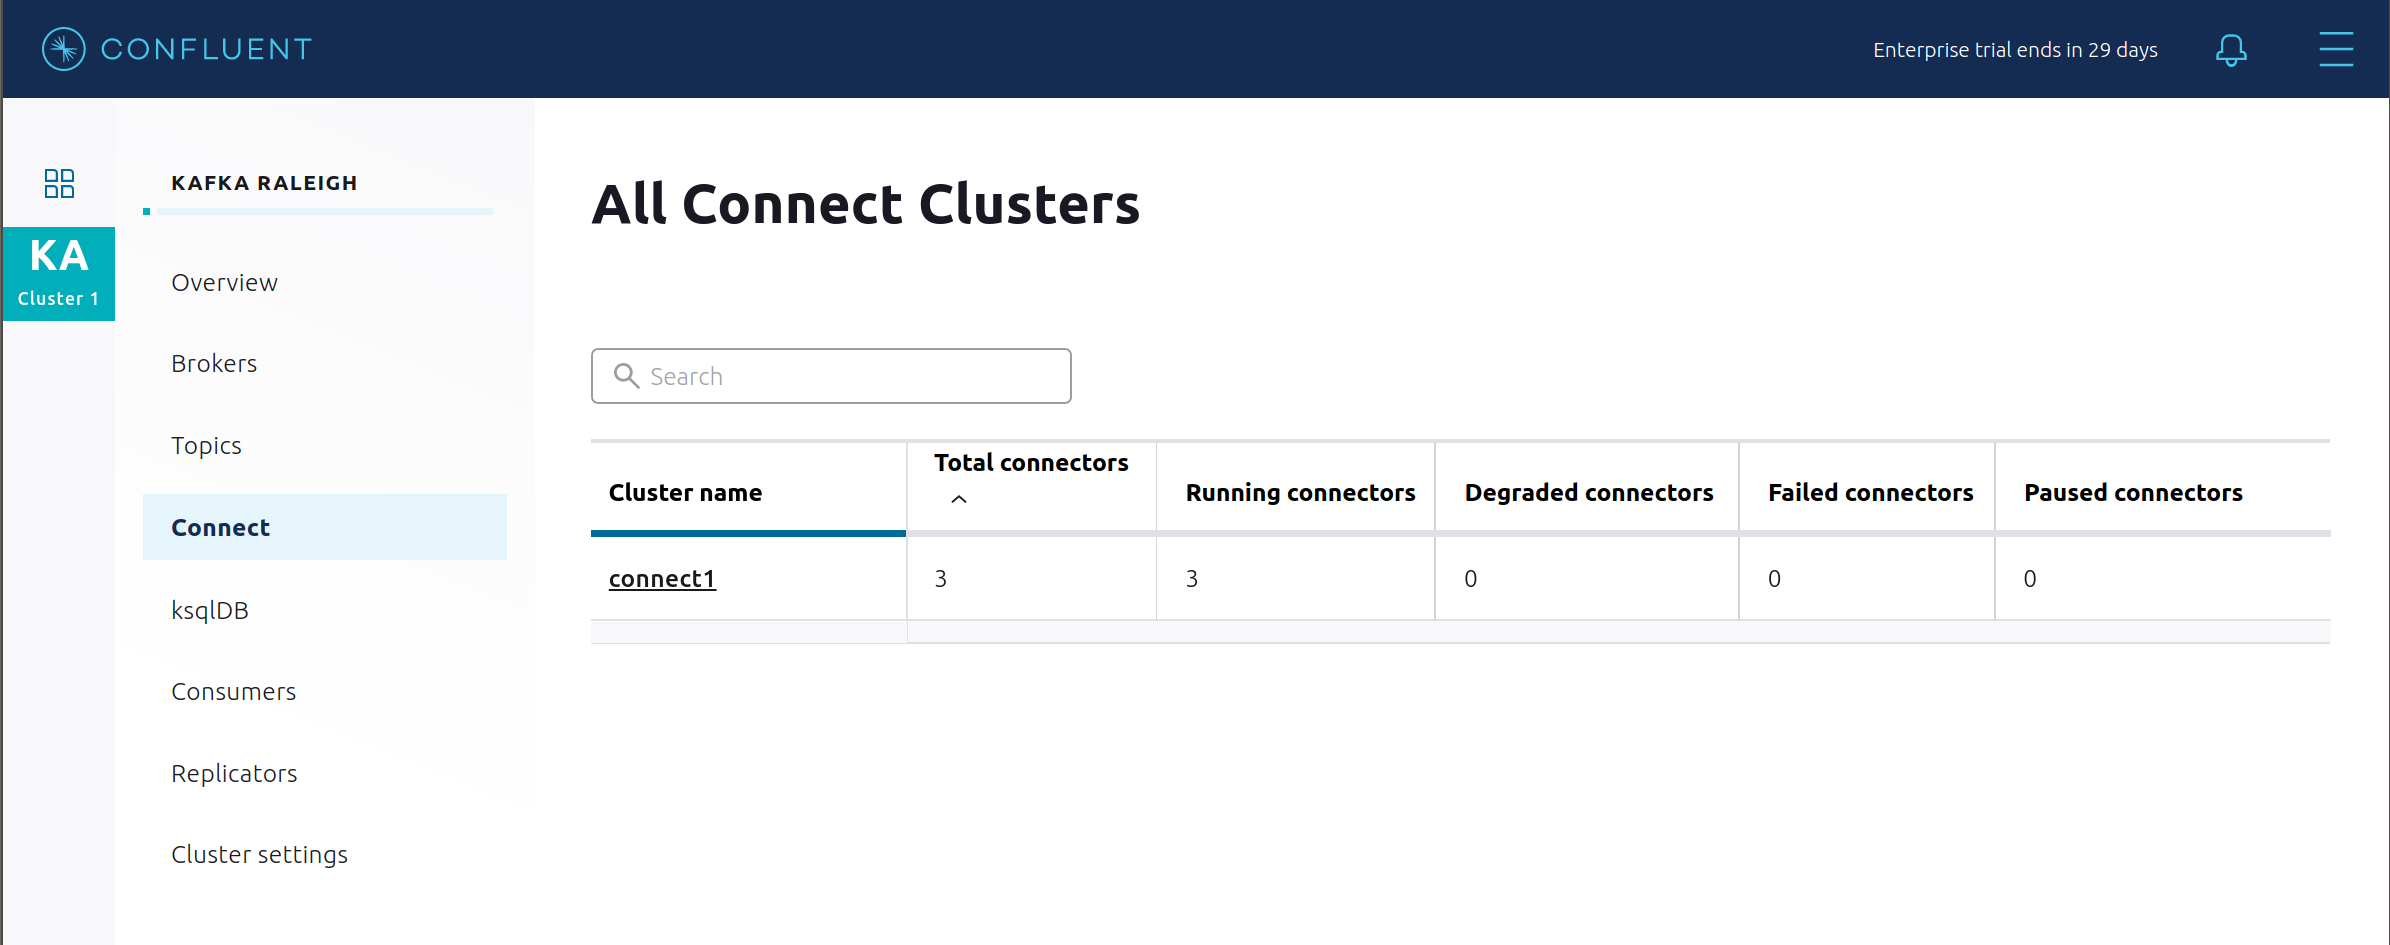
Verify the connectors running in this example:
- source connector
wikipedia-ircview the example’s IRC source connector configuration file. - source connector
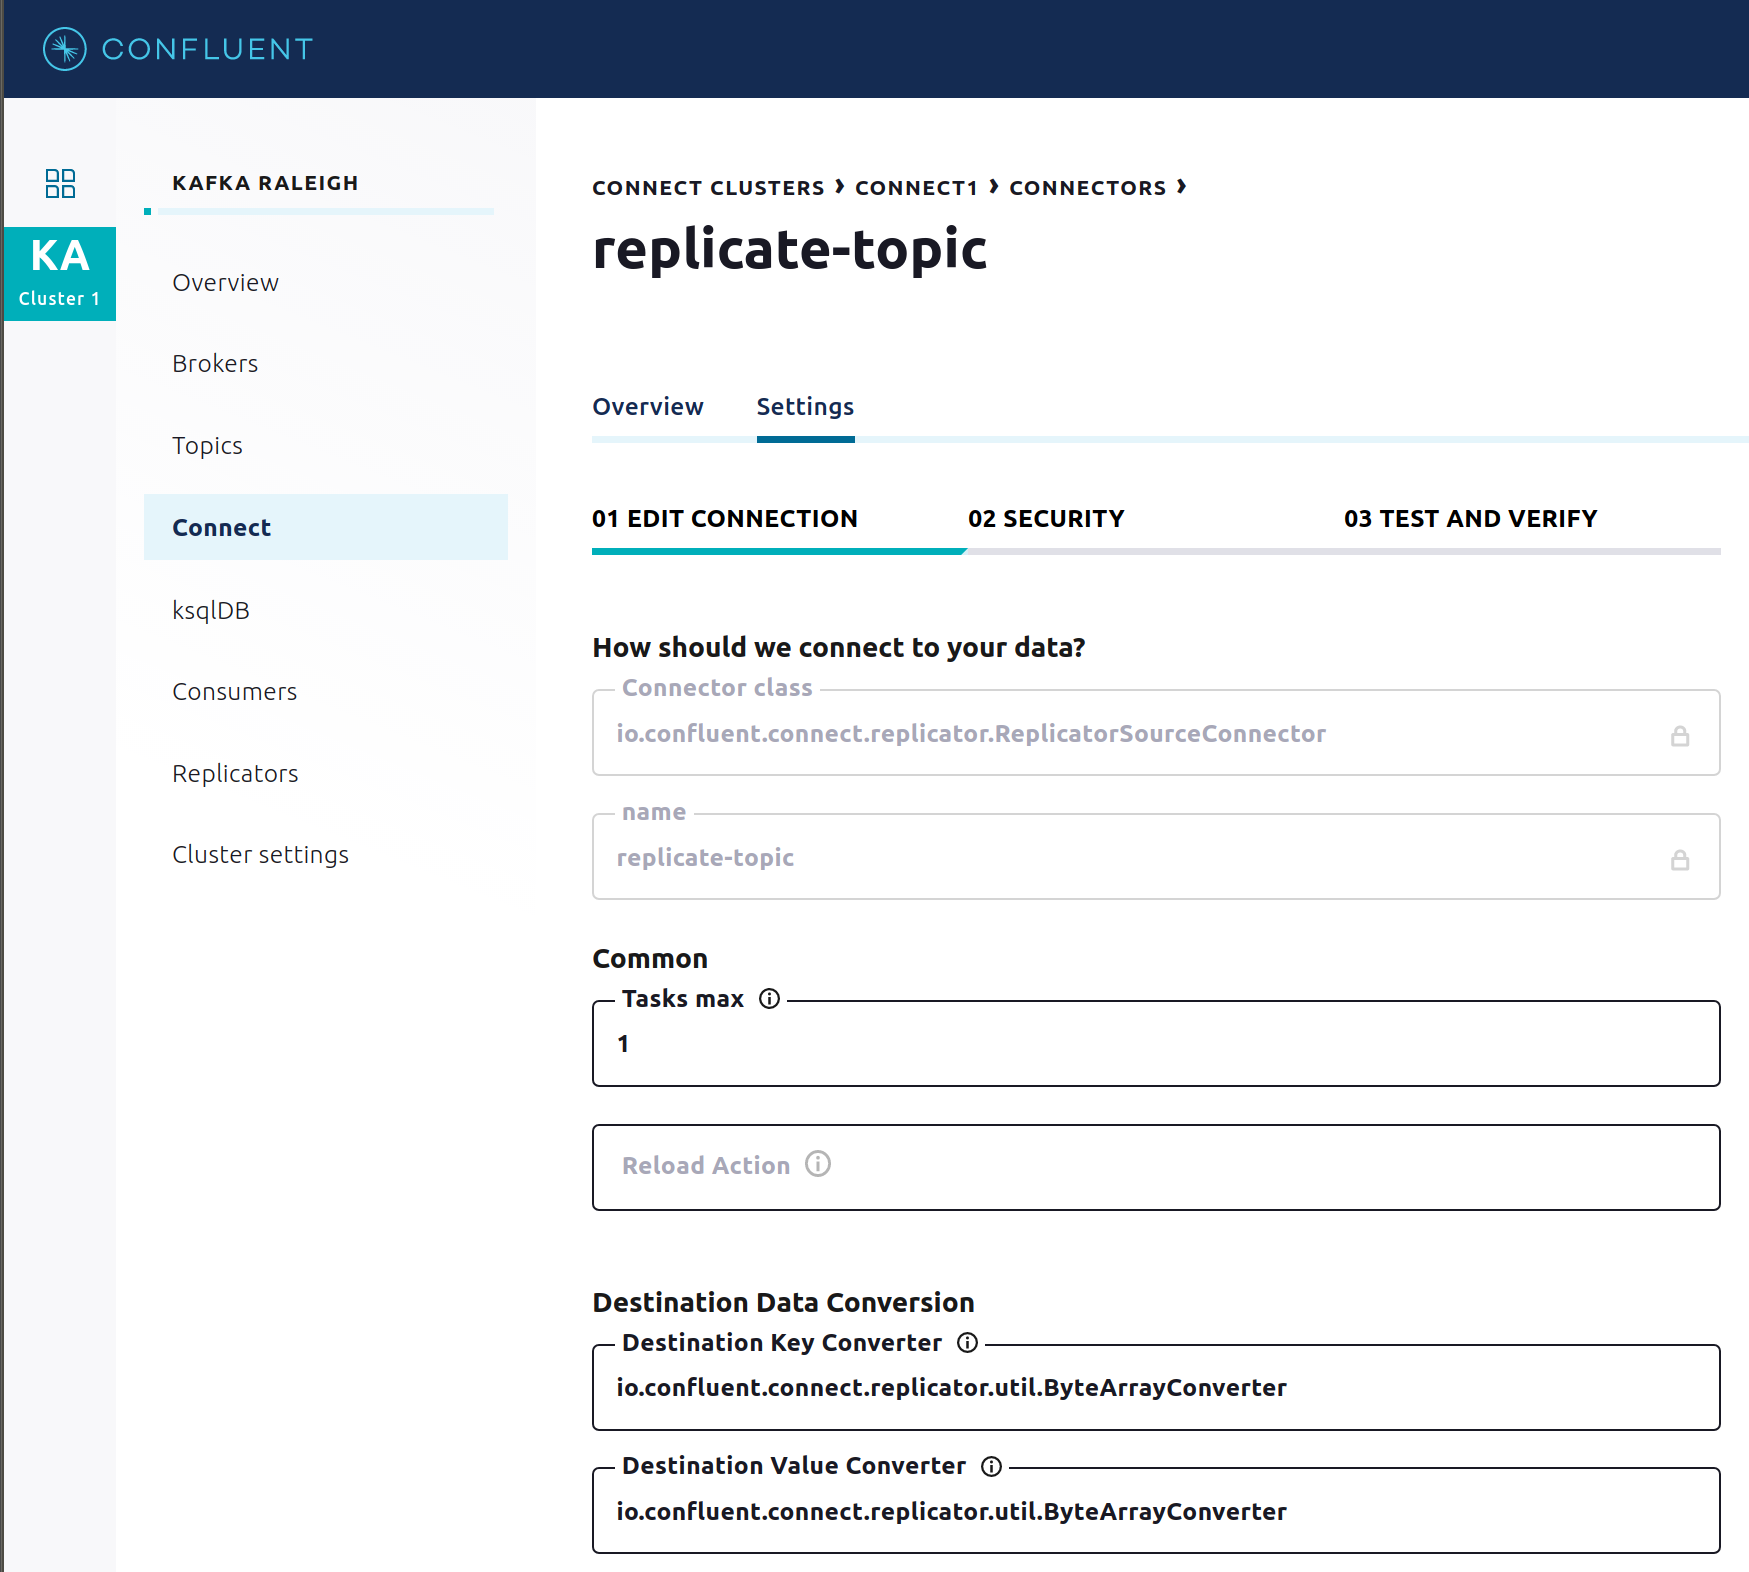
replicate-topic: view the example’s Replicator connector configuration file. - sink connector
elasticsearch-ksqldbconsuming from the Kafka topicWIKIPEDIABOT: view the example’s Elasticsearch sink connector configuration file.
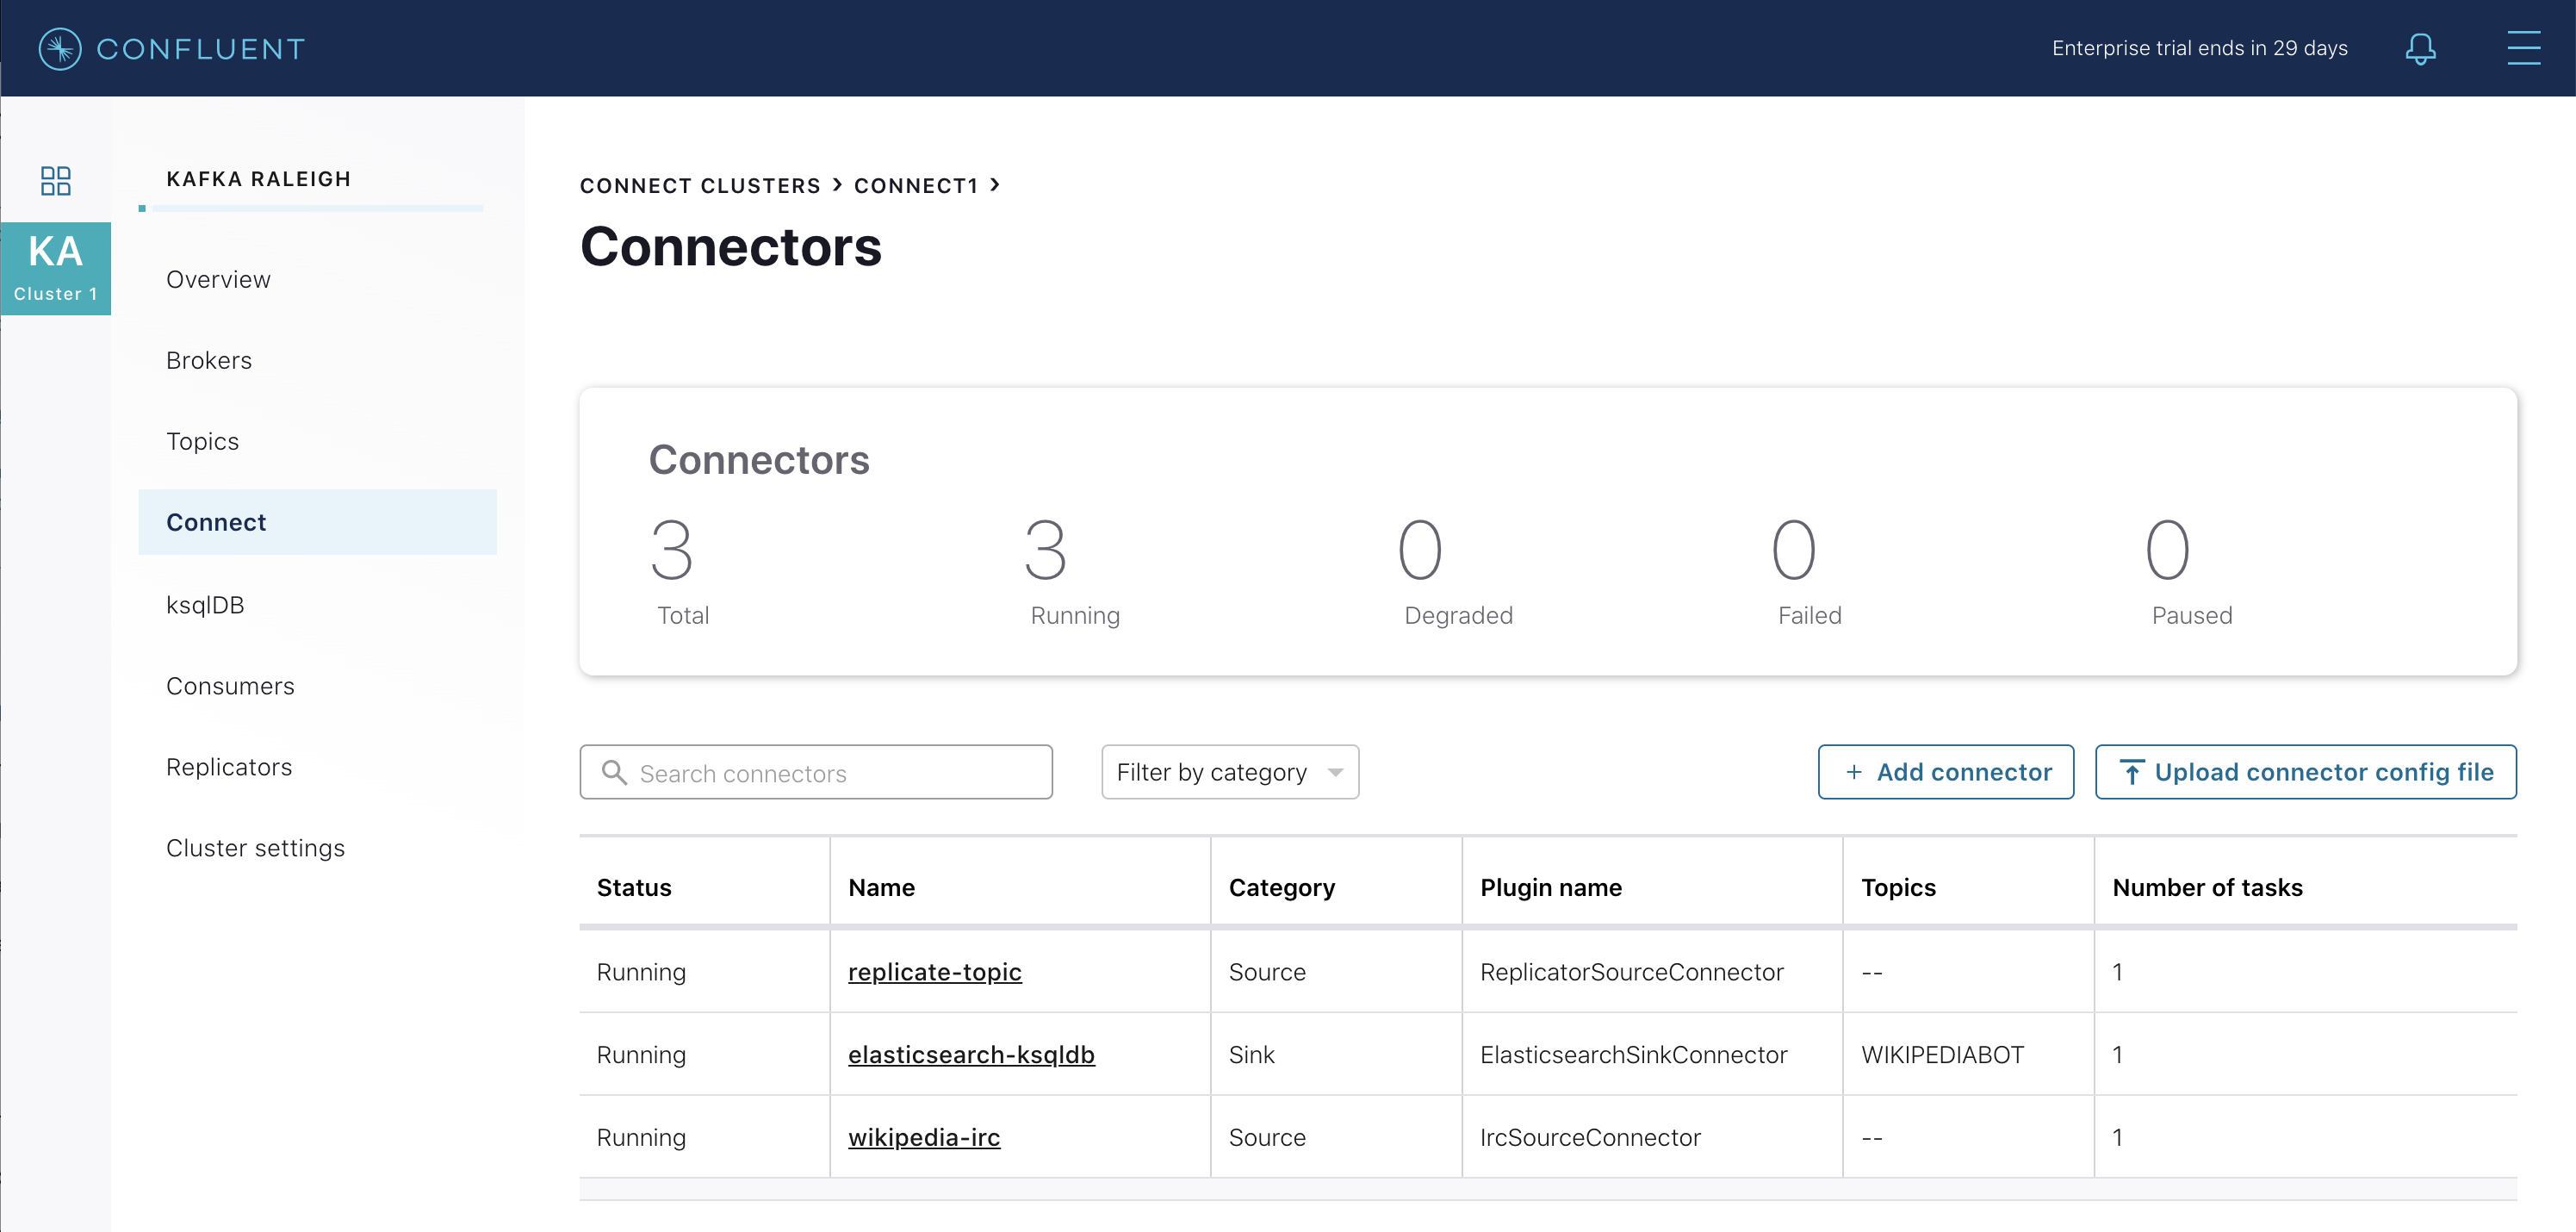
- source connector
Click any connector name to view or modify any details of the connector configuration and custom transforms.
ksqlDB
In this example, ksqlDB is authenticated and authorized to connect to the secured Kafka cluster, and it is already running queries as defined in the ksqlDB command file . Its embedded producer is configured to be idempotent, exactly-once in order semantics per partition (in the event of an error that causes a producer retry, the same message—which is still sent by the producer multiple times—will only be written to the Kafka log on the broker once).
In the navigation bar, click ksqlDB.
From the list of ksqlDB applications, select
wikipedia.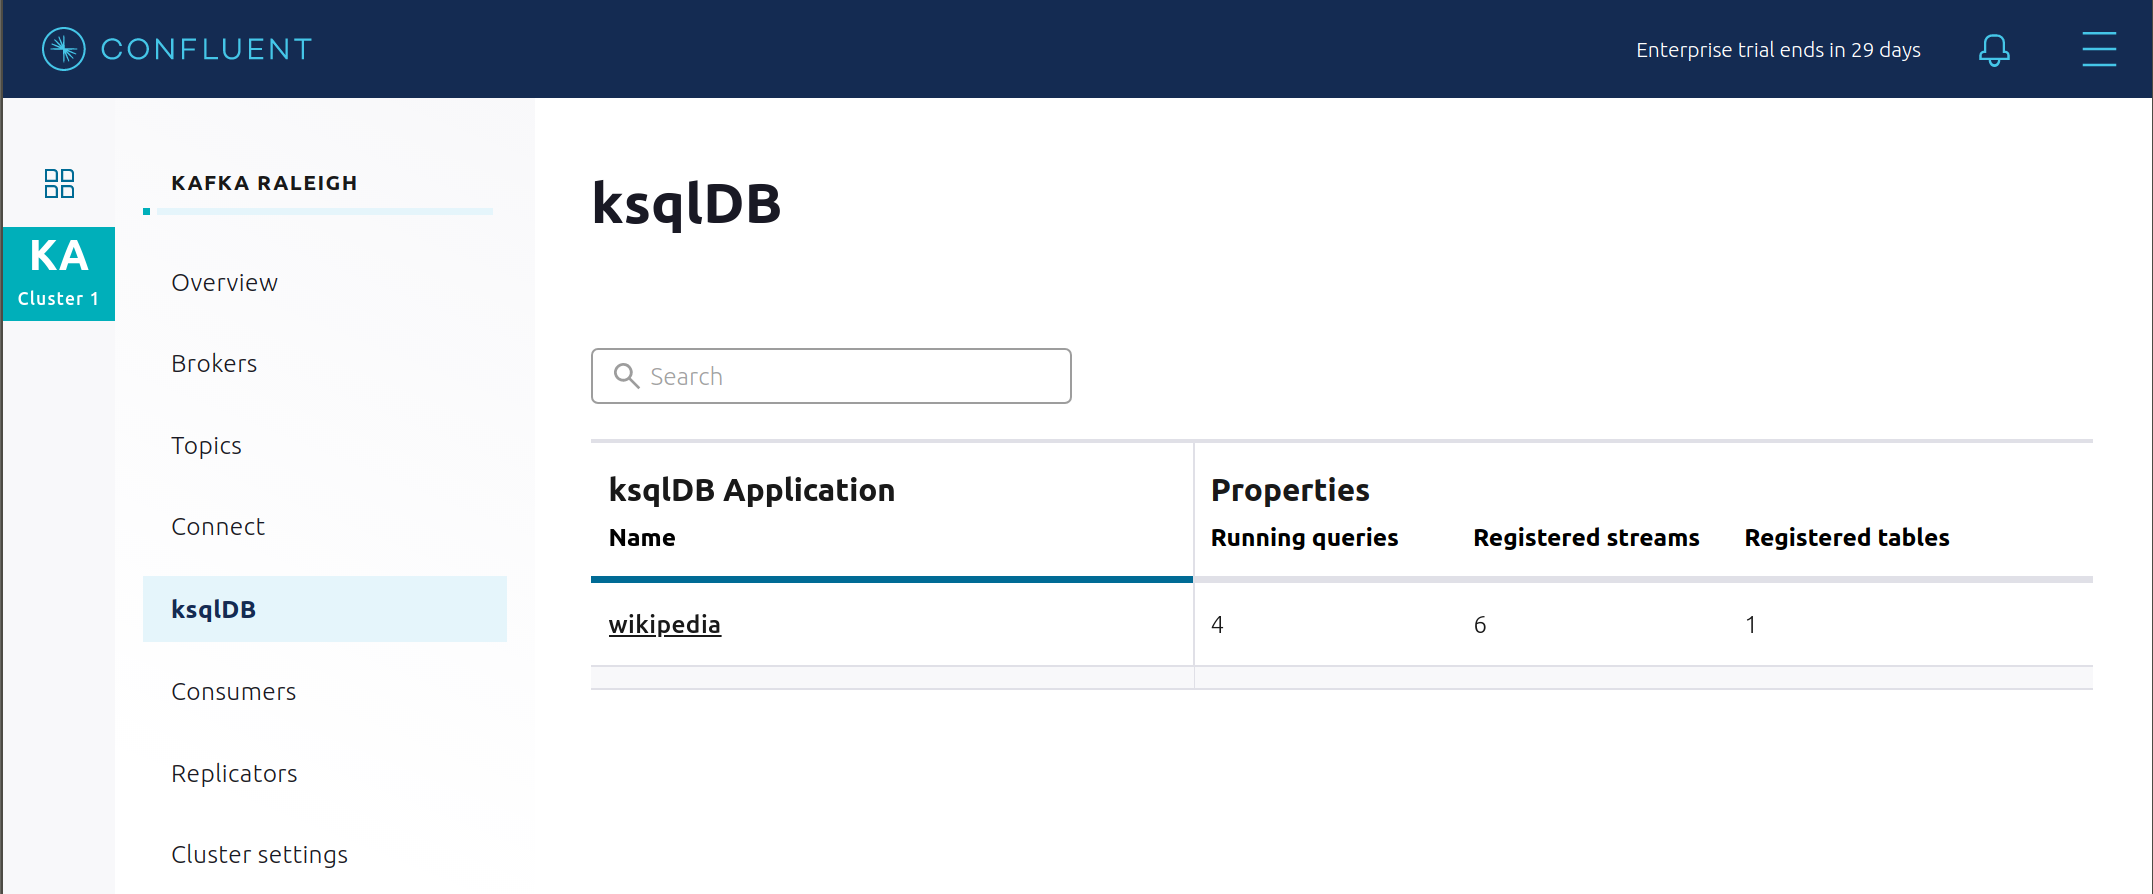
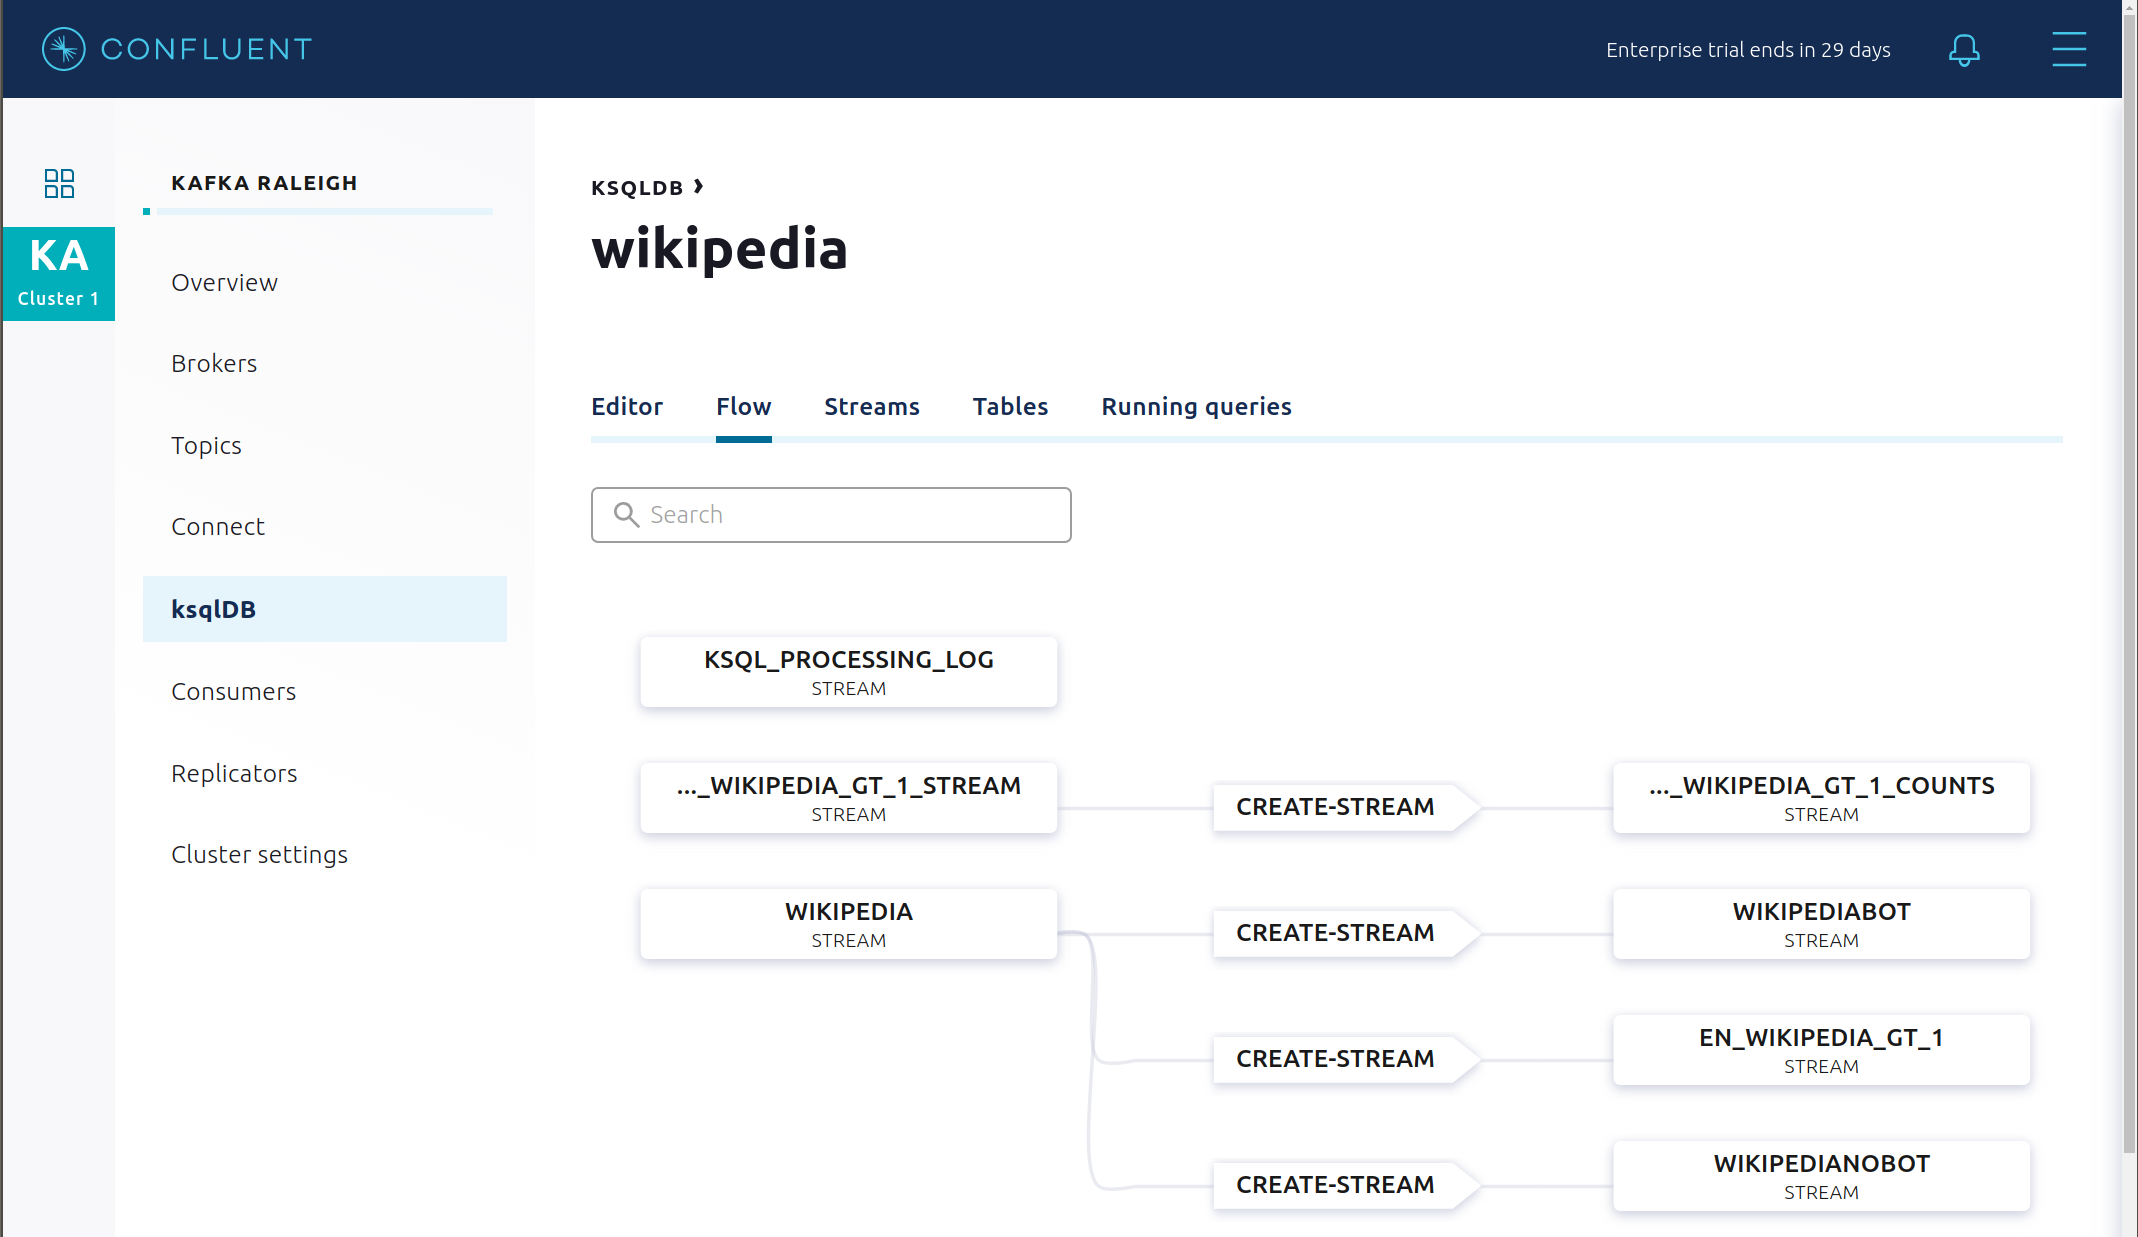
View the ksqlDB Flow to see the streams and tables created in the example, and how they relate to one another.
Use Confluent Control Center to interact with ksqlDB, or run ksqlDB CLI to get to the ksqlDB CLI prompt.
docker-compose exec ksqldb-cli bash -c 'ksql -u ksqlDBUser -p ksqlDBUser http://ksqldb-server:8088'
View the existing ksqlDB streams. (If you are using the ksqlDB CLI, at the
ksql>prompt typeSHOW STREAMS;)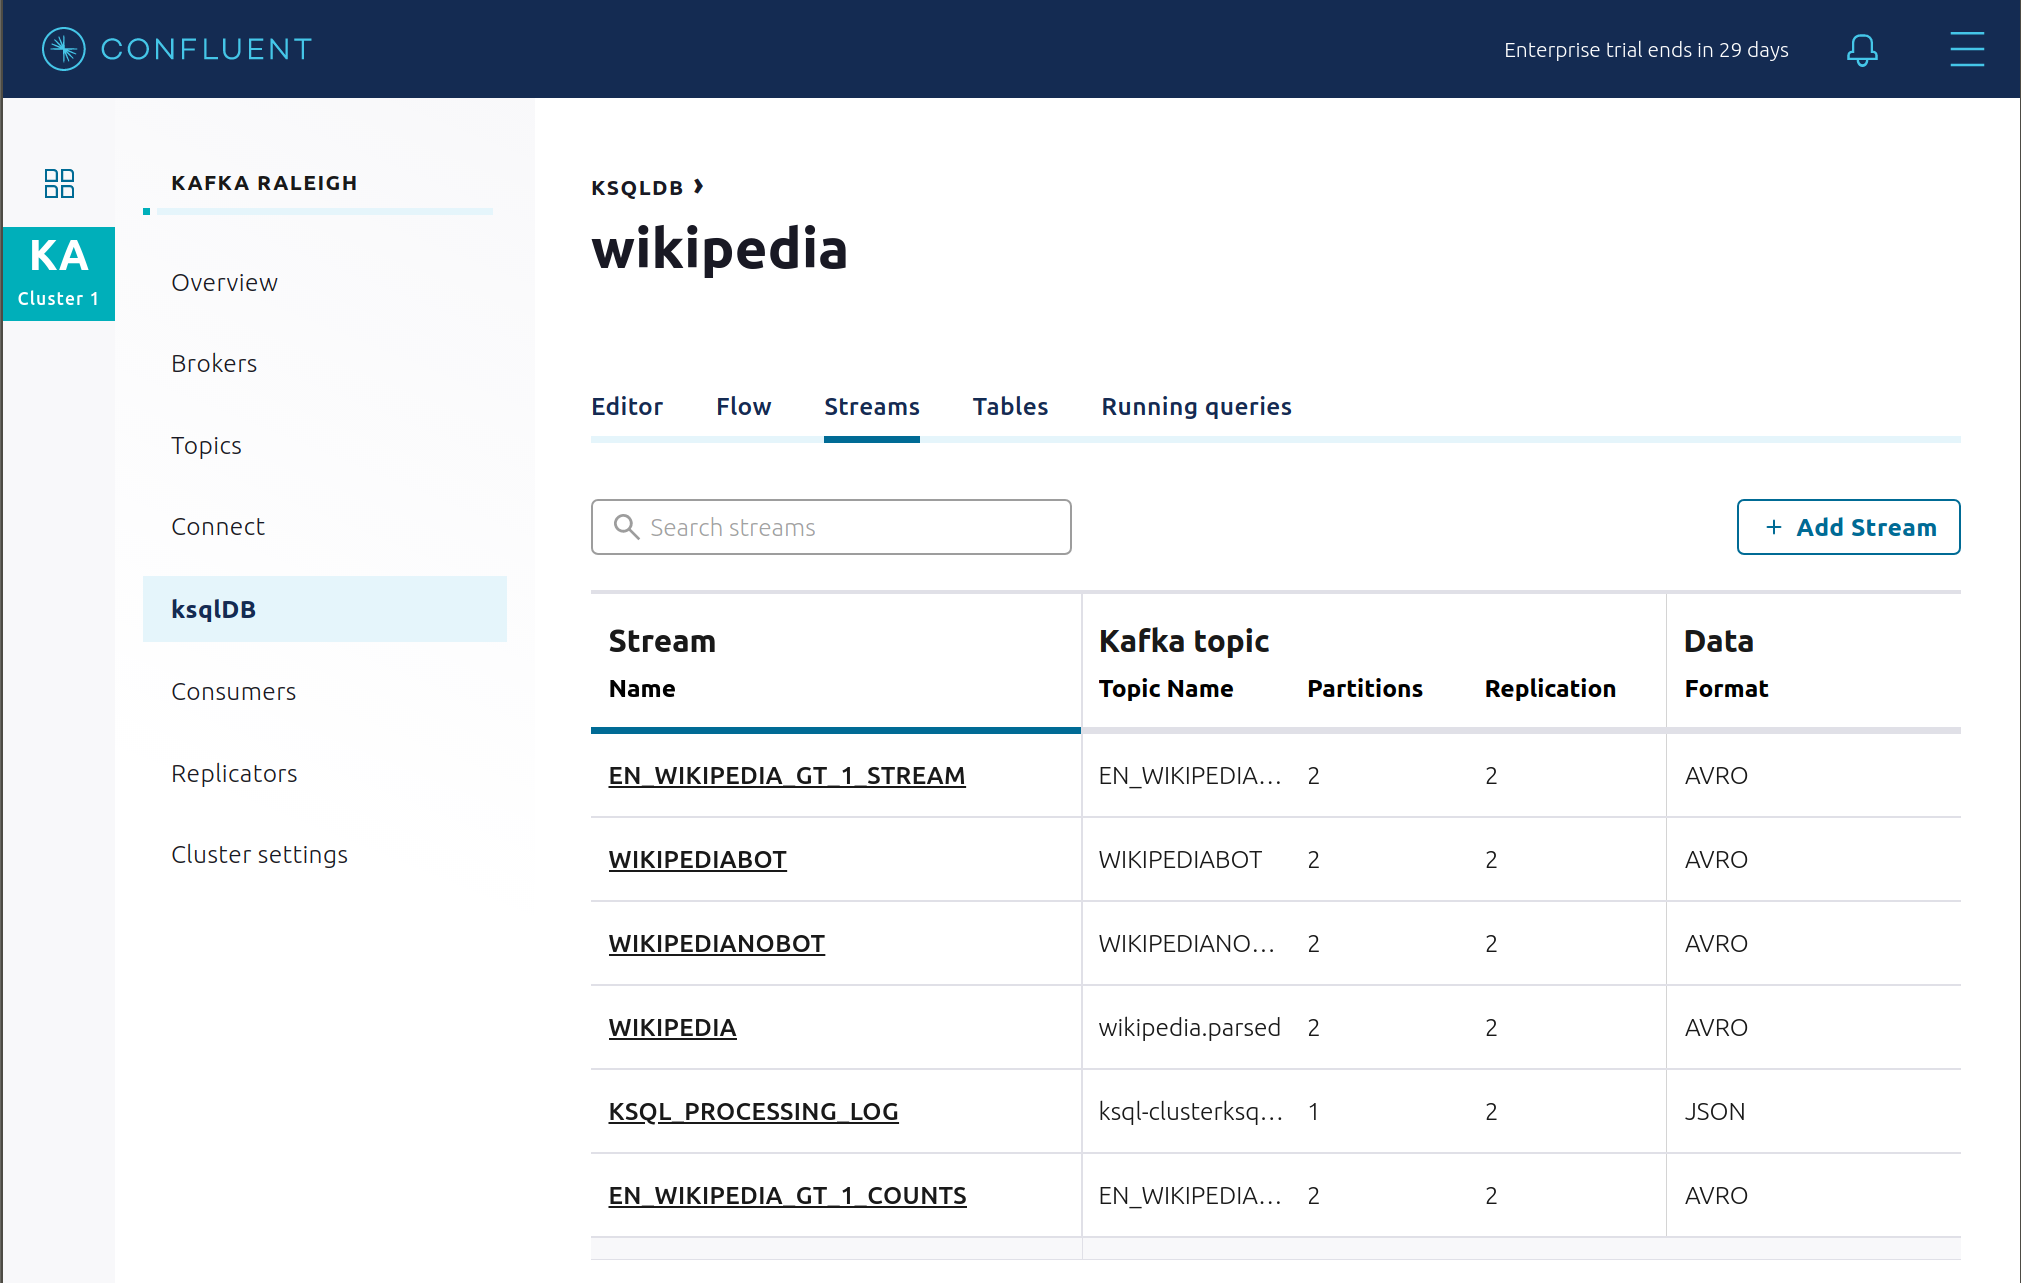
Click on
WIKIPEDIAto describe the schema (fields or columns) of an existing ksqlDB stream. (If you are using the ksqlDB CLI, at theksql>prompt typeDESCRIBE WIKIPEDIA;)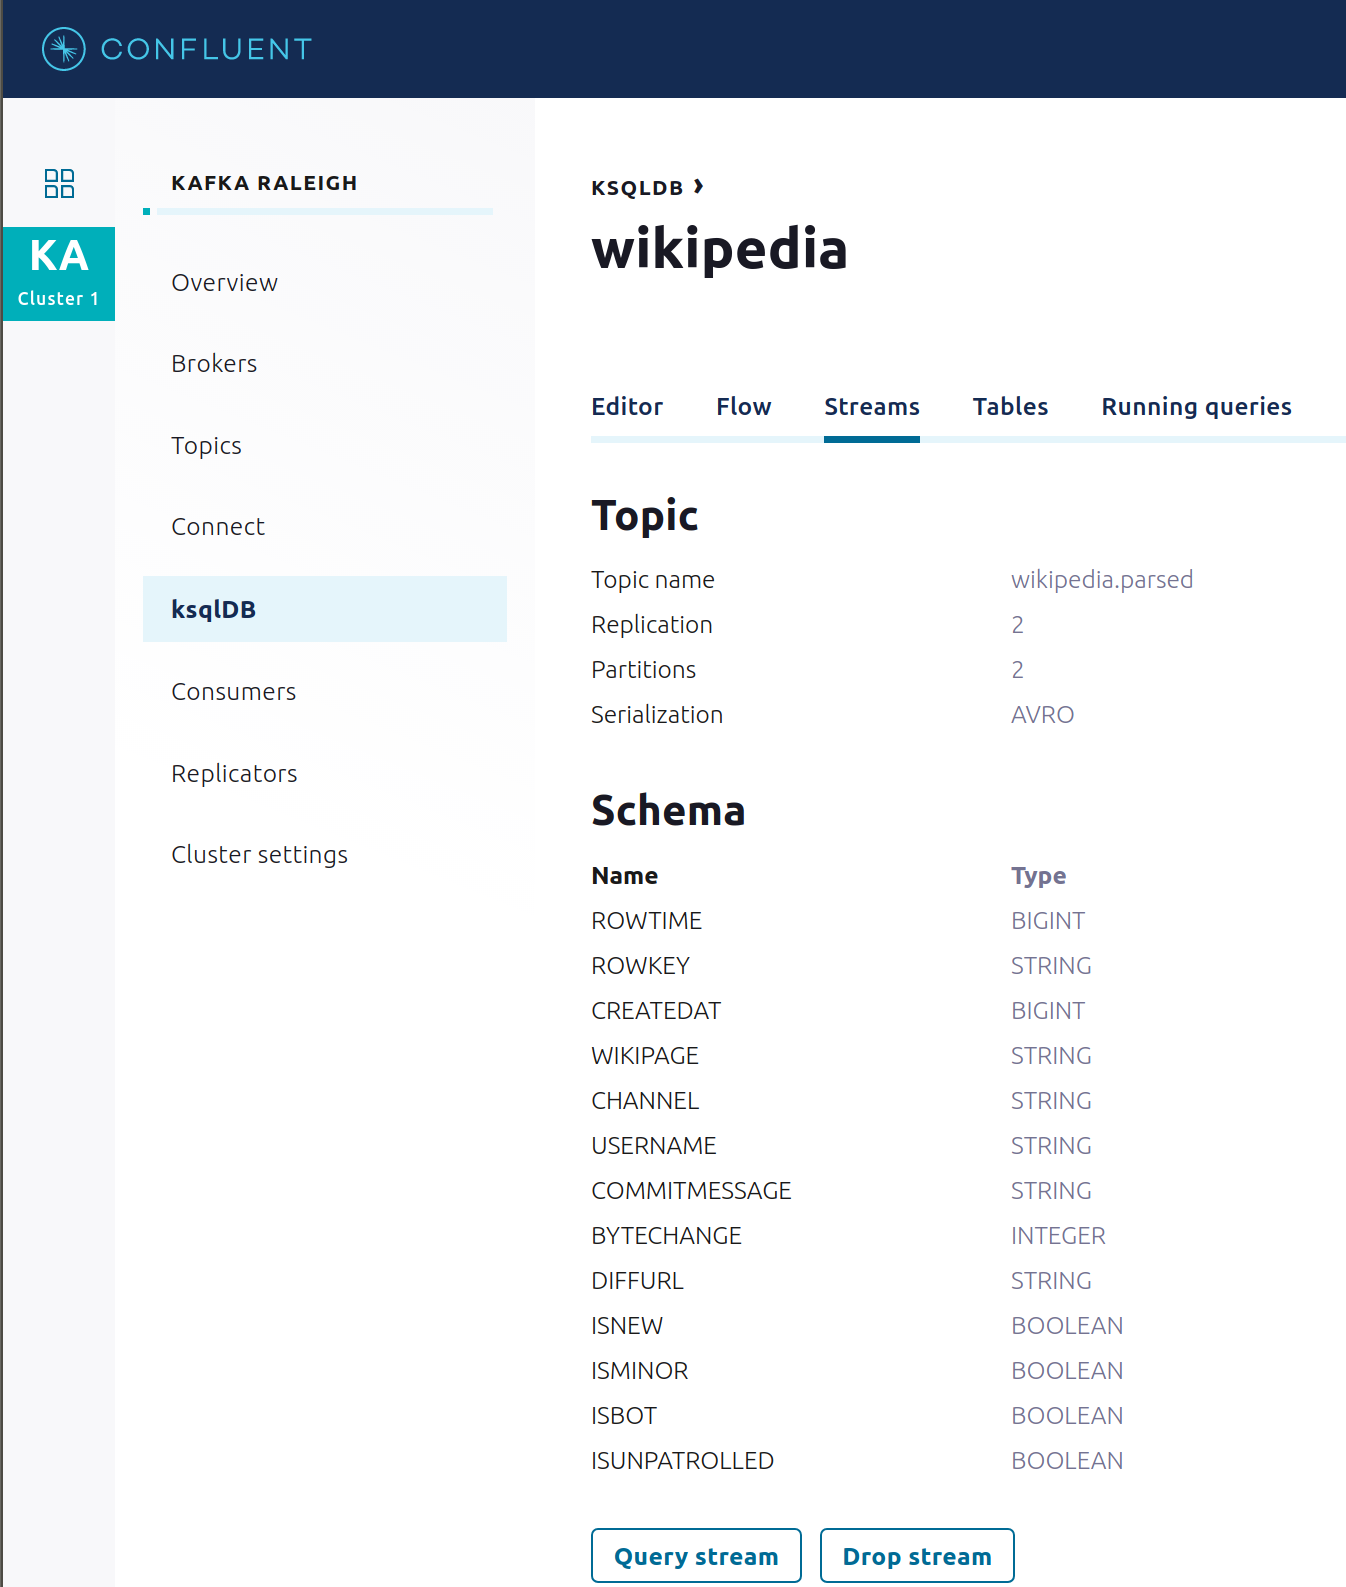
View the existing ksqlDB tables. (If you are using the ksqlDB CLI, at the
ksql>prompt typeSHOW TABLES;).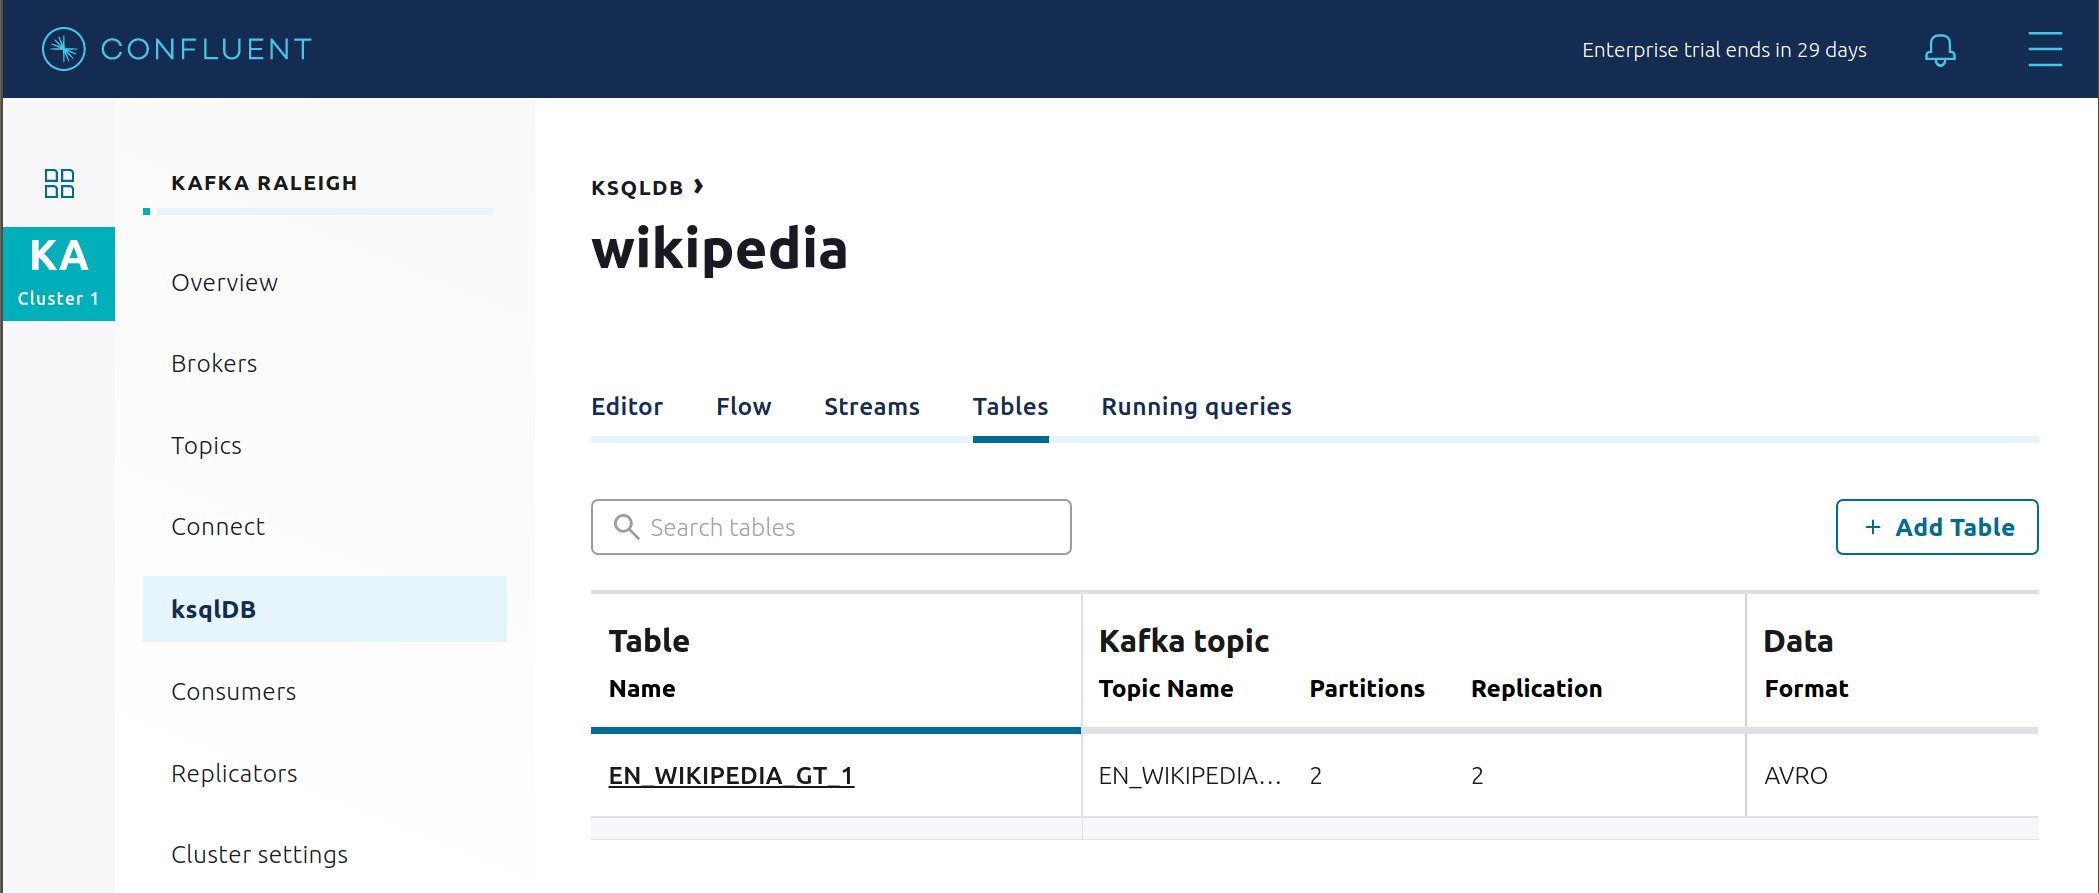
View the existing ksqlDB queries, which are continuously running. (If you are using the ksqlDB CLI, at the
ksql>prompt typeSHOW QUERIES;).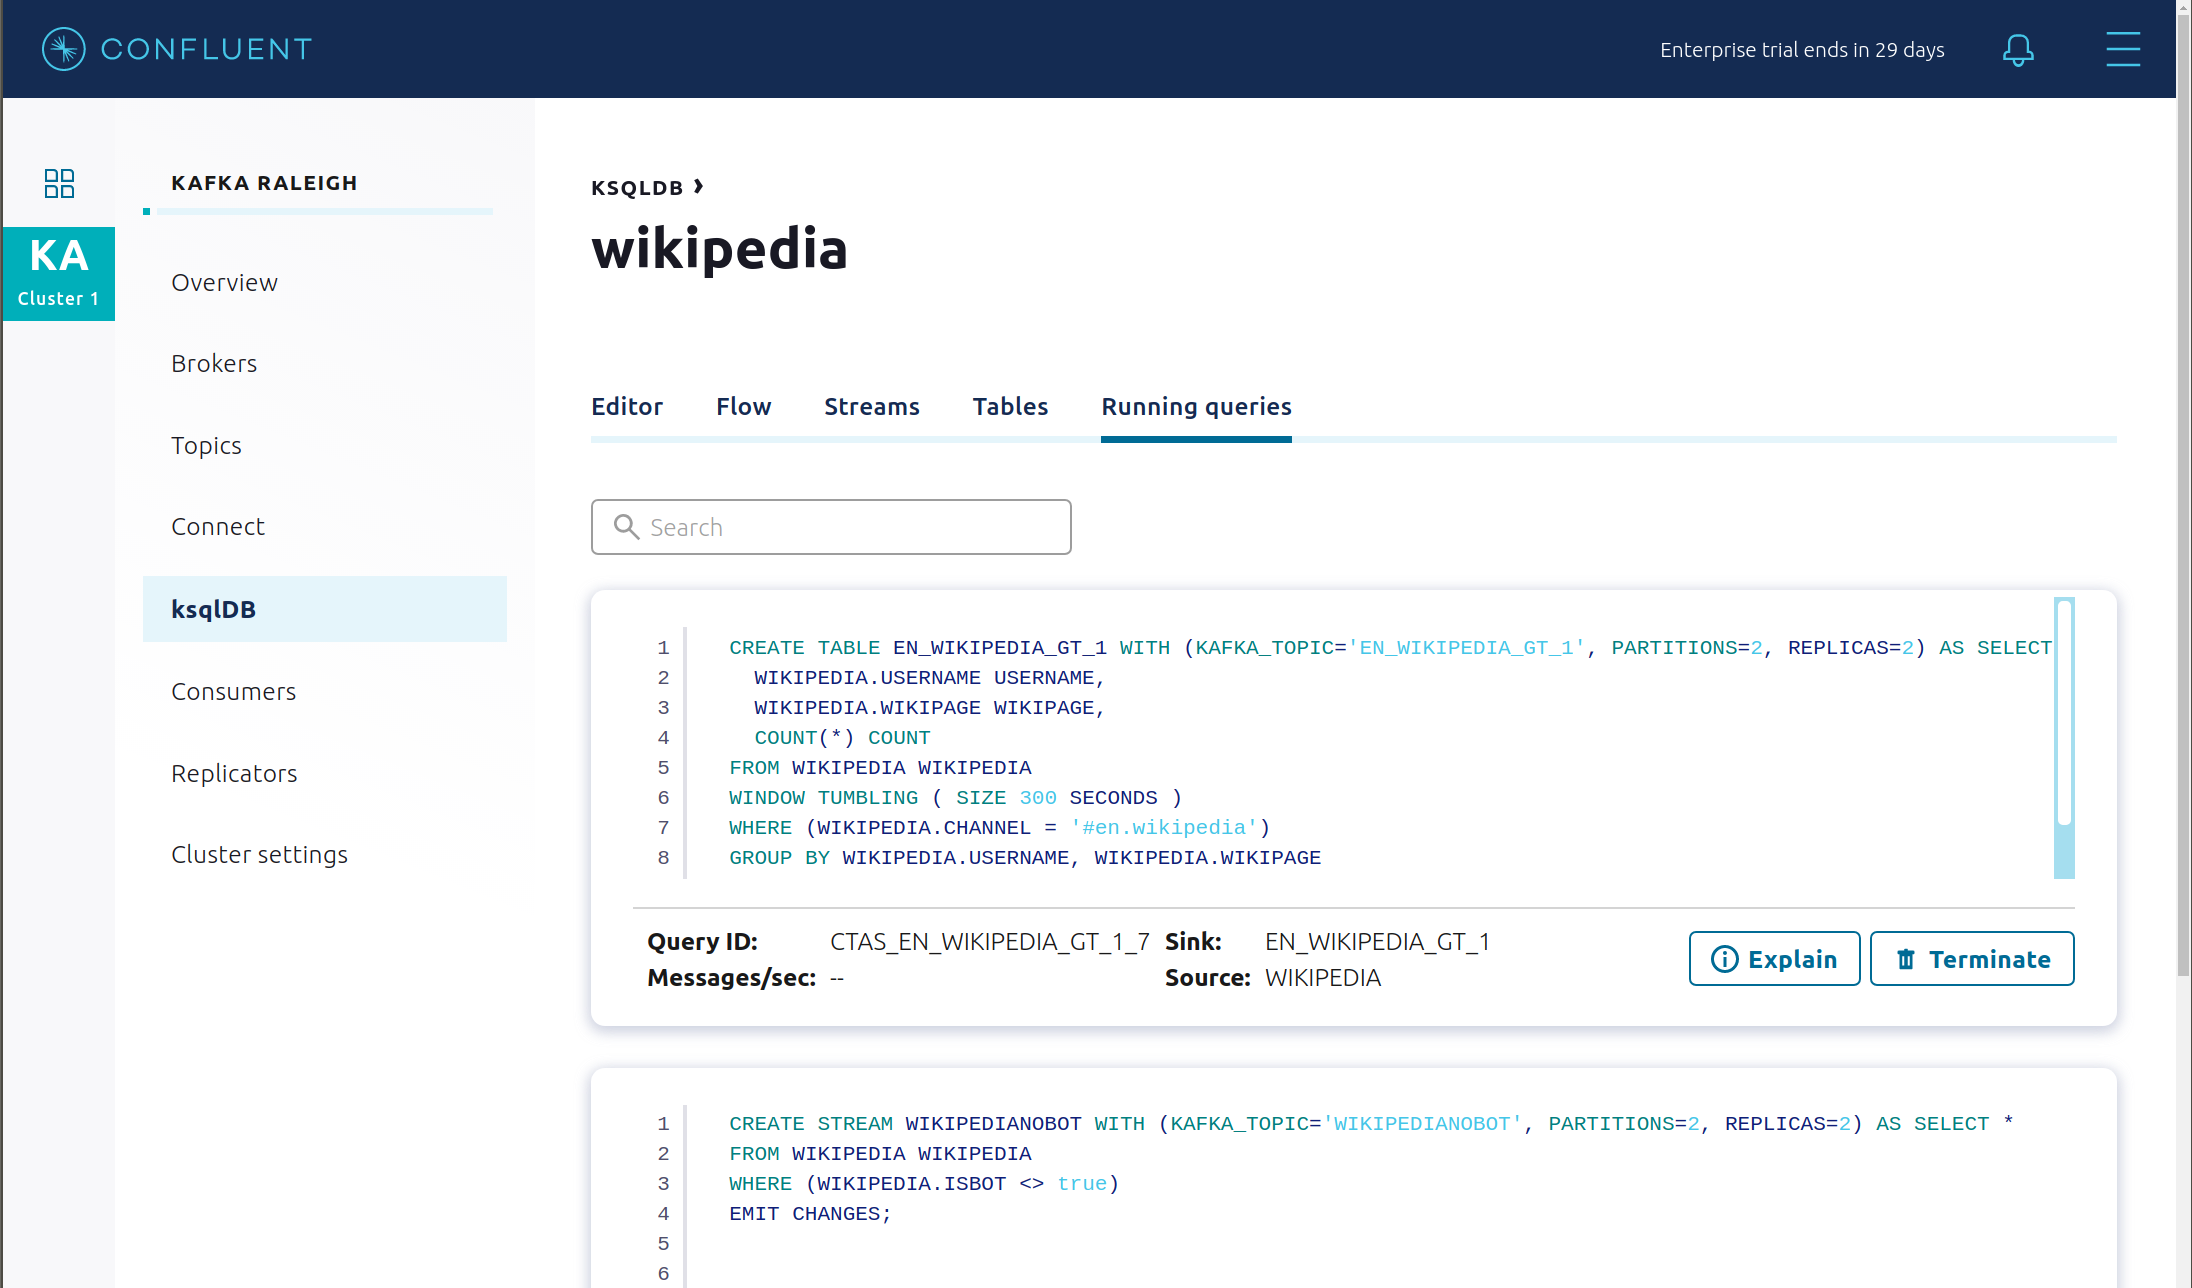
View messages from different ksqlDB streams and tables. Click on your stream of choice and then click Query stream to open the Query Editor. The editor shows a pre-populated query, like
select * from WIKIPEDIA EMIT CHANGES;, and it shows results for newly arriving data.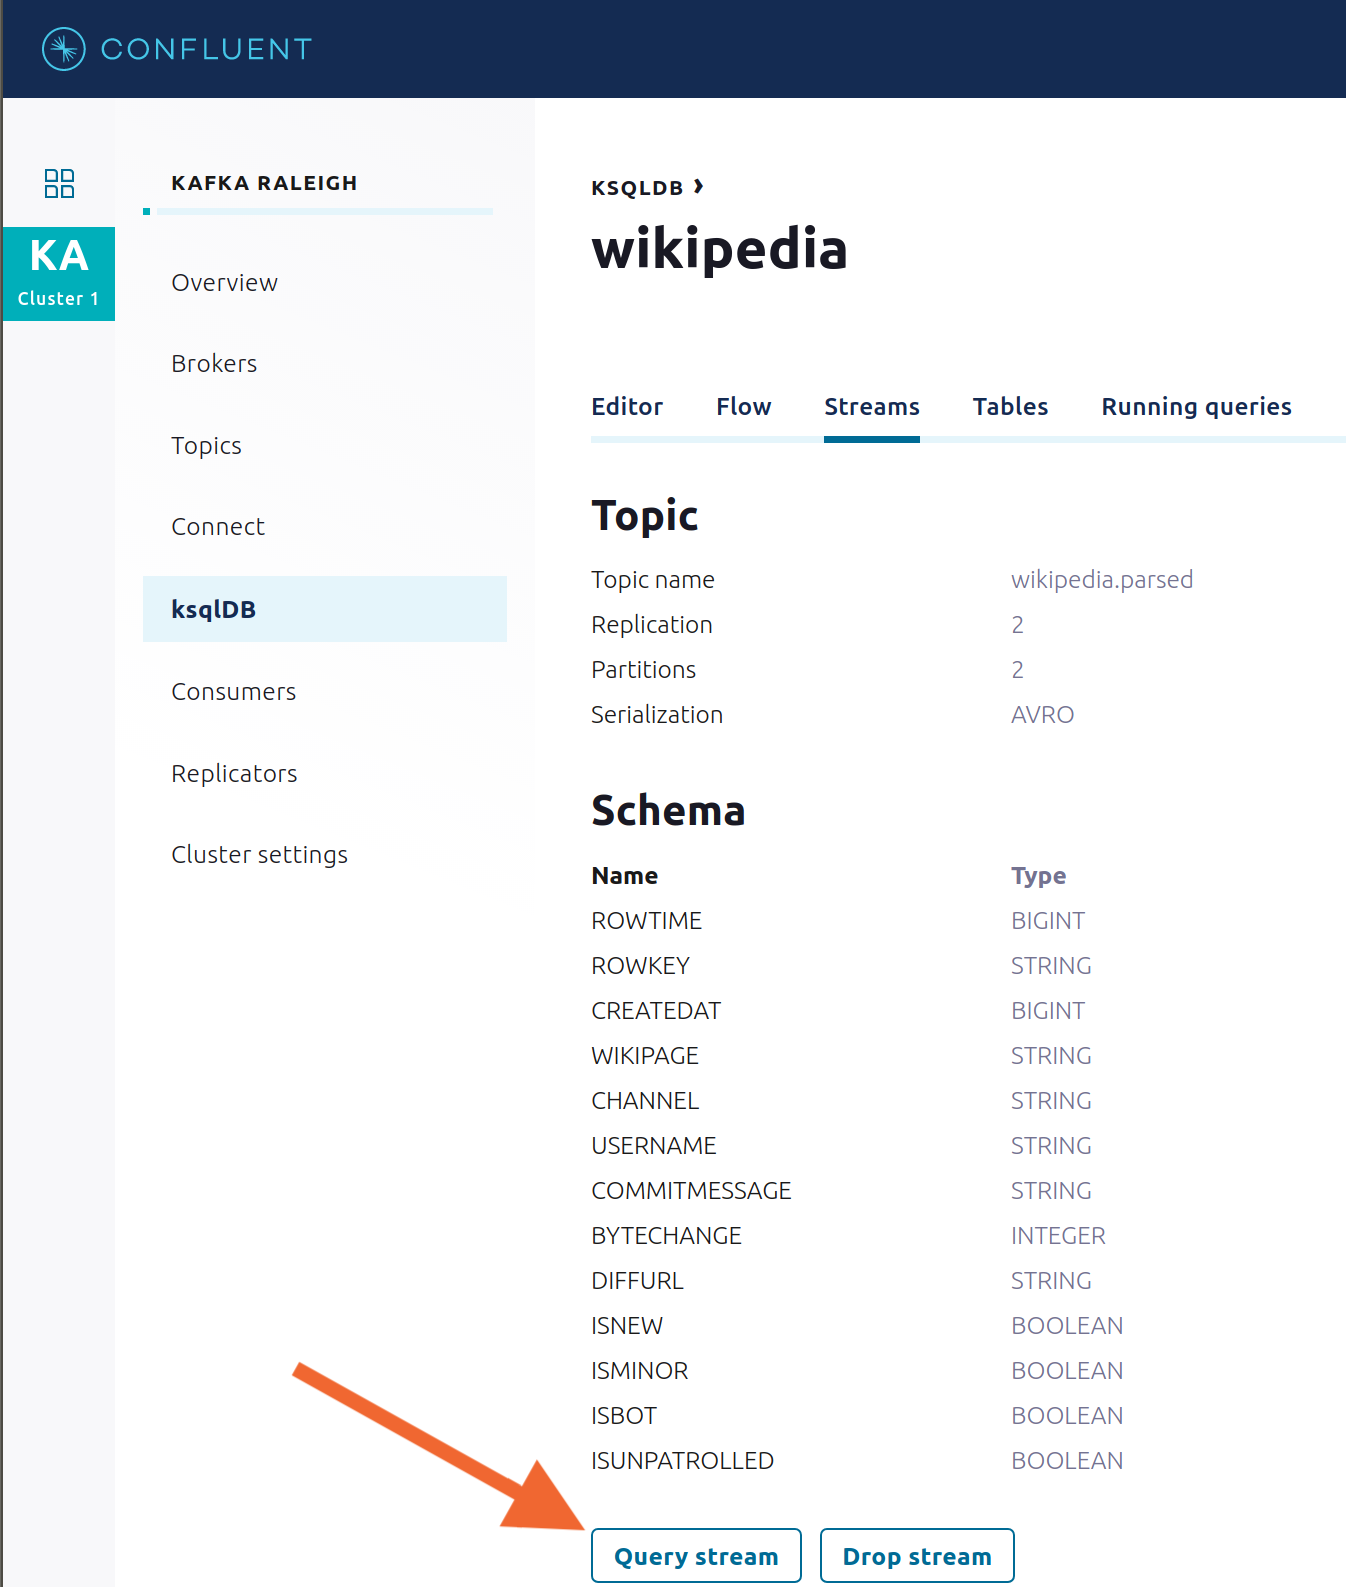
Click ksqlDB Editor and run the
SHOW PROPERTIES;statement. You can see the configured ksqlDB server properties and check these values with the docker-compose.yml file.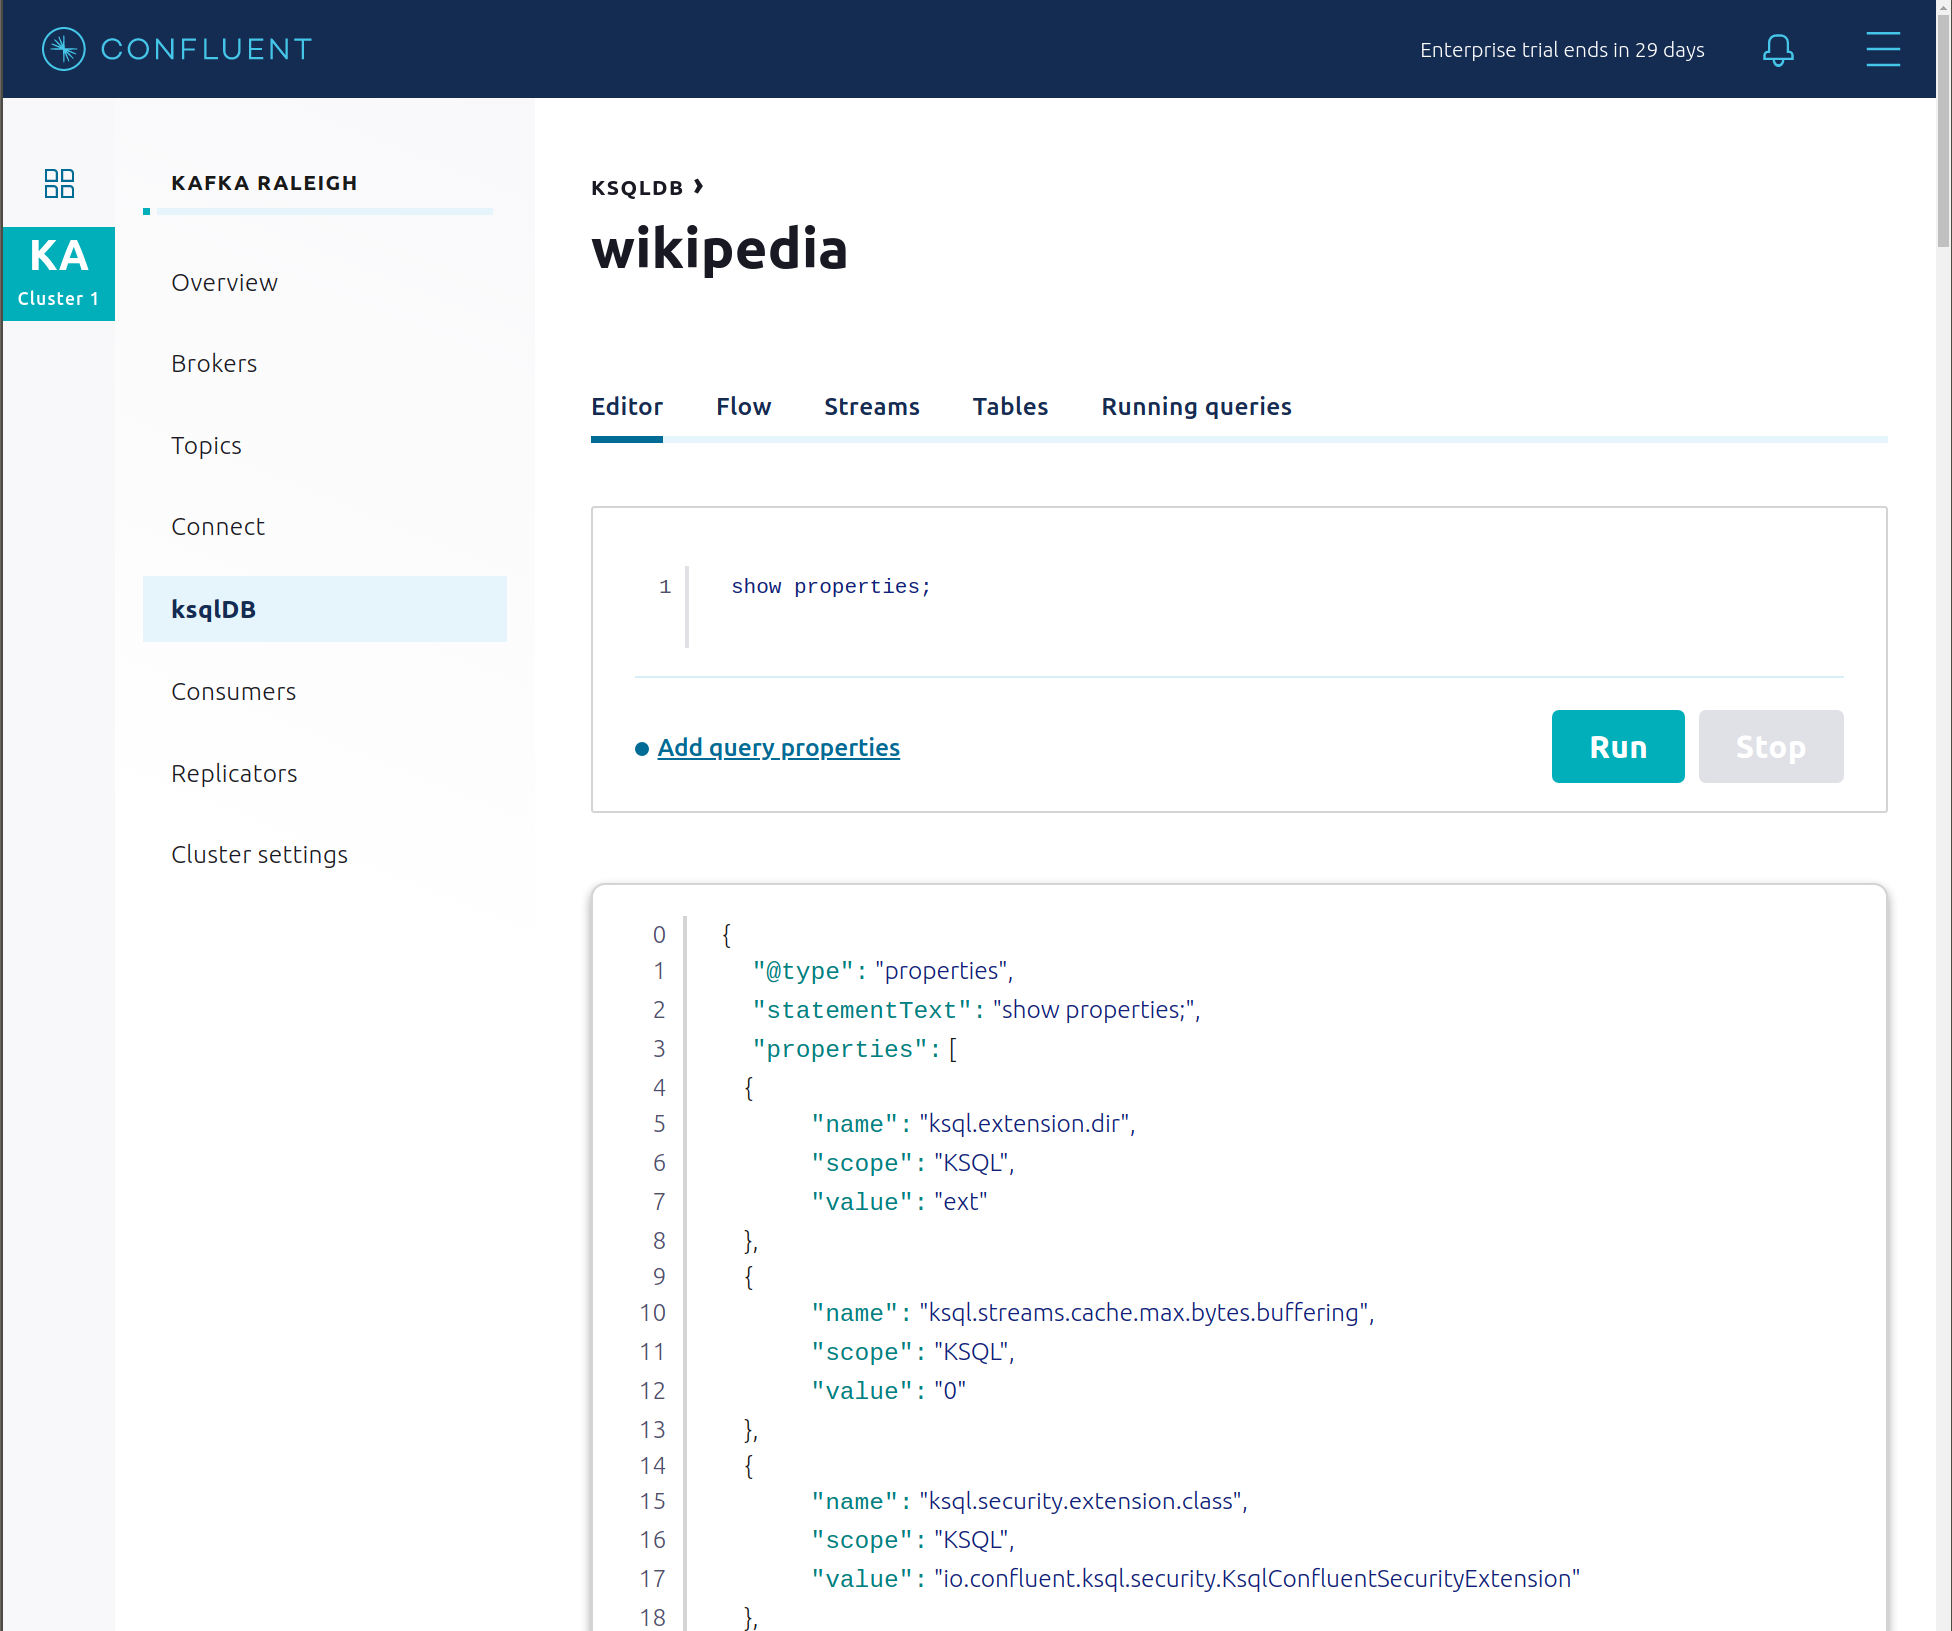
This example creates two streams
EN_WIKIPEDIA_GT_1andEN_WIKIPEDIA_GT_1_COUNTS, and the reason is to demonstrate how ksqlDB windows work.EN_WIKIPEDIA_GT_1counts occurences with a tumbling window, and for a given key it writes a null into the table on the first seen message. The underlying Kafka topic forEN_WIKIPEDIA_GT_1does not filter out those nulls, but since we want to send downstream just the counts greater than one, there is a separate Kafka topic for``EN_WIKIPEDIA_GT_1_COUNTSwhich does filter out those nulls (e.g., the query has a clausewhere ROWTIME is not null). From the bash prompt, view those underlying Kafka topics.
View messages in the topic
EN_WIKIPEDIA_GT_1(jump to offset 0/partition 0), and notice the nulls: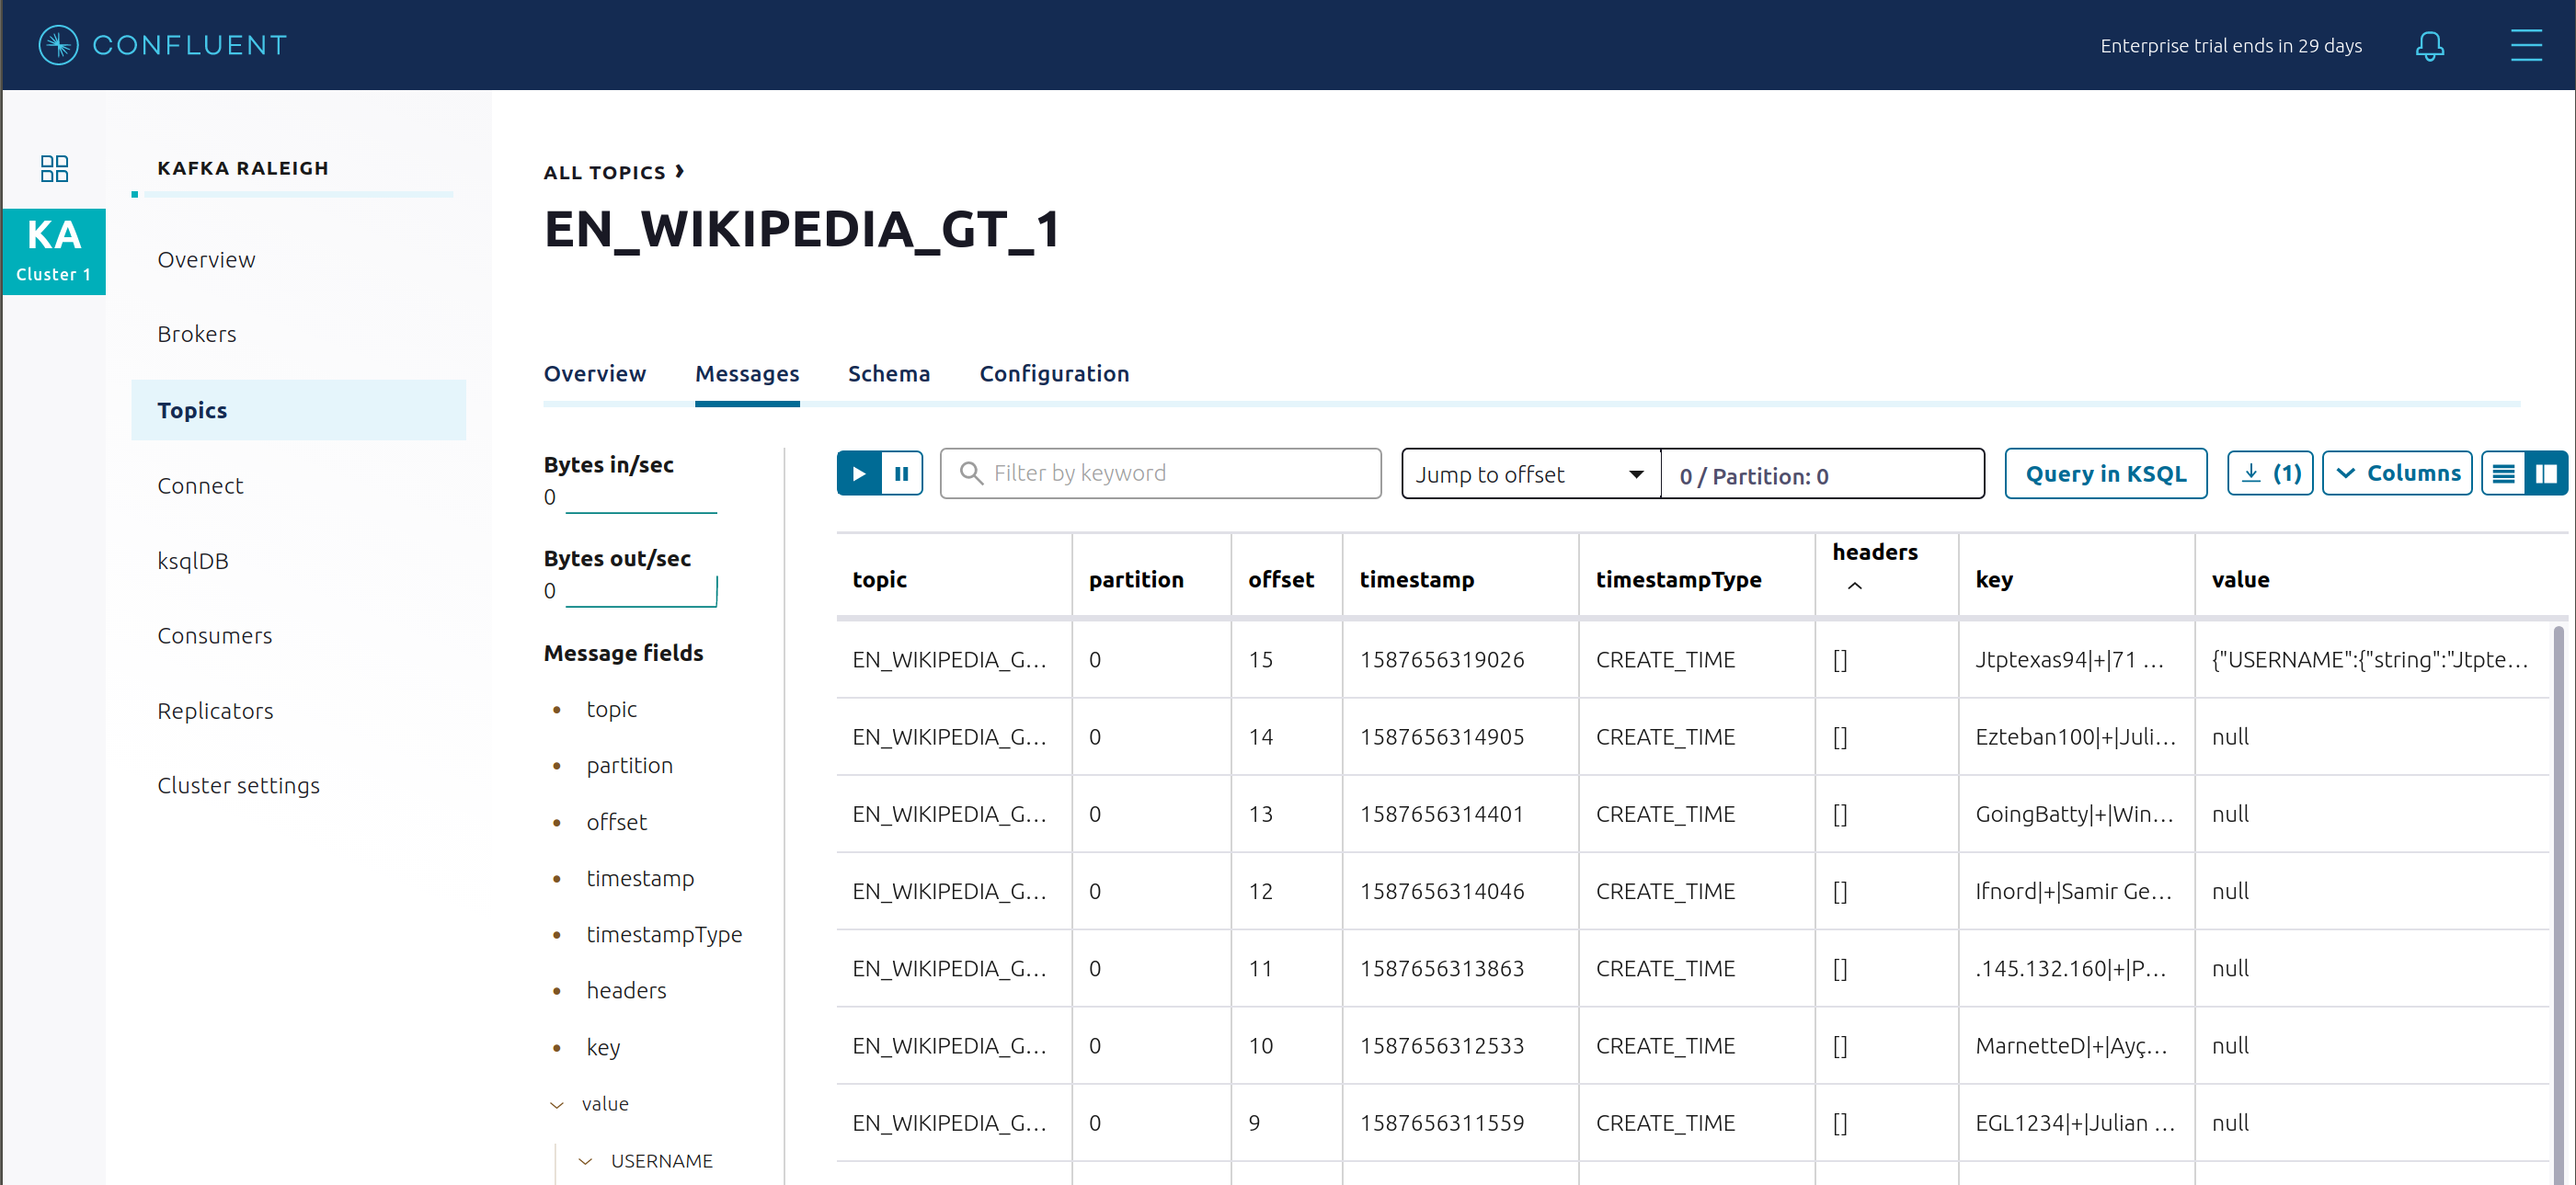
For comparison, view messages in the topic
EN_WIKIPEDIA_GT_1_COUNTS(jump to offset 0/partition 0), and notice no nulls: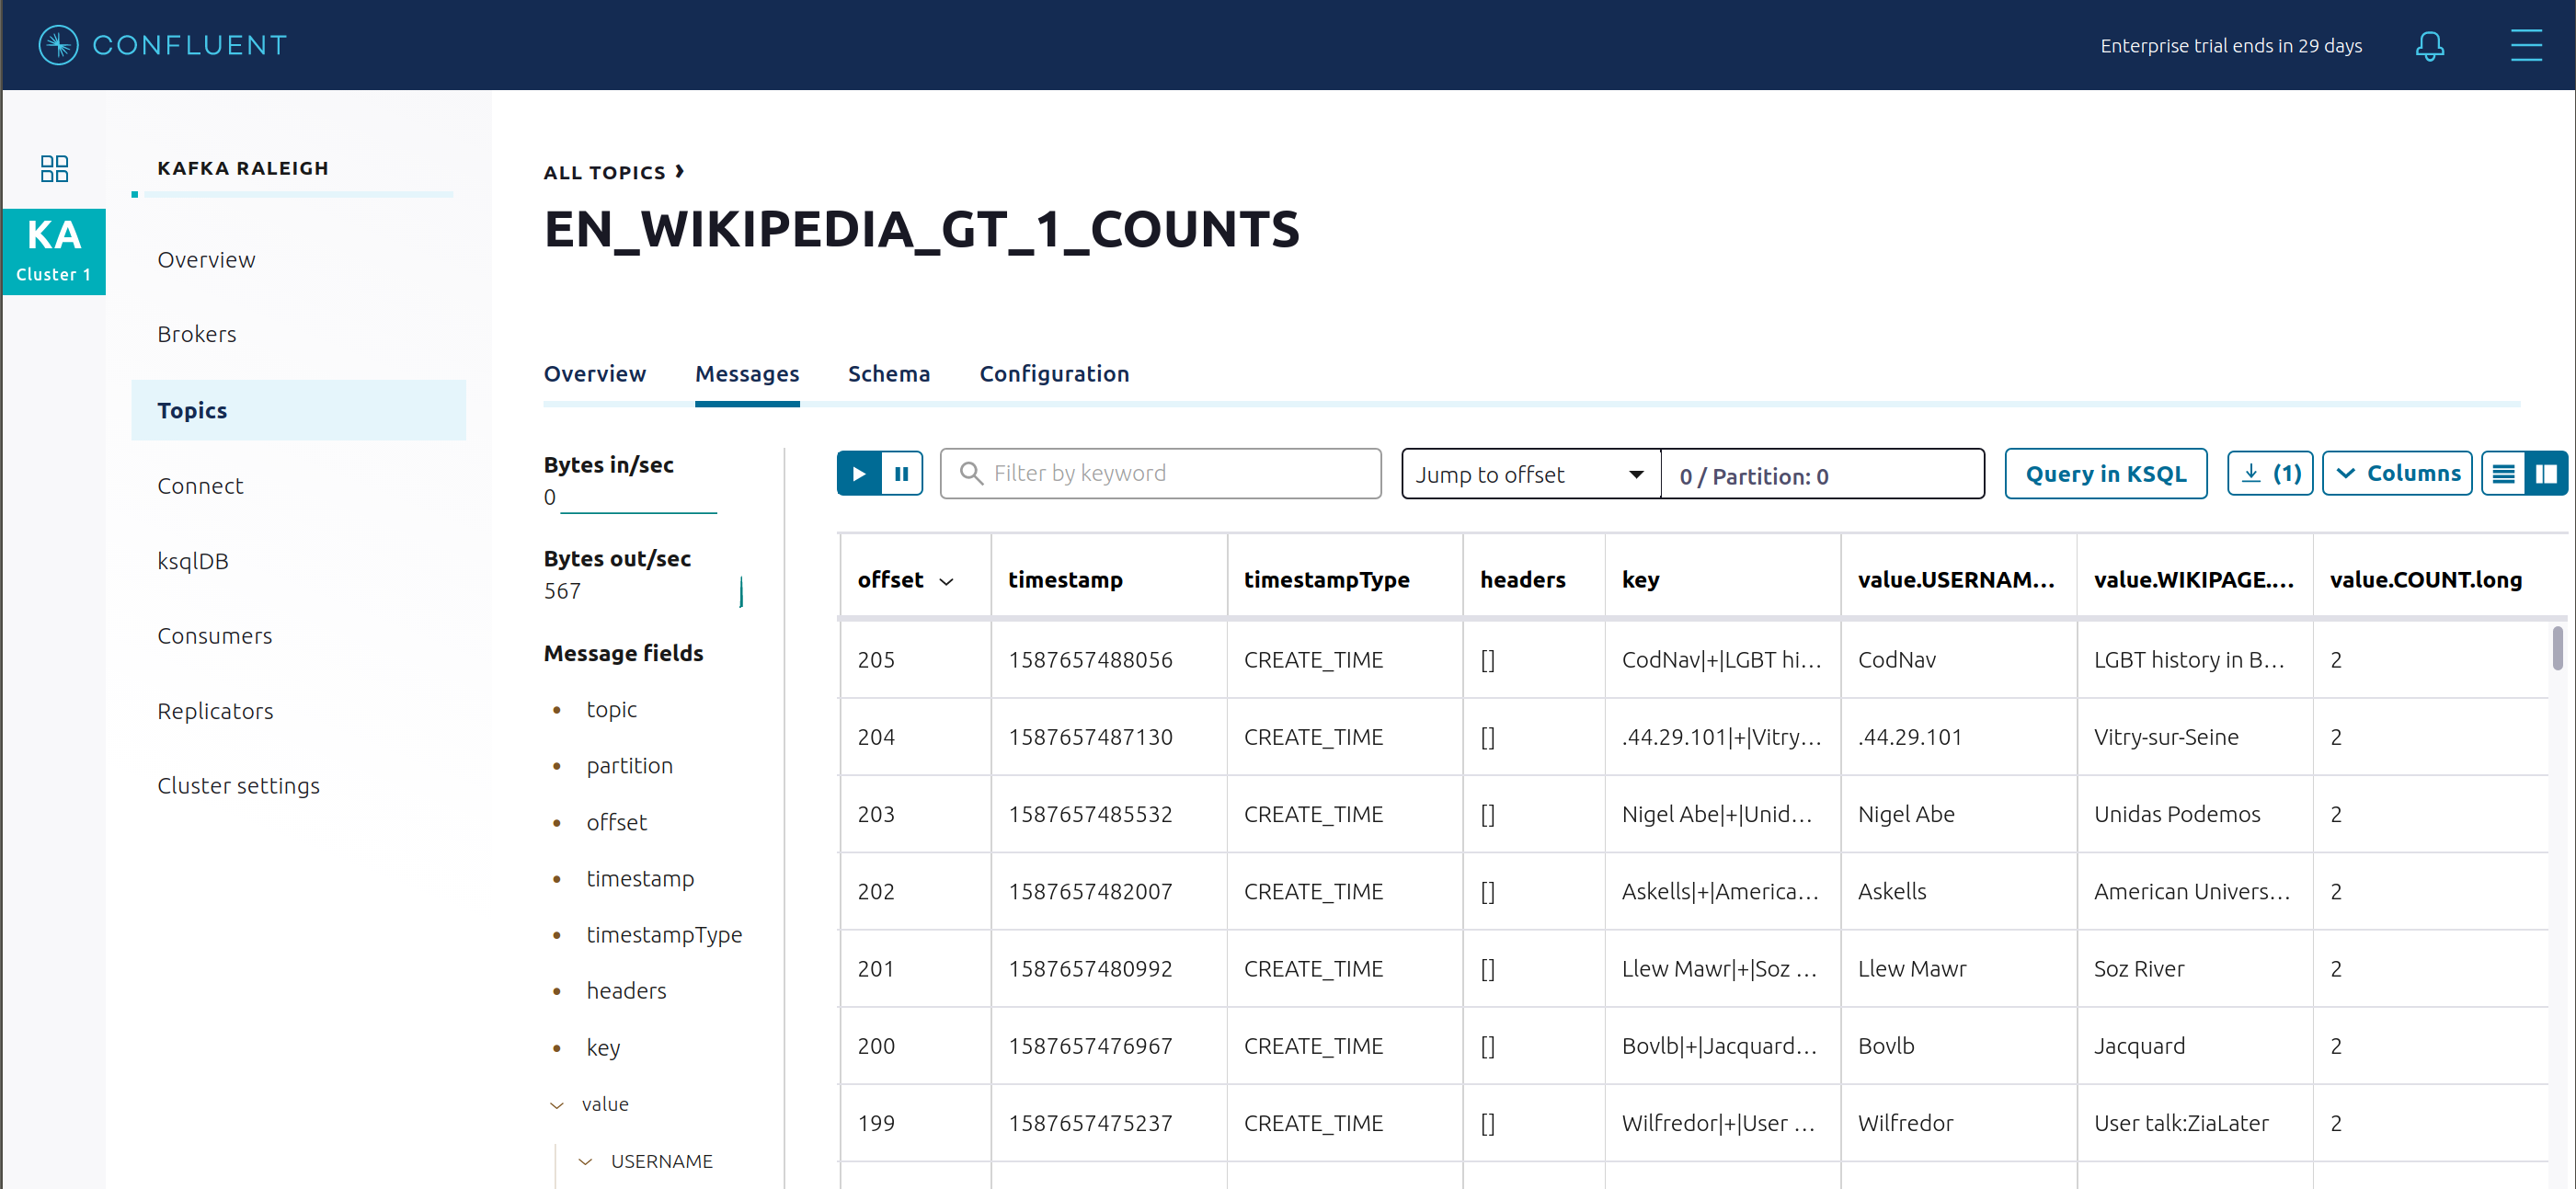
- The ksqlDB processing log captures per-record errors during processing to help developers debug their ksqlDB queries. In this example, the processing log uses mutual TLS (mTLS) authentication, as configured in the custom log4j properties file, to write entries into a Kafka topic. To see it in action, in the ksqlDB editor run the following “bad” query for 20 seconds:
SELECT ucase(cast(null as varchar)) FROM wikipedia EMIT CHANGES;
No records should be returned from this query. ksqlDB writes errors into the processing log for each record. View the processing log topic ksql-clusterksql_processing_log with topic inspection (jump to offset 0/partition 0) or the corresponding ksqlDB stream KSQL_PROCESSING_LOG with the ksqlDB editor (set auto.offset.reset=earliest).
SELECT * FROM KSQL_PROCESSING_LOG EMIT CHANGES;
Consumers
Confluent Control Center enables you to monitor consumer lag and throughput performance. Consumer lag is the topic’s high water mark (latest offset for the topic that has been written) minus the current consumer offset (latest offset read for that topic by that consumer group). Keep in mind the topic’s write rate and consumer group’s read rate when you consider the significance the consumer lag’s size. Click on “Consumers”.
Consumer lag is available on a per-consumer basis, including the embedded Connect consumers for sink connectors (e.g.,
connect-elasticsearch-ksqldb), ksqlDB queries (e.g., consumer groups whose names start with_confluent-ksql-default_query_), console consumers (e.g.,WIKIPEDIANOBOT-consumer), etc. Consumer lag is also available on a per-topic basis.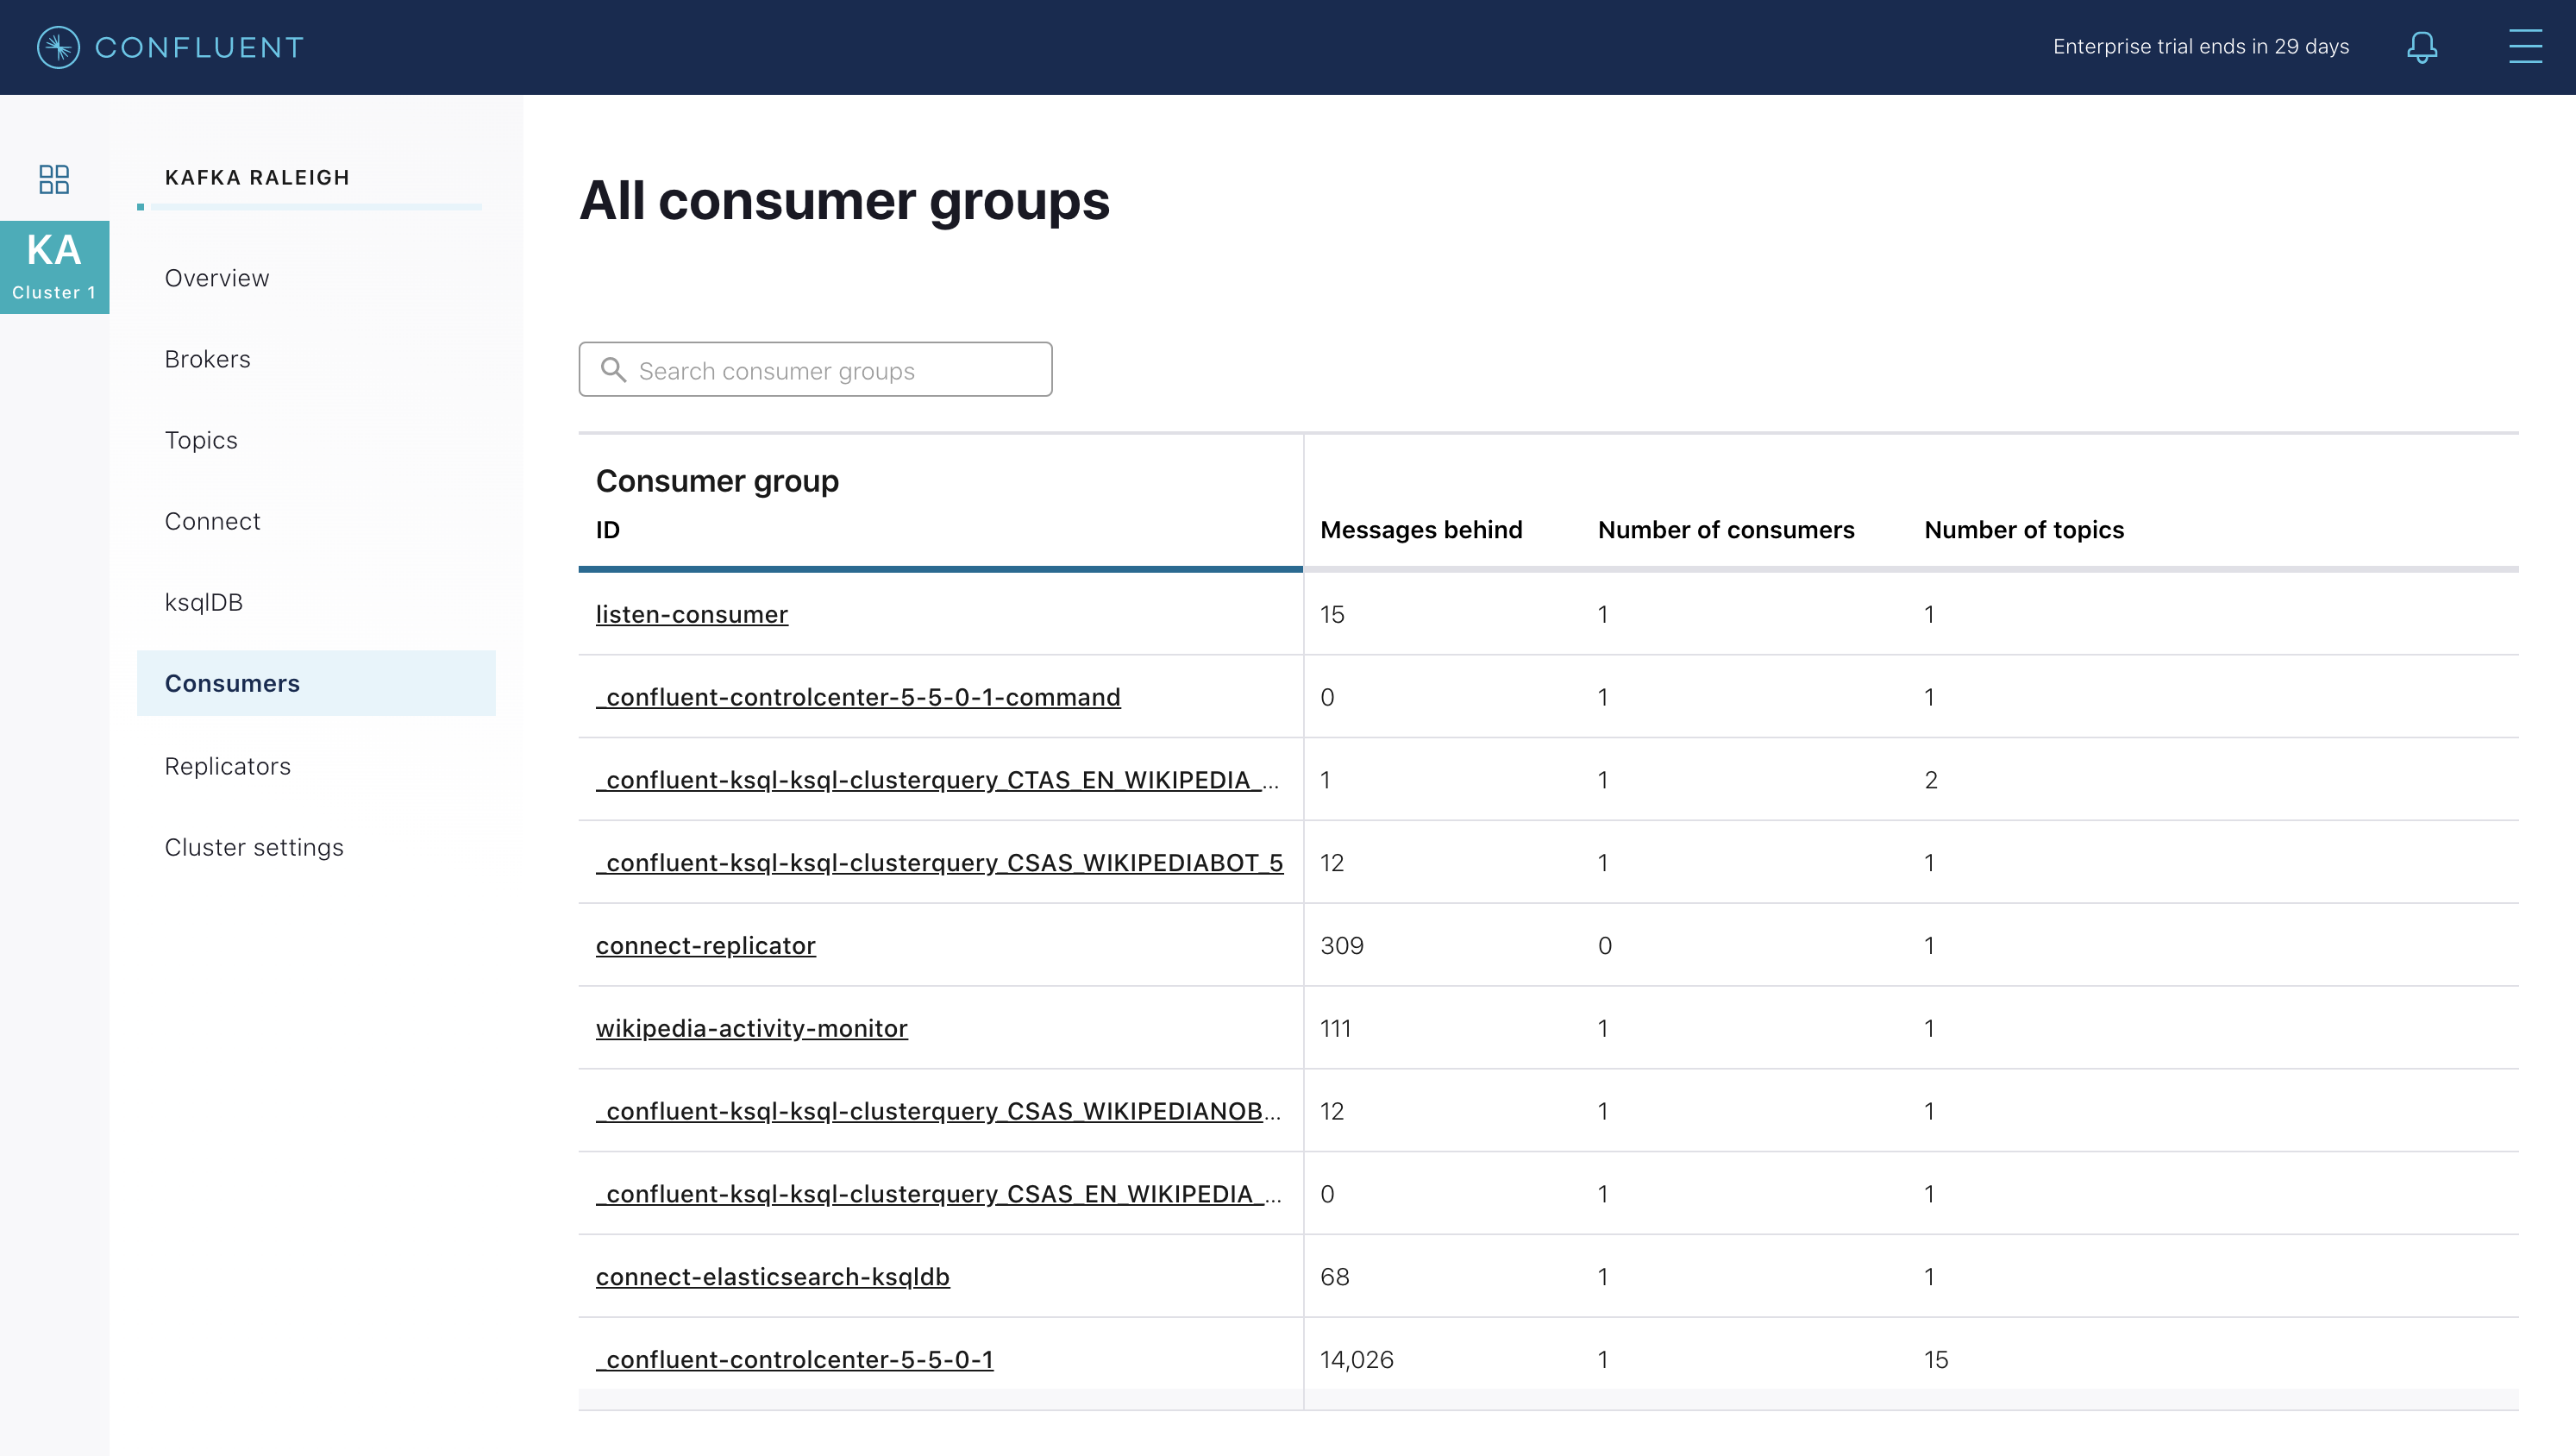
View consumer lag for the persistent ksqlDB “Create Stream As Select” query
CSAS_WIKIPEDIABOT, which is displayed as_confluent-ksql-ksql-clusterquery_CSAS_WIKIPEDIABOT_5in the consumer group list.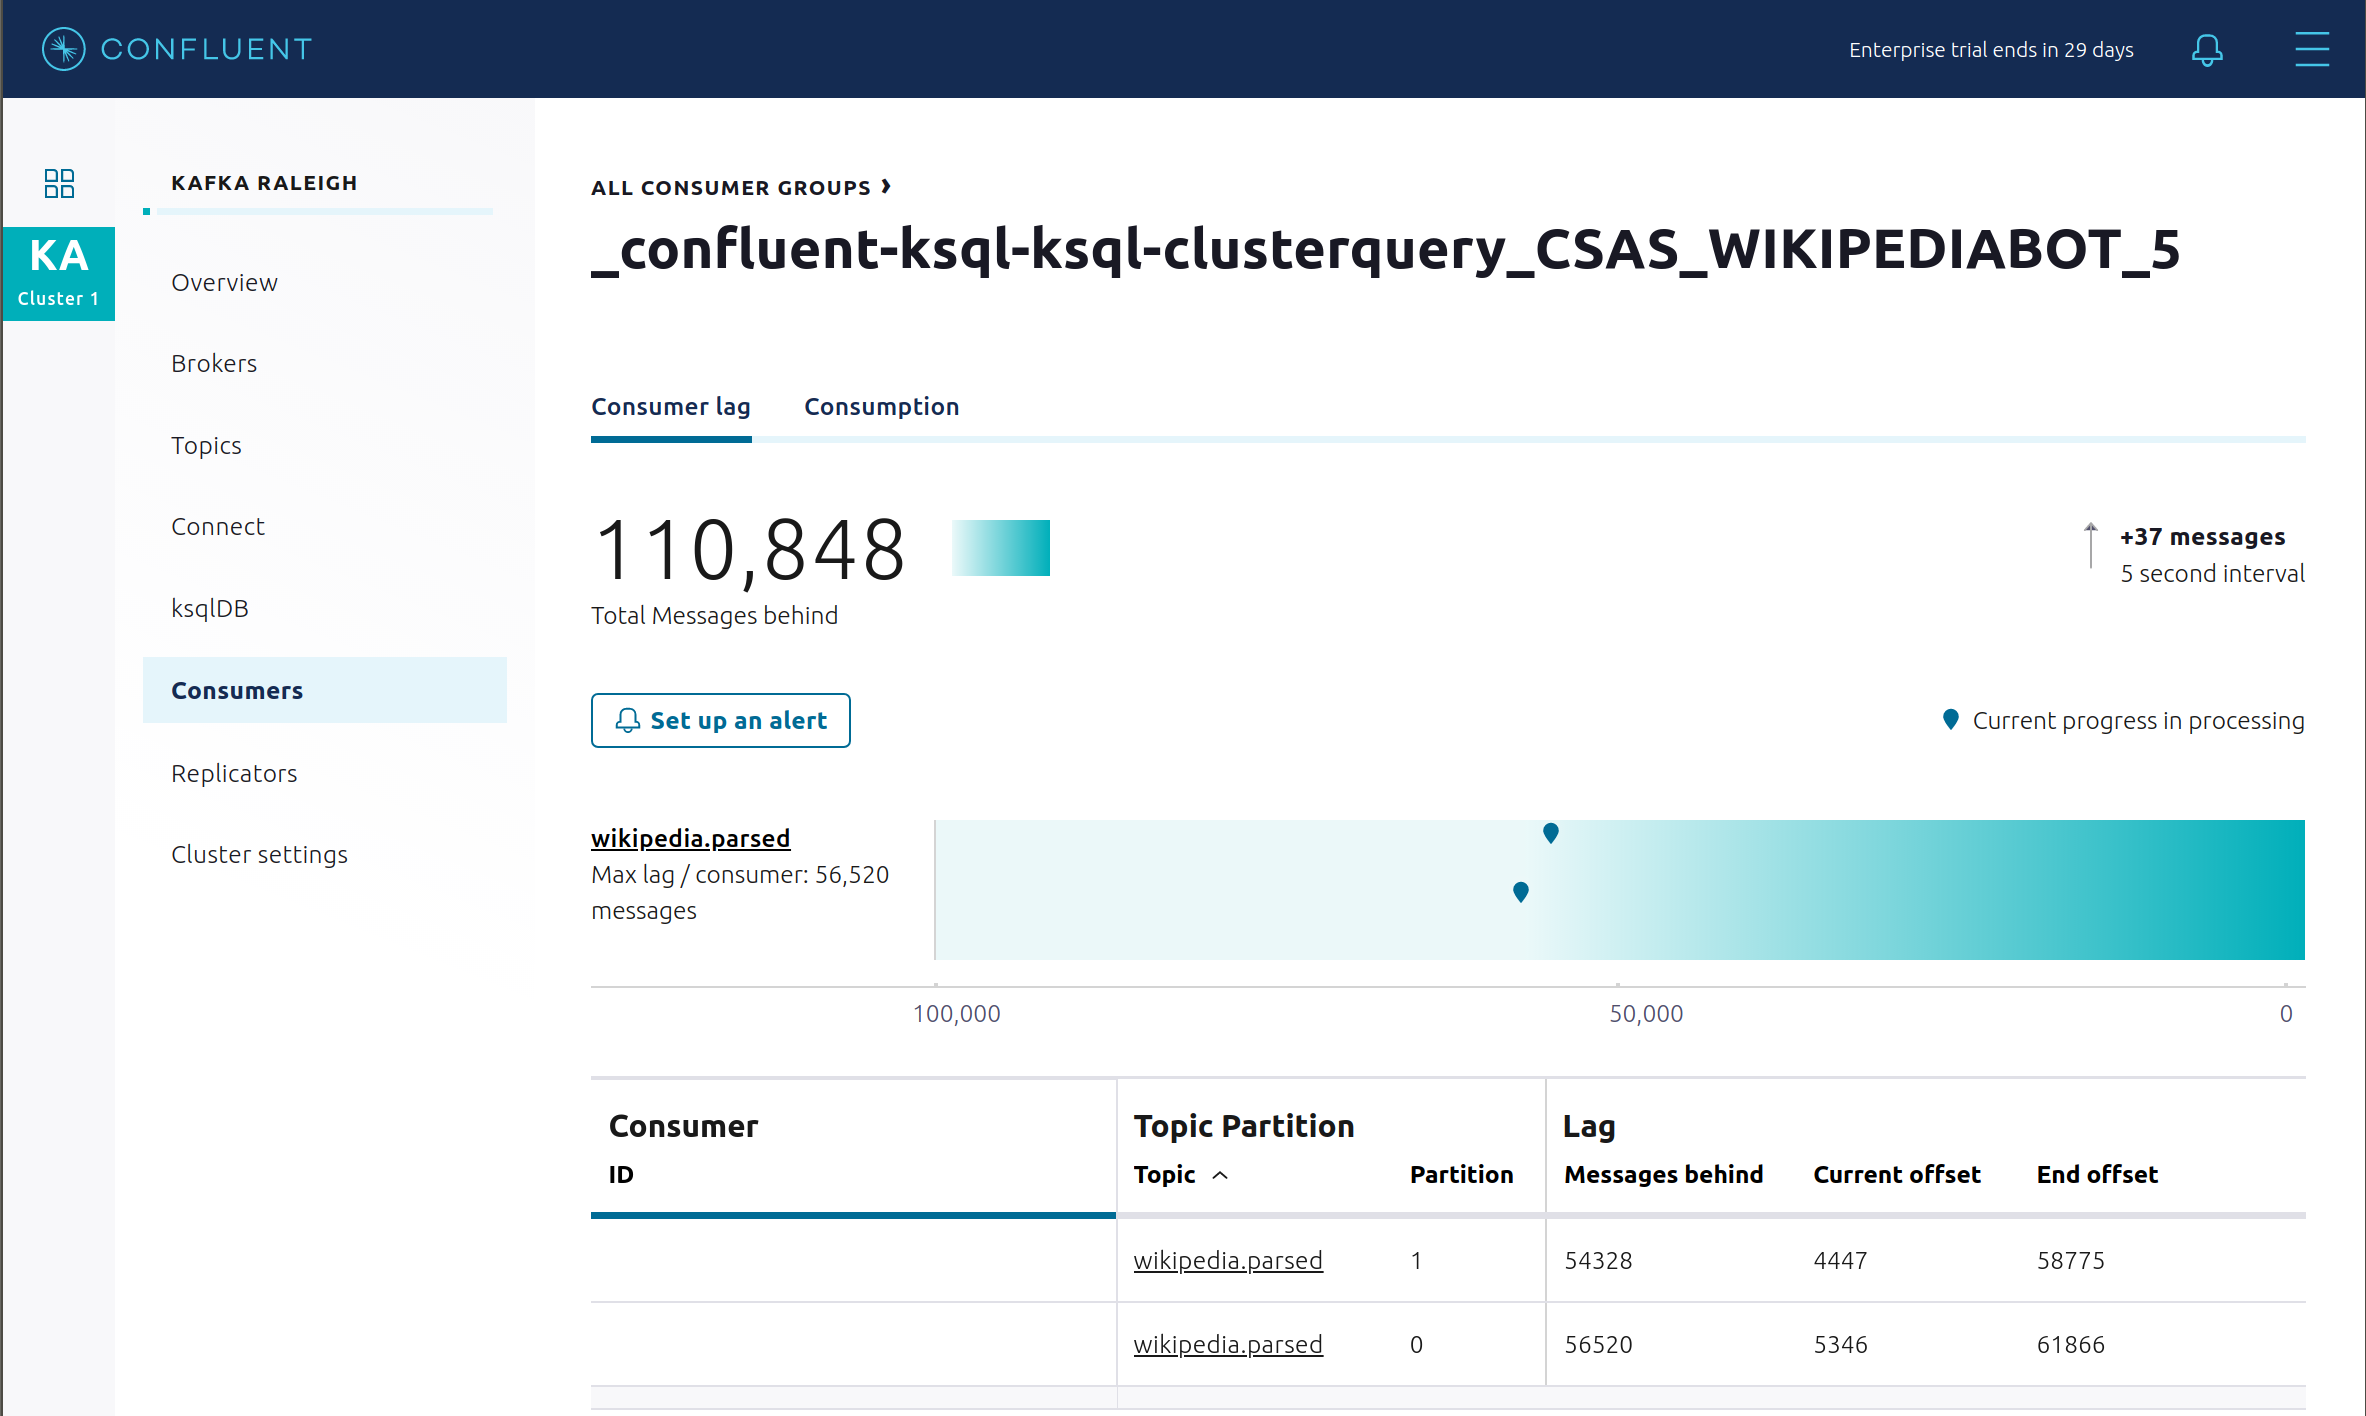
View consumer lag for the Kafka Streams application under the consumer group id
wikipedia-activity-monitor. This application is run by the cnfldemos/cp-demo-kstreams Docker container (application source code).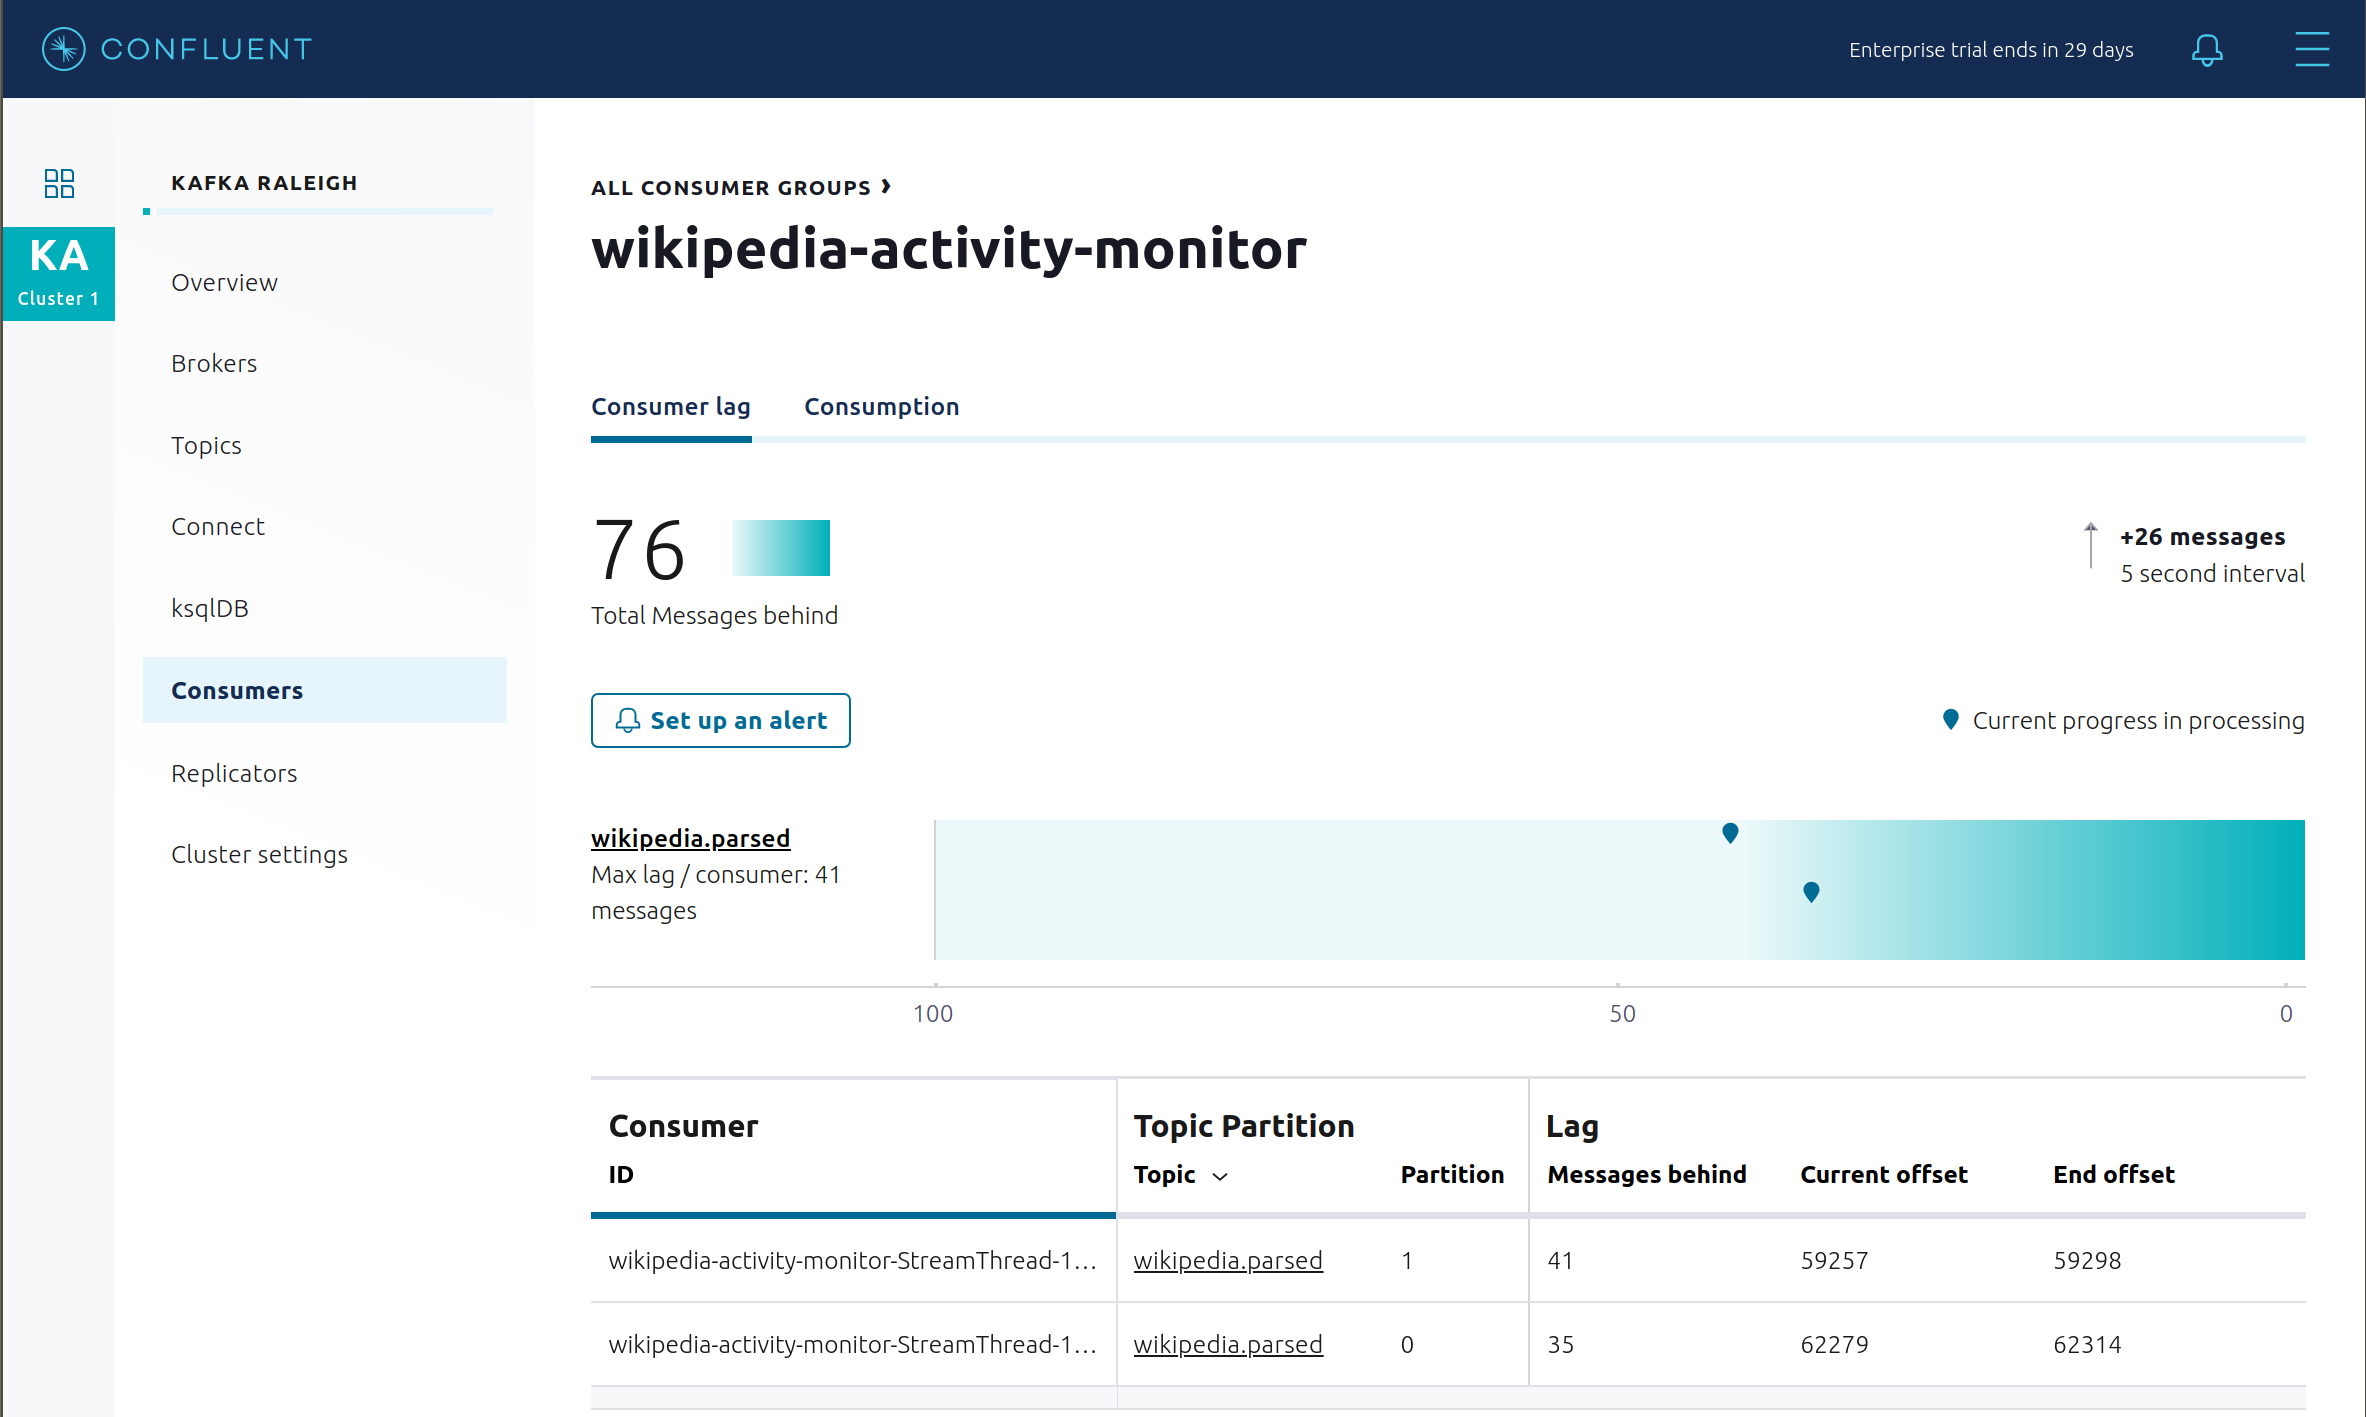
Consumption metrics are available on a per-consumer basis. These consumption charts are only populated if Confluent Monitoring Interceptors are configured, as they are in this example. You can view
% messages consumedandend-to-end latency. View consumption metrics for the persistent ksqlDB “Create Stream As Select” queryCSAS_WIKIPEDIABOT, which is displayed as_confluent-ksql-default_query_CSAS_WIKIPEDIABOT_0in the consumer group list.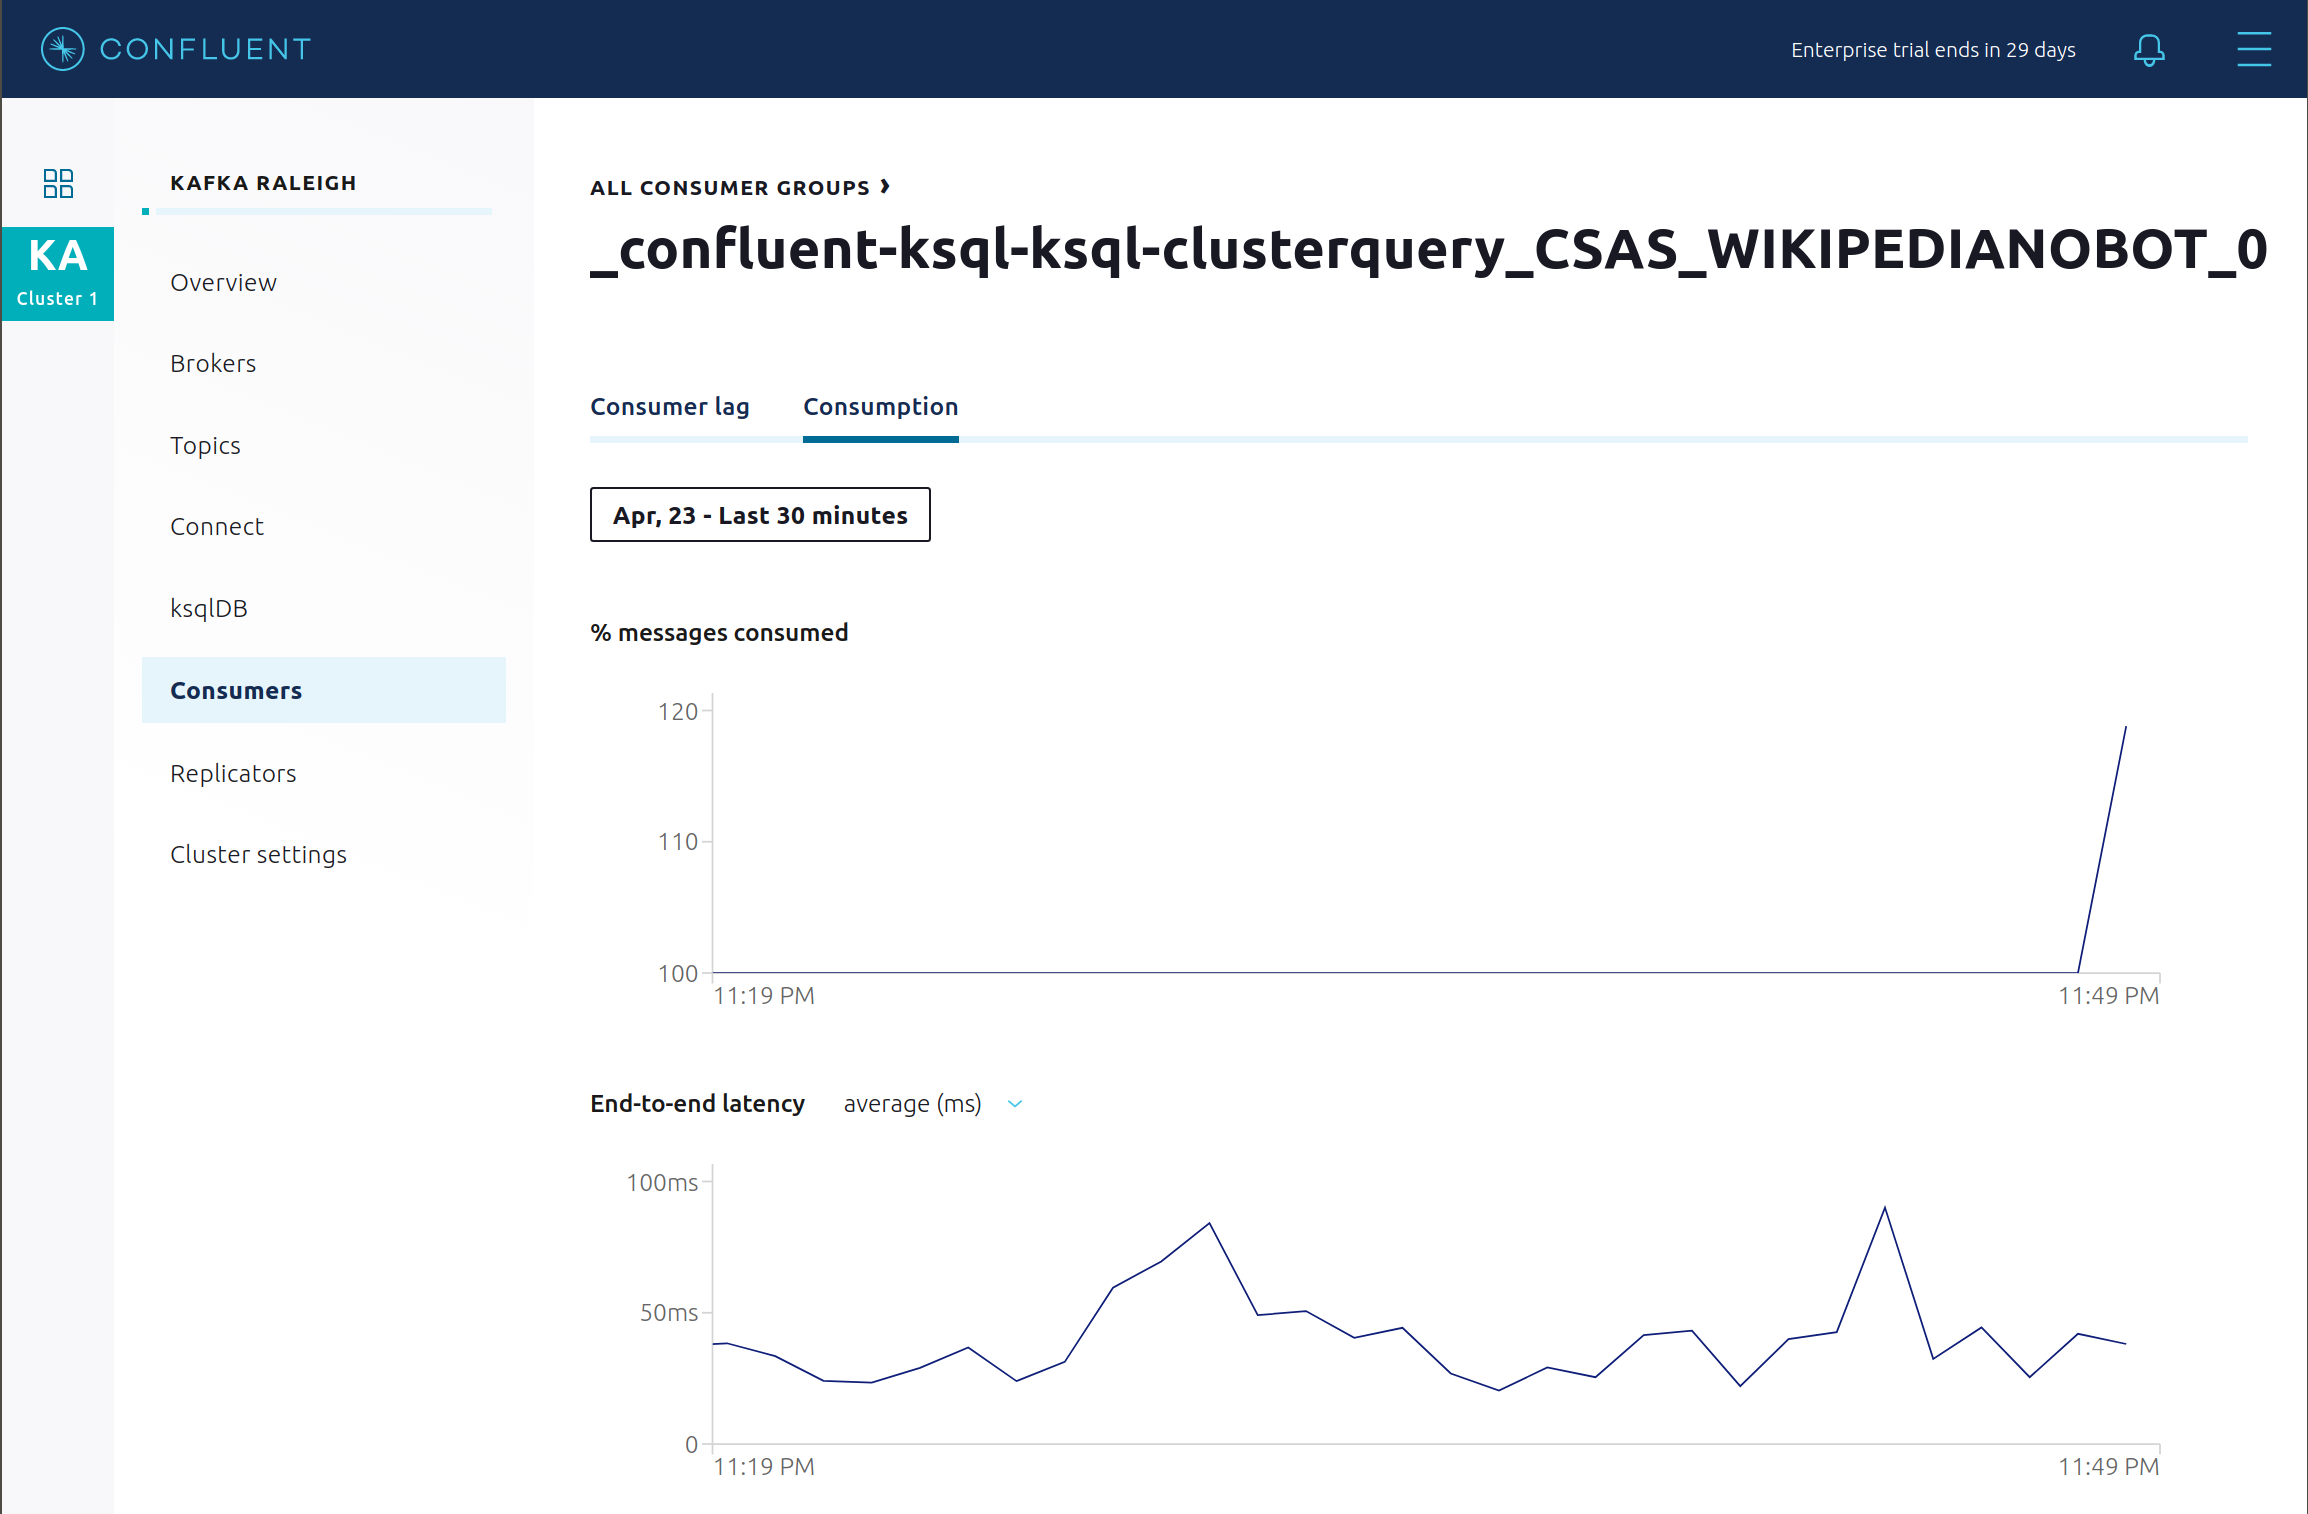
Confluent Control Center shows which consumers in a consumer group are consuming from which partitions and on which brokers those partitions reside. Confluent Control Center updates as consumer rebalances occur in a consumer group. Start consuming from topic
wikipedia.parsedwith a new consumer groupappwith one consumerconsumer_app_1. It runs in the background../scripts/app/start_consumer_app.sh 1
Let this consumer group run for 2 minutes until Confluent Control Center shows the consumer group
appwith steady consumption. This consumer groupapphas a single consumerconsumer_app_1consuming all of the partitions in the topicwikipedia.parsed.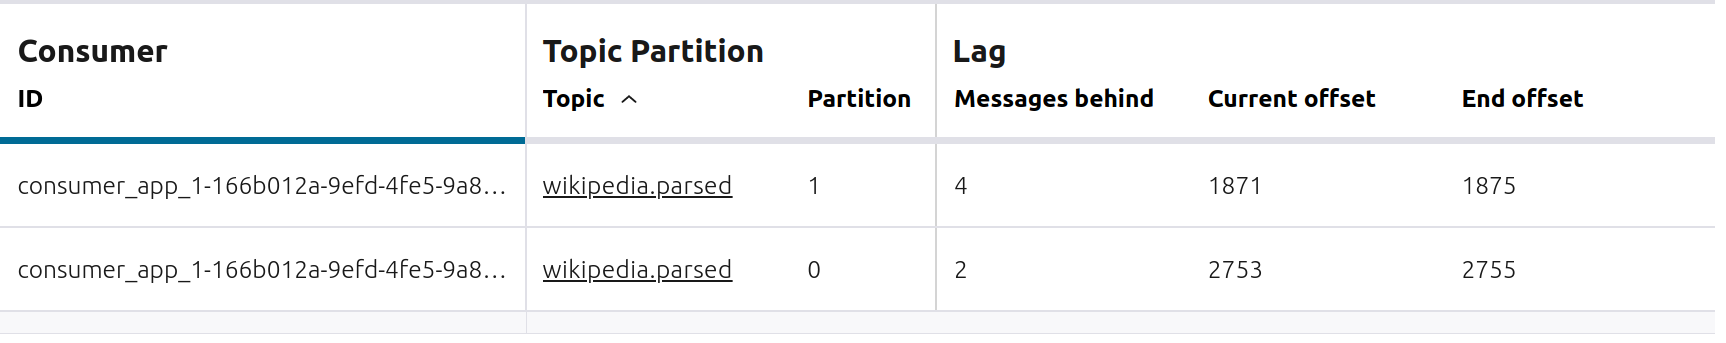
Add a second consumer
consumer_app_2to the existing consumer groupapp../scripts/app/start_consumer_app.sh 2
Let this consumer group run for 2 minutes until Confluent Control Center shows the consumer group
appwith steady consumption. Notice that the consumersconsumer_app_1andconsumer_app_2now share consumption of the partitions in the topicwikipedia.parsed.
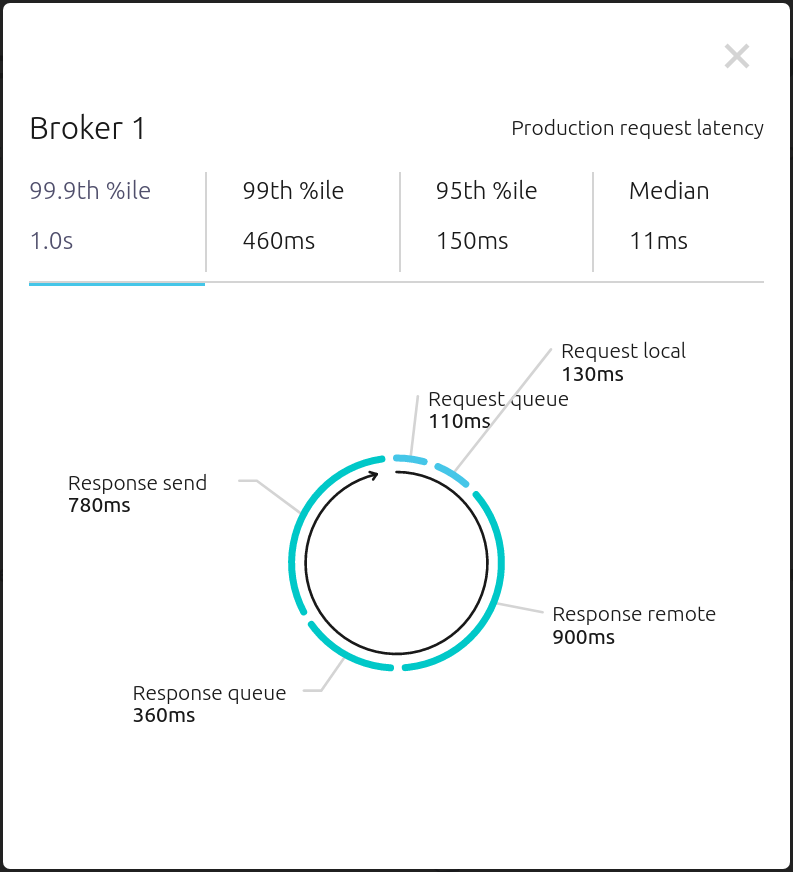
From the Brokers -> Consumption view, click on a point in the Request latency line graph to view a breakdown of latencies through the entire request lifecycle.
Replicator
Confluent Replicator copies data from a source Kafka cluster to a destination Kafka cluster. The source and destination clusters are typically different clusters, but in this example, Replicator is doing intra-cluster replication, i.e., the source and destination Kafka clusters are the same. As with the rest of the components in the solution, Confluent Replicator is also configured with security.
View Replicator status and throughput in a dedicated view in Confluent Control Center.
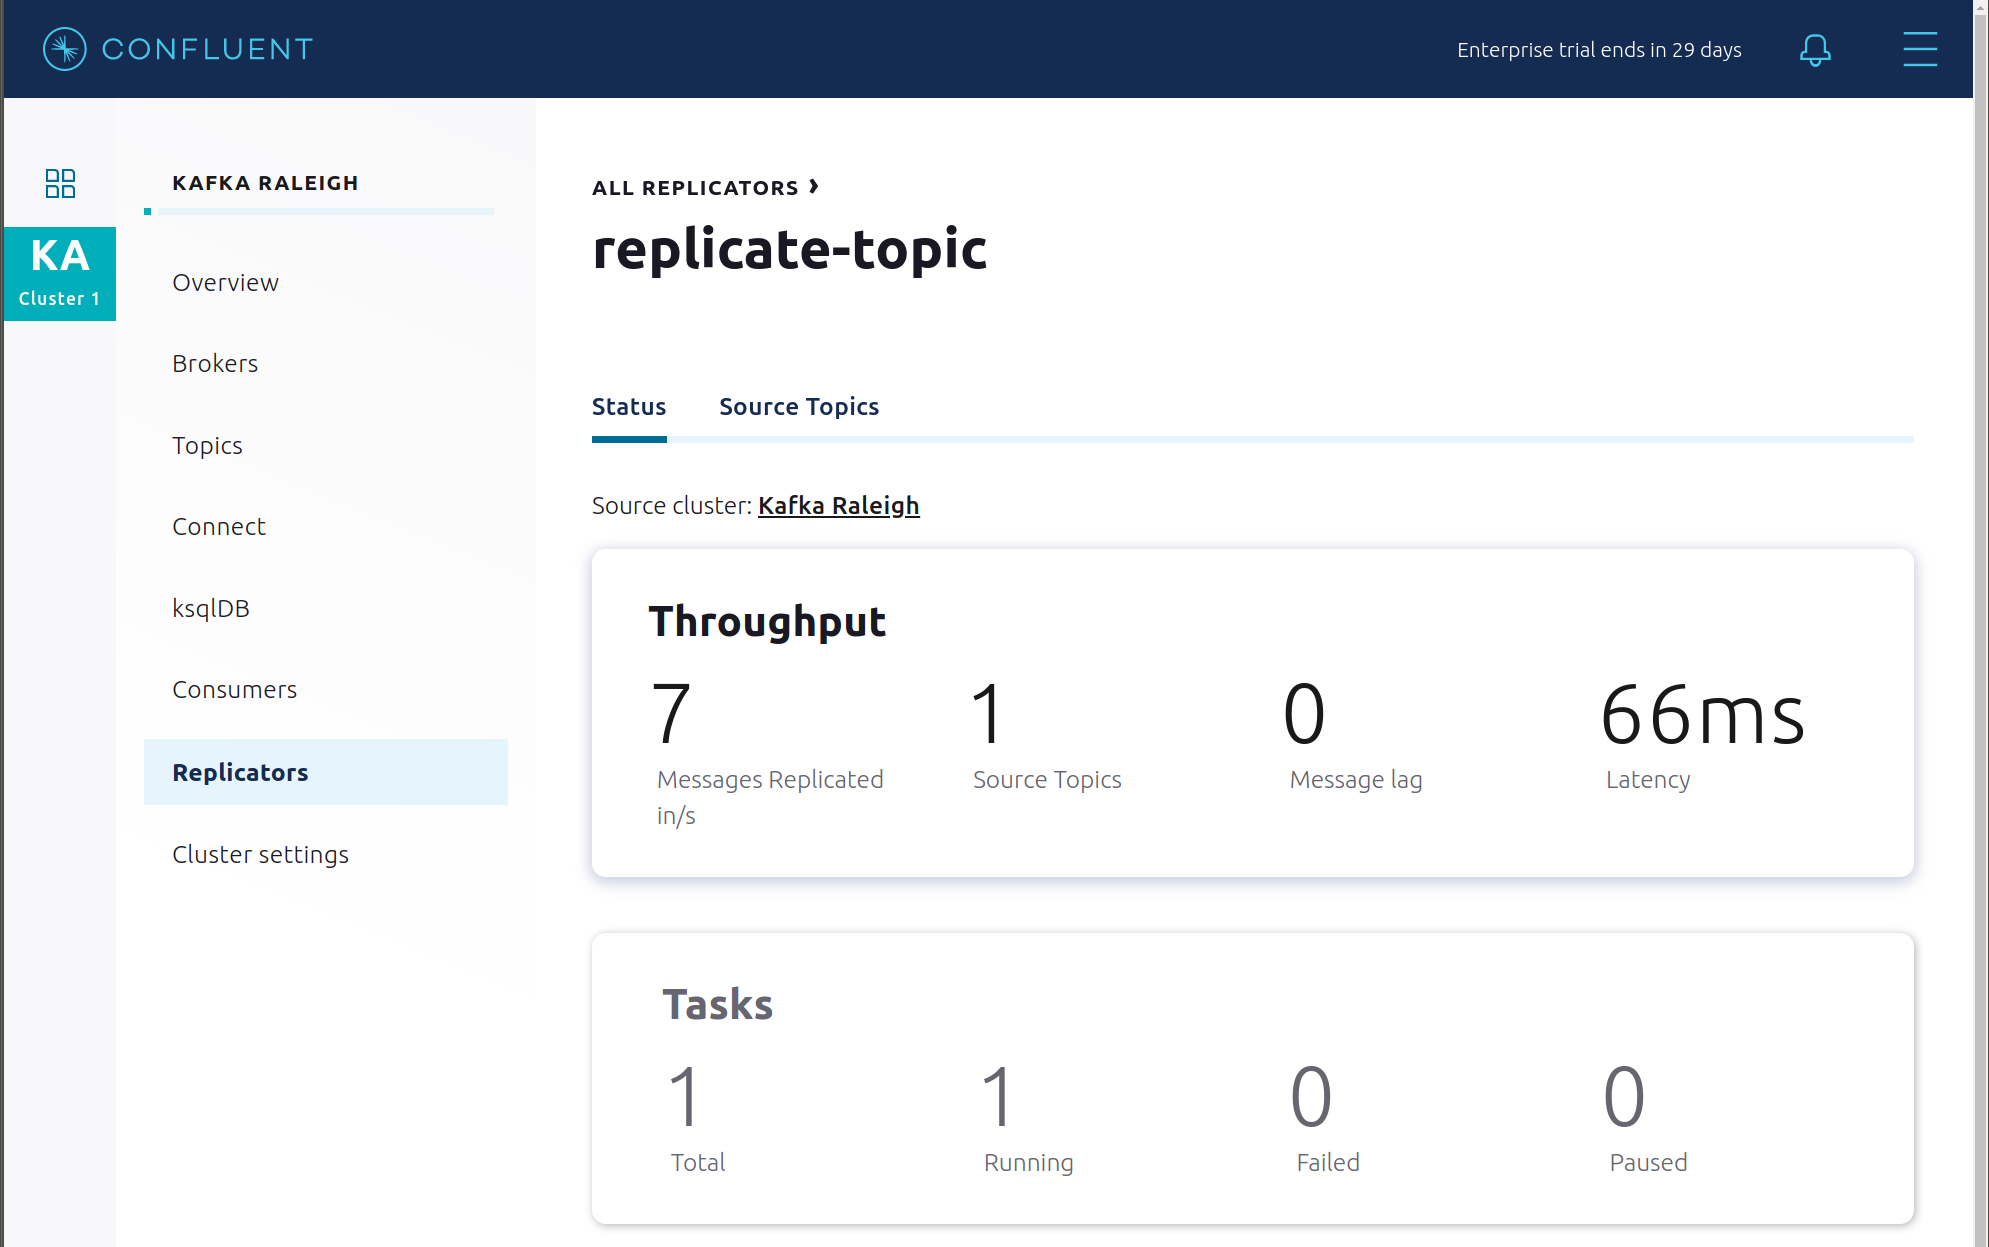
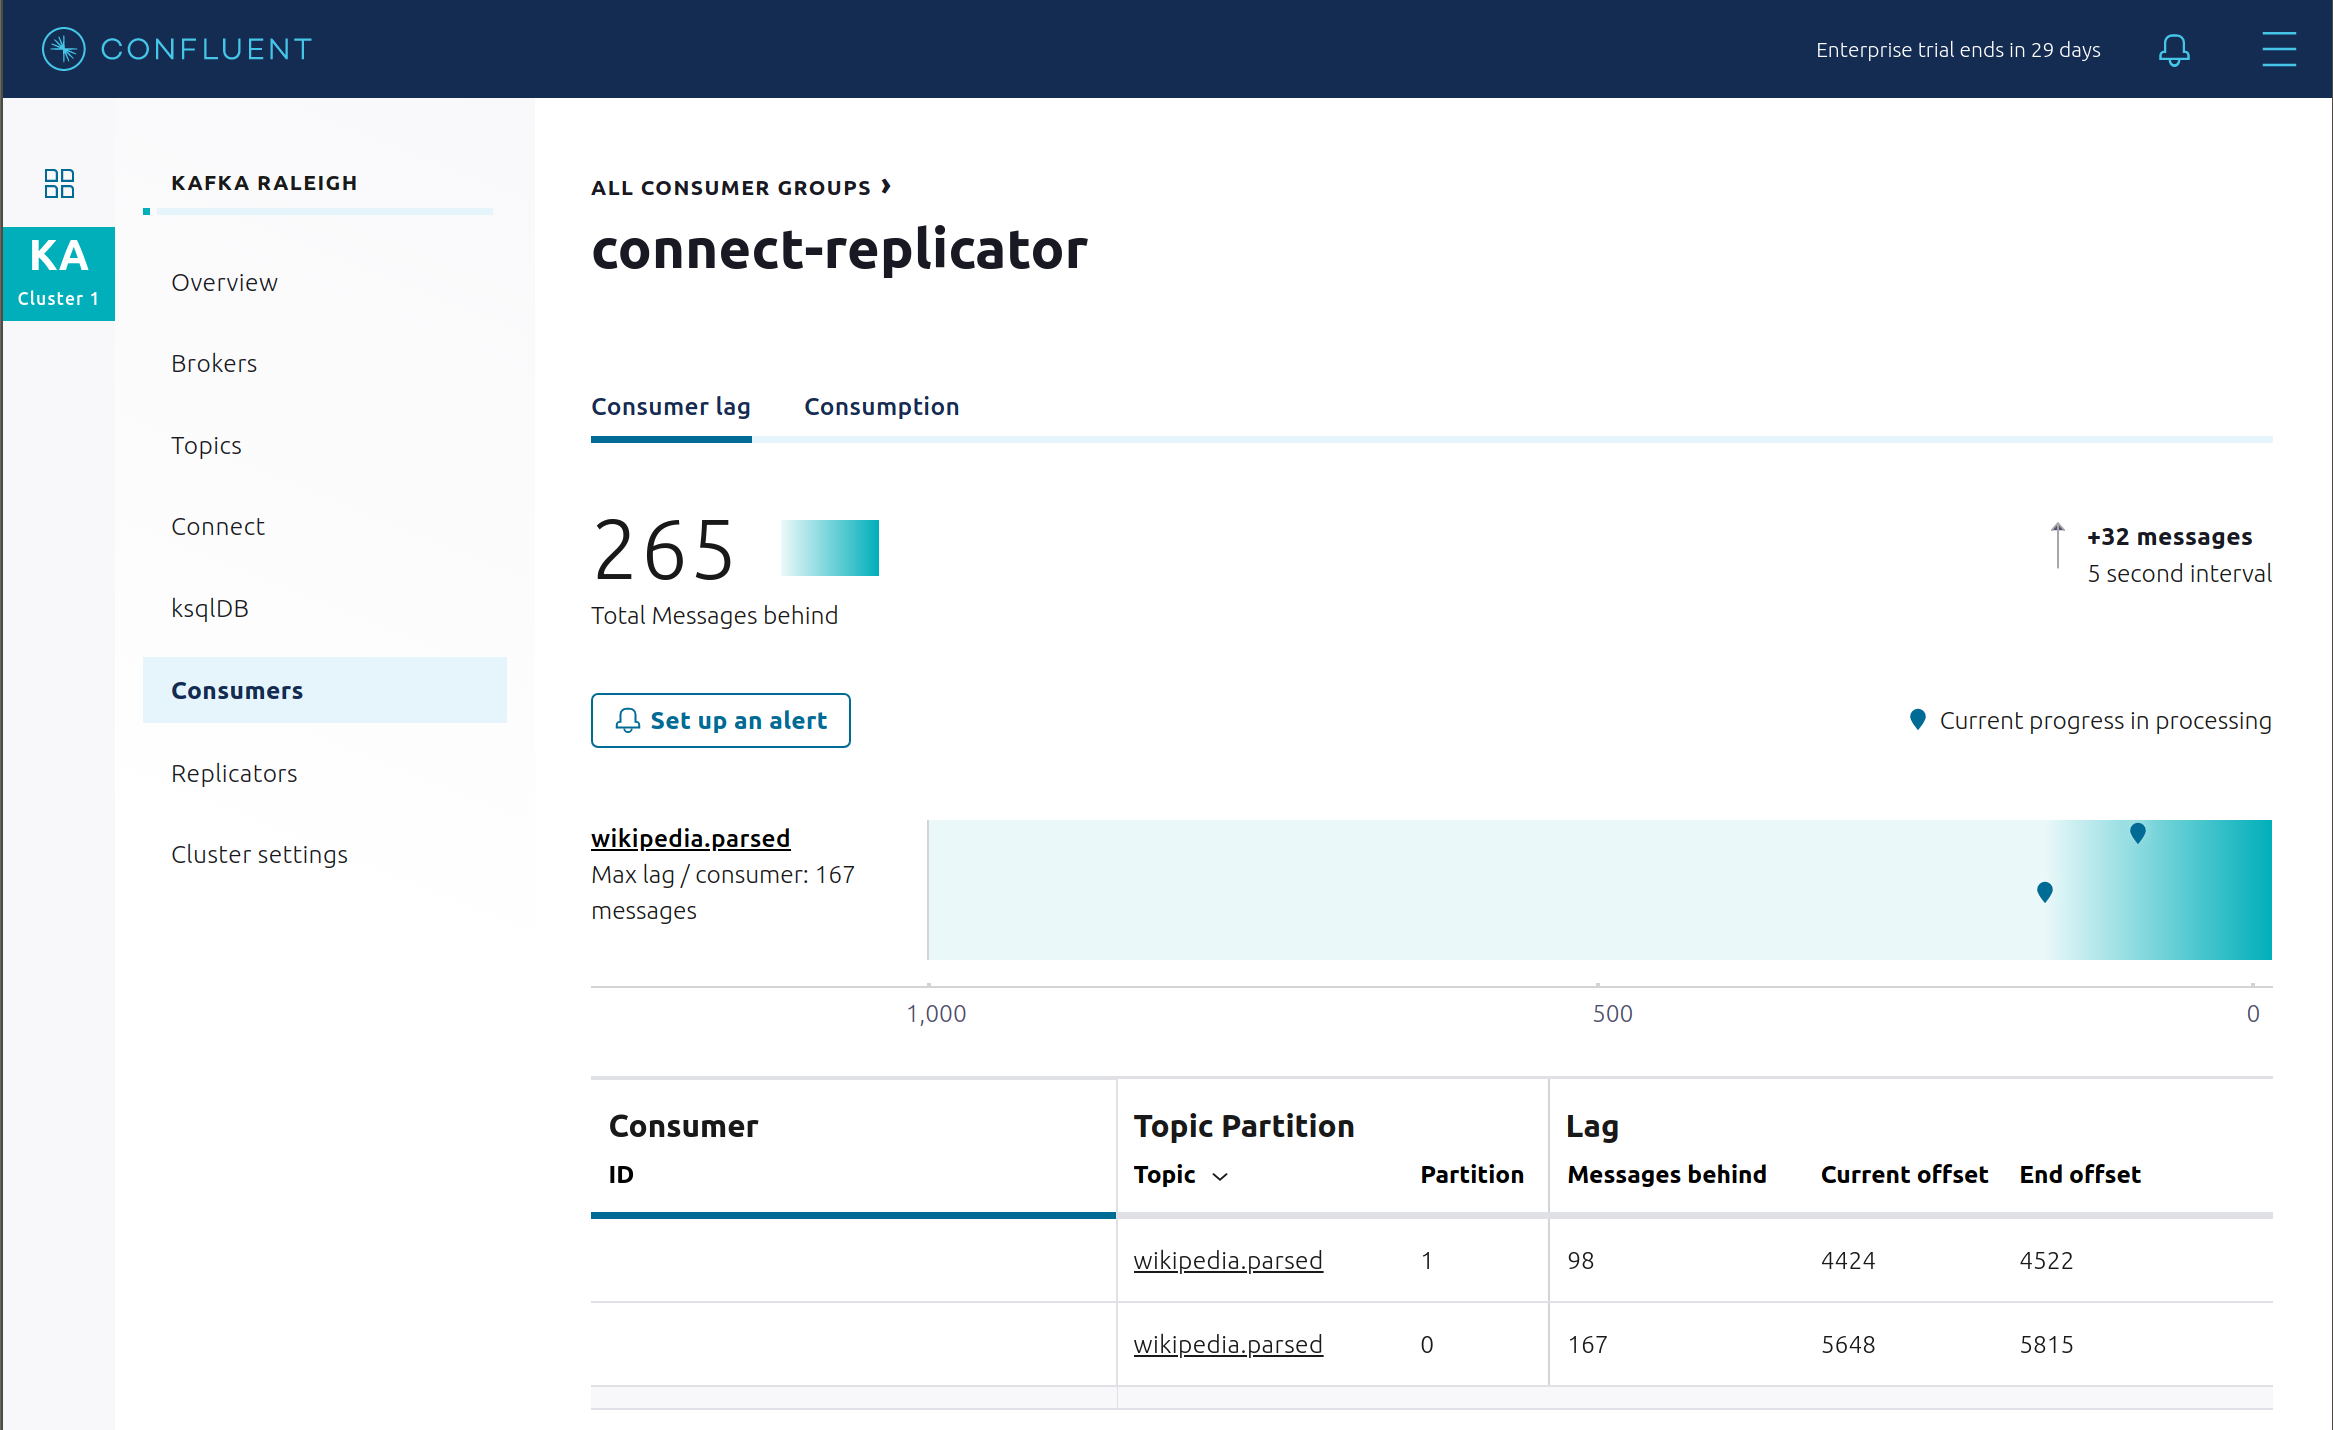
Consumers: monitor throughput and latency of Confluent Replicator. Replicator is a Kafka Connect source connector and has a corresponding consumer group
connect-replicator.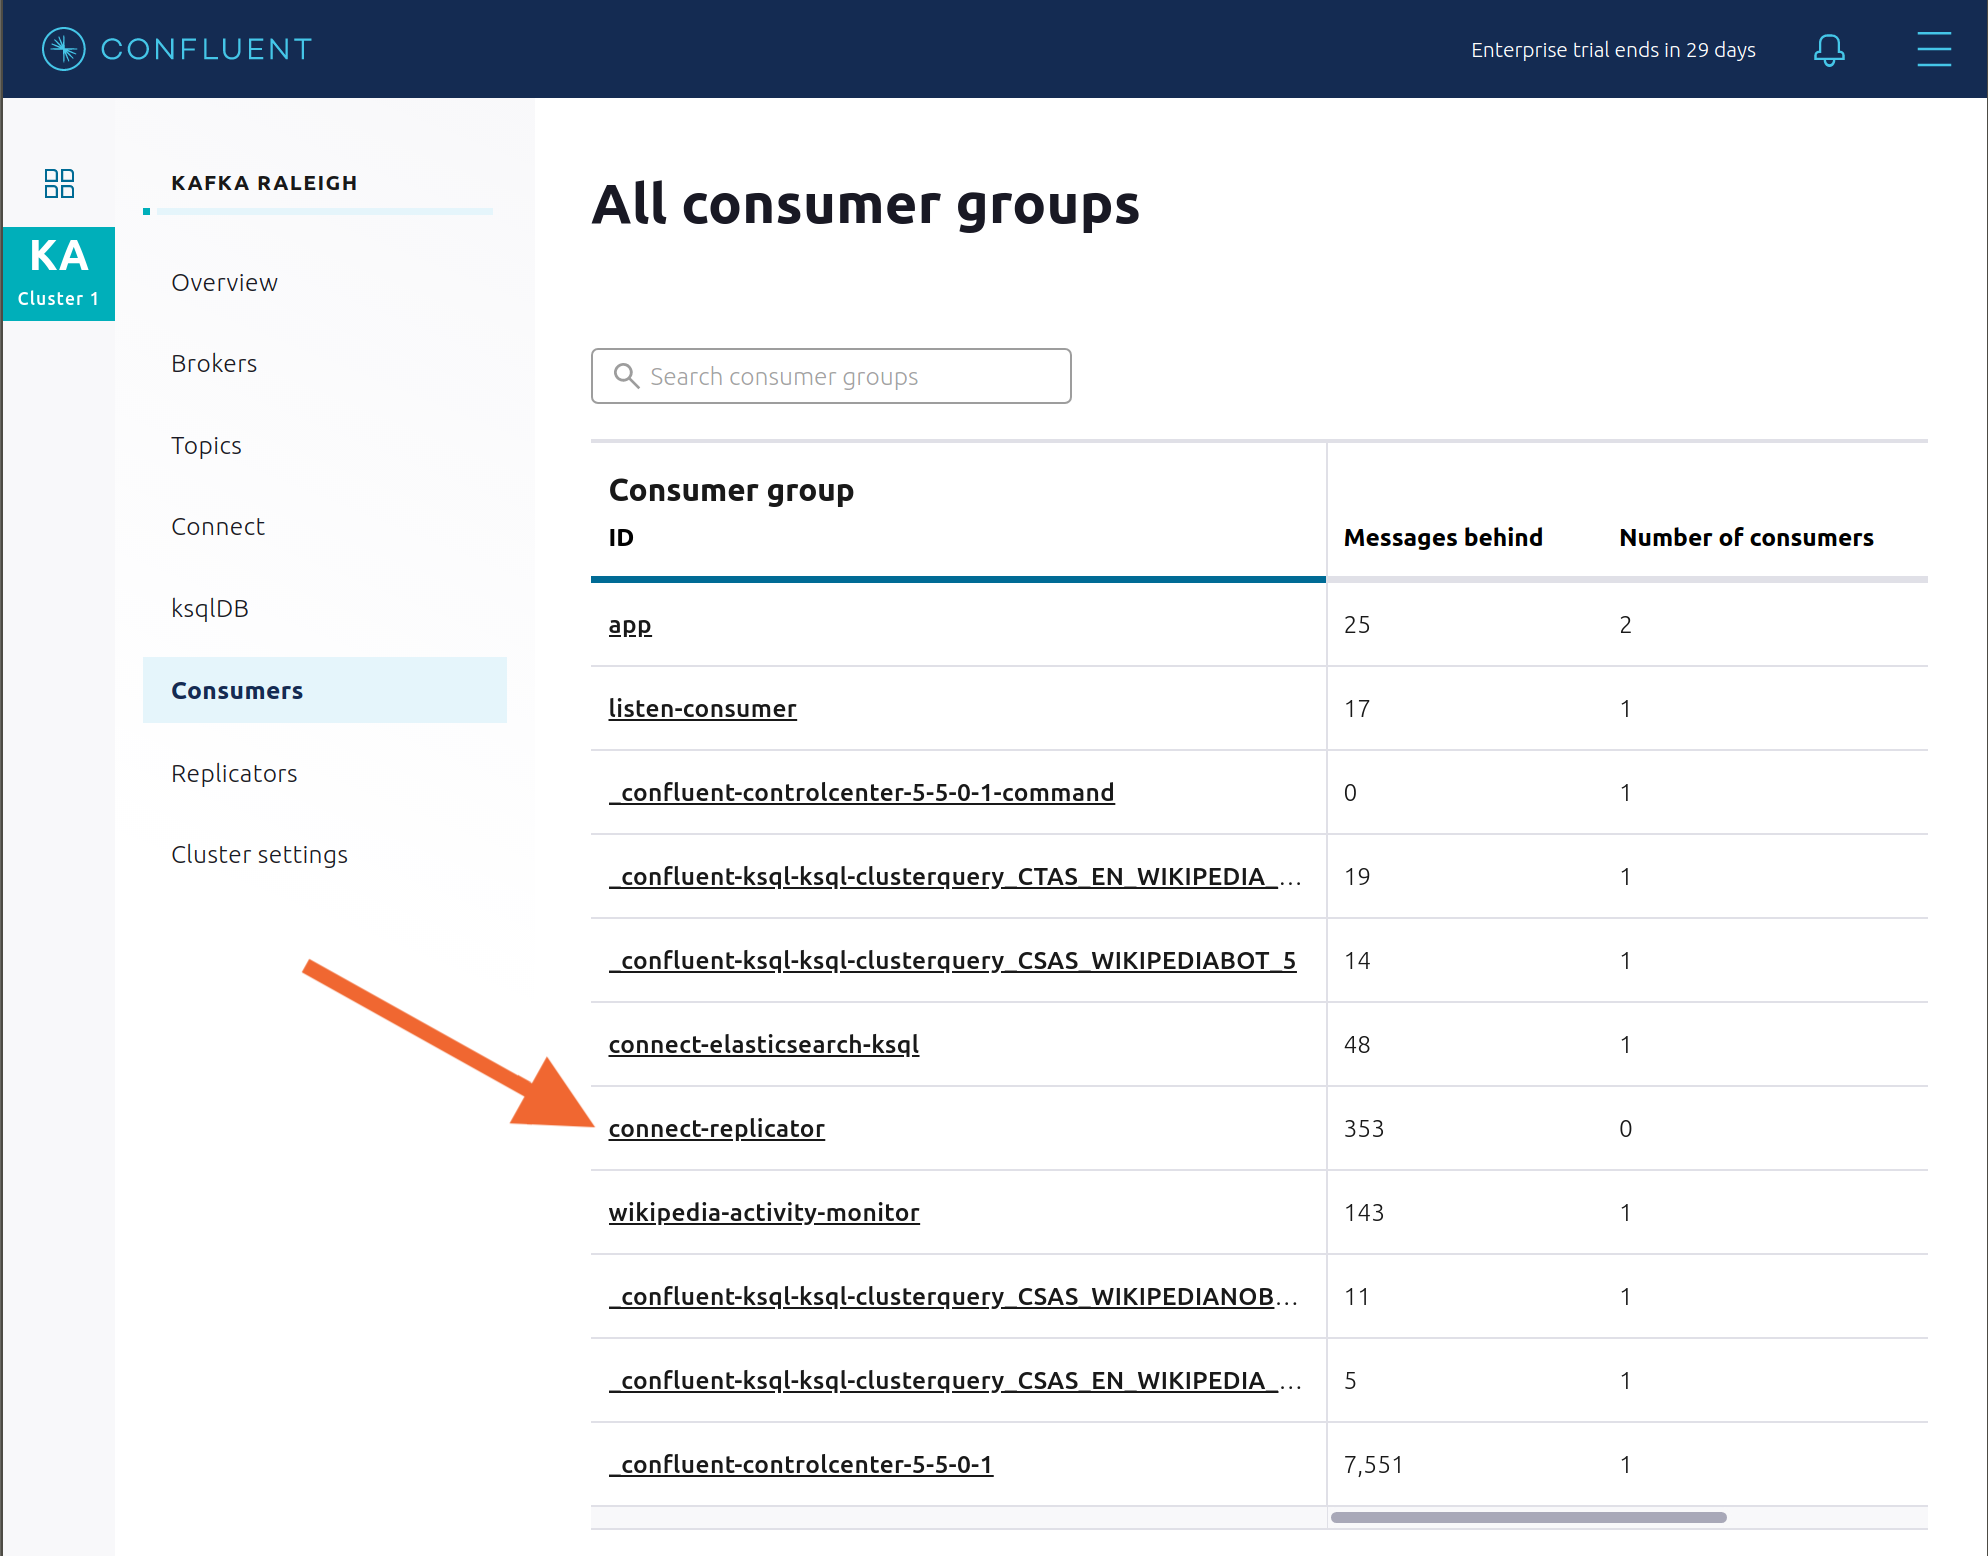
View Replicator Consumer Lag.
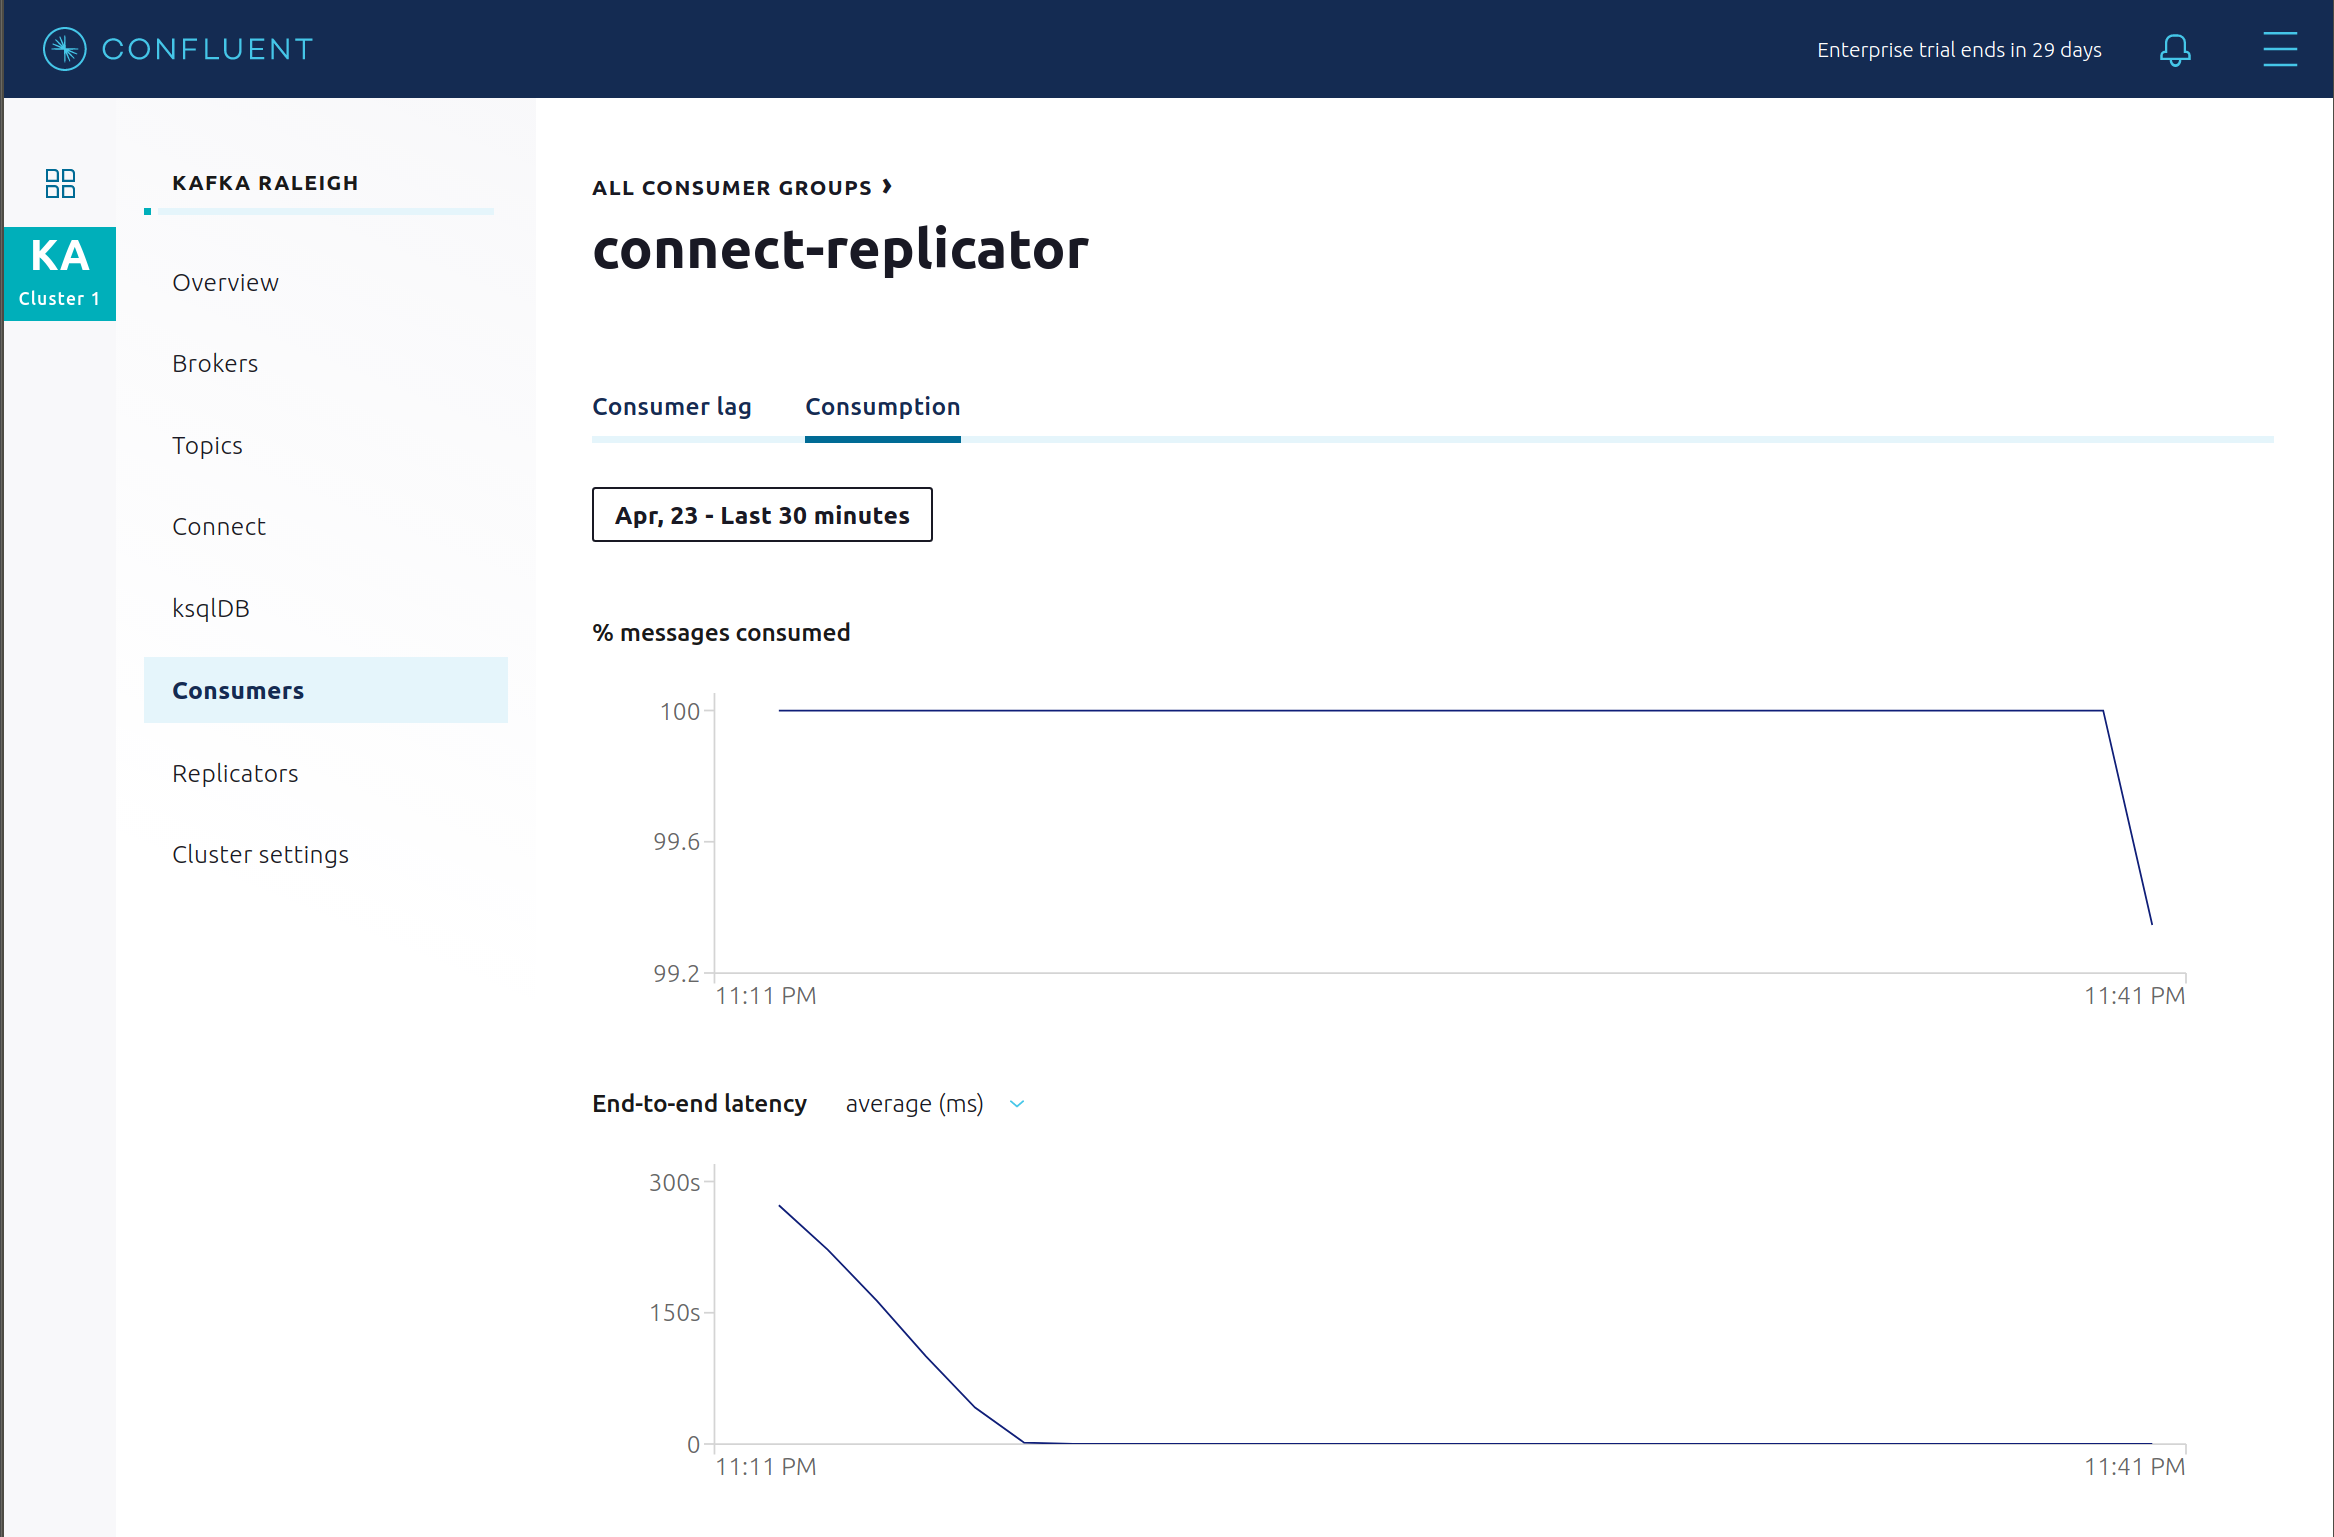
View Replicator Consumption metrics.
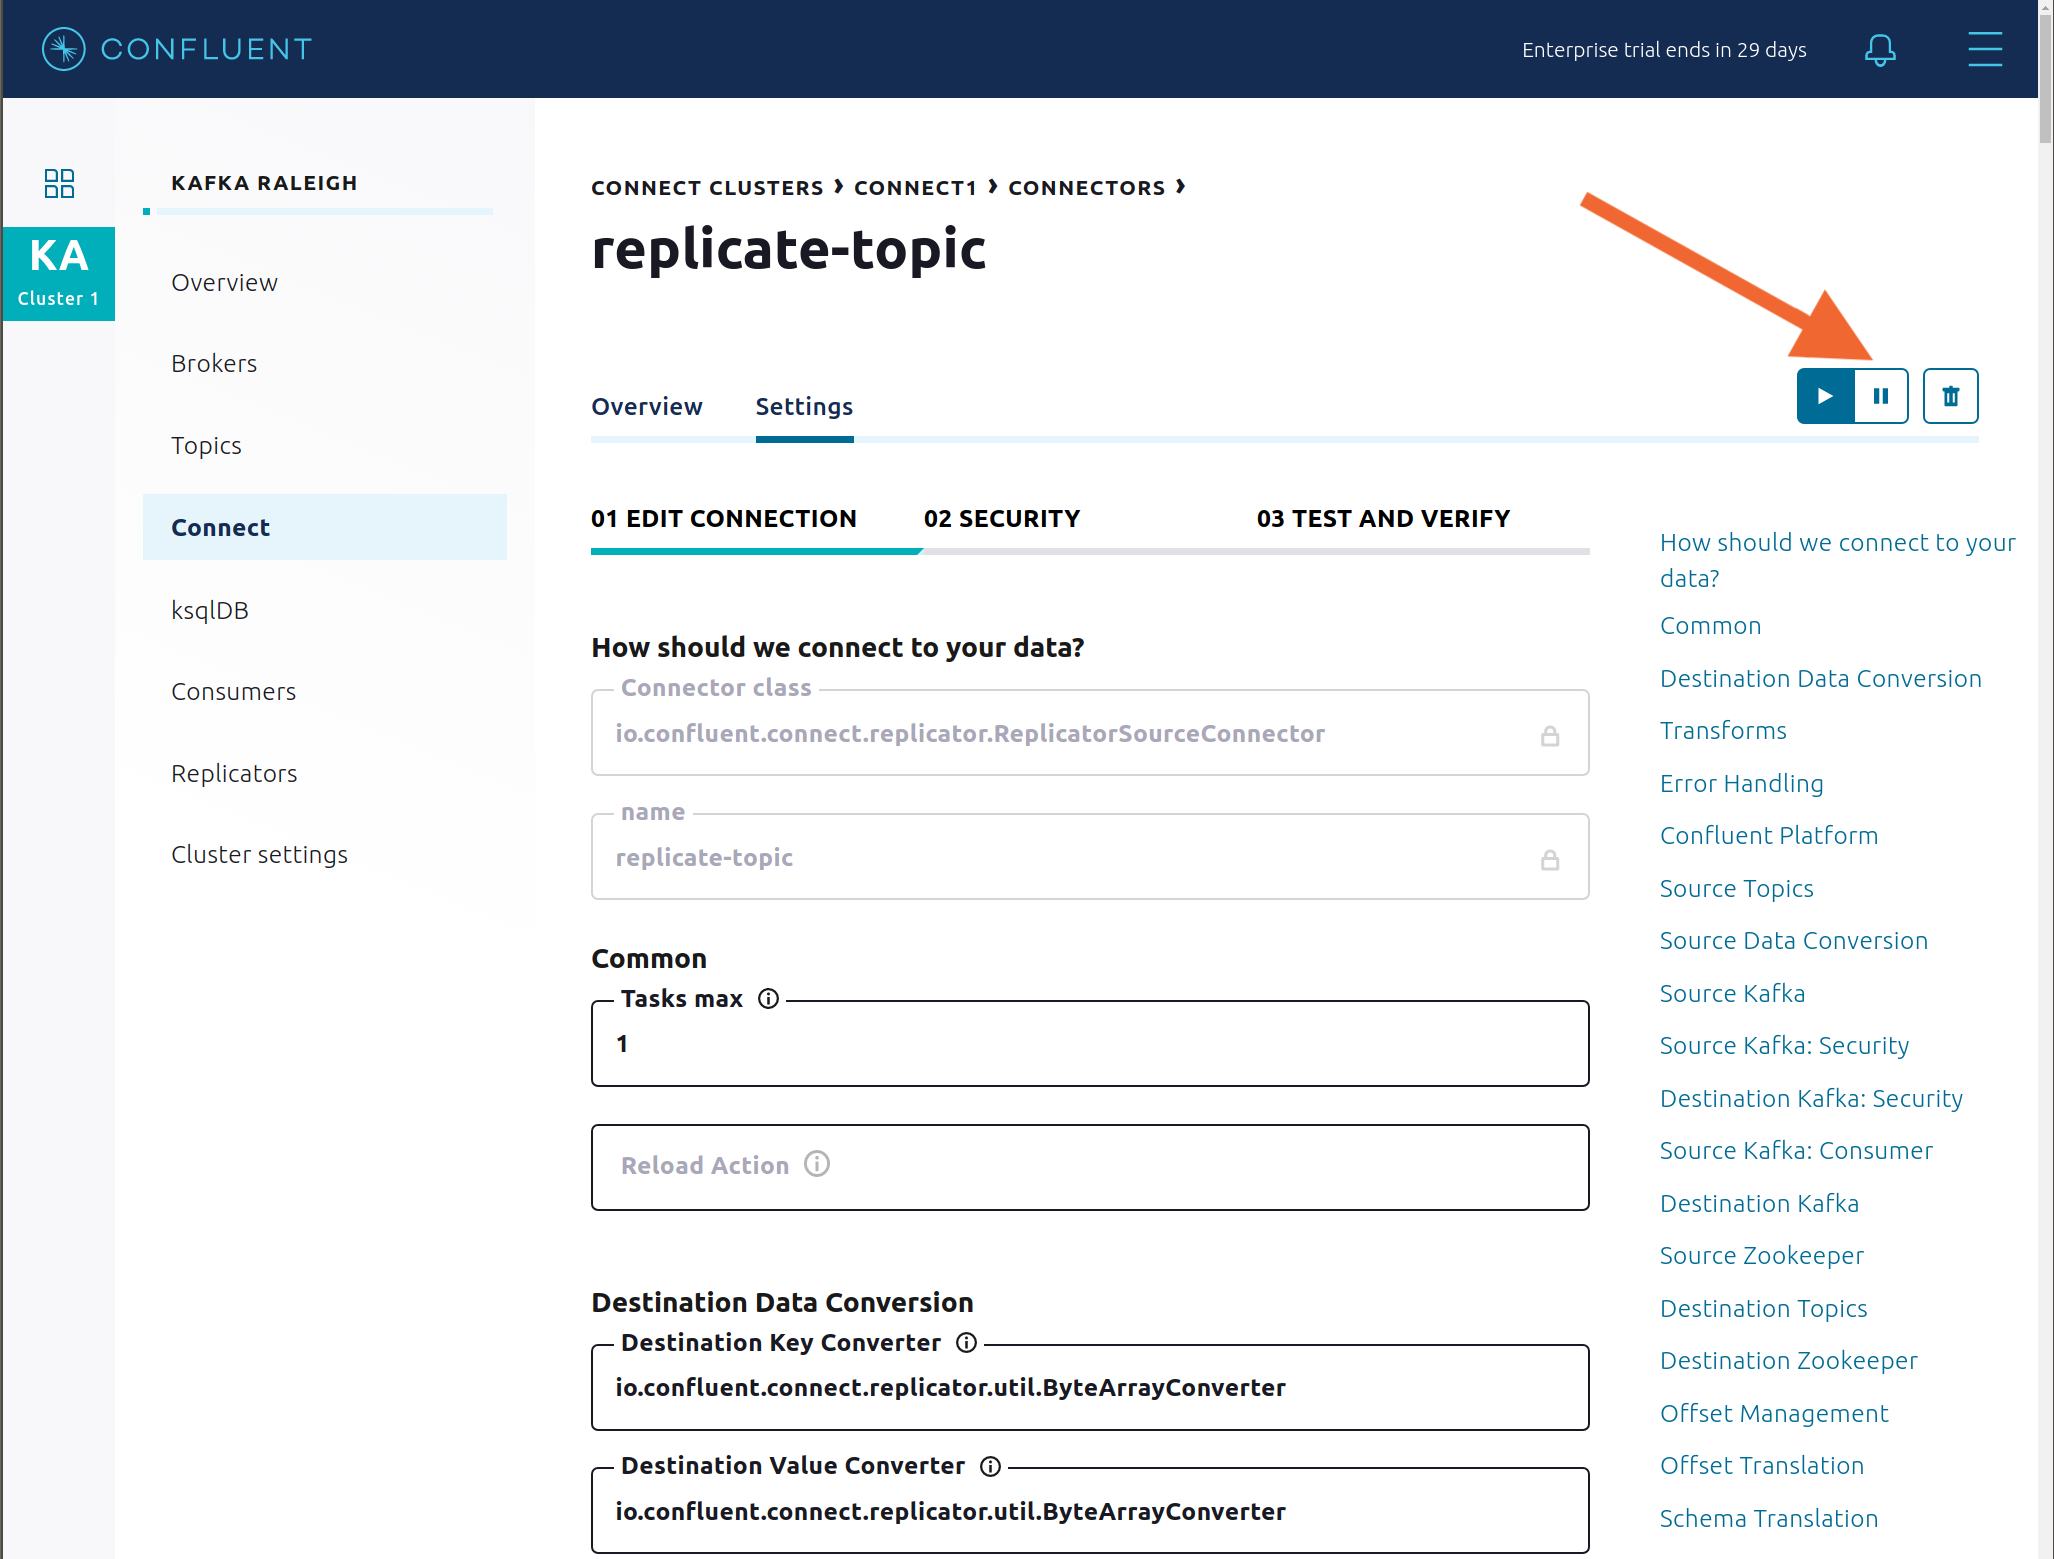
Connect: pause the Replicator connector in Settings by pressing the pause icon in the top right and wait for 10 seconds until it takes effect. This will stop consumption for the related consumer group.
Observe that the
connect-replicatorconsumer group has stopped consumption.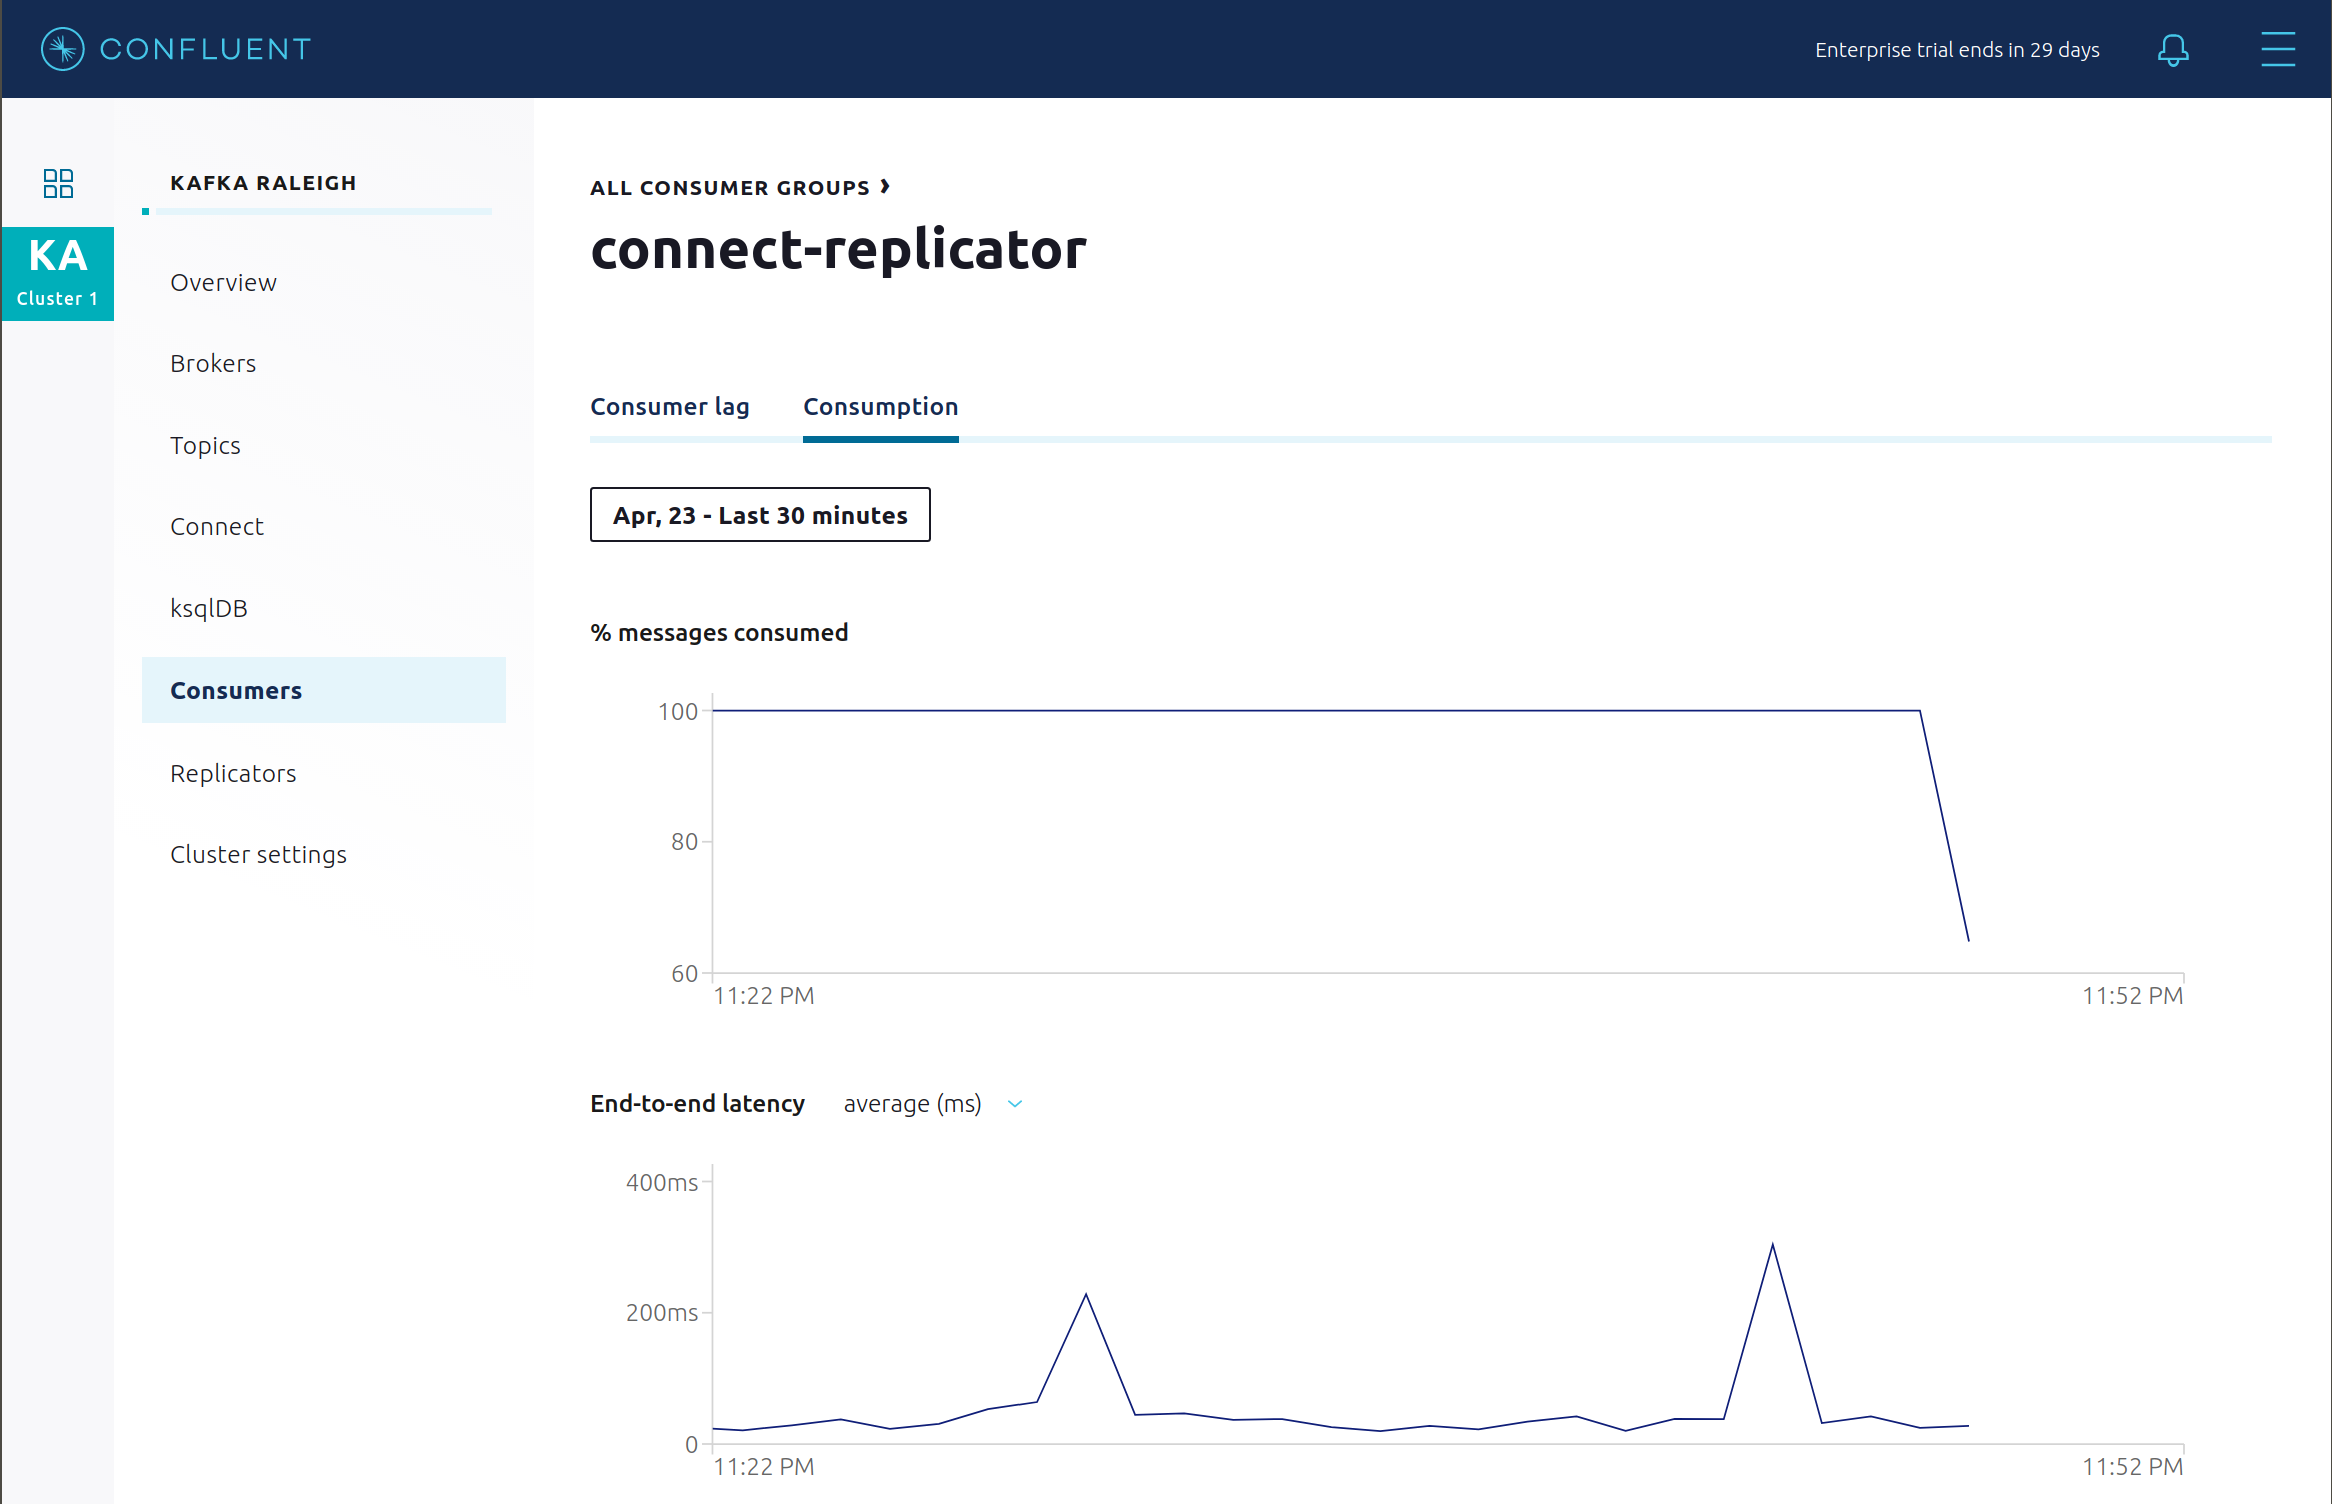
Restart the Replicator connector.
Observe that the
connect-replicatorconsumer group has resumed consumption. Notice several things:- Even though the consumer group connect-replicator was not running for some of this time, all messages are shown as delivered. This is because all bars are time windows relative to produce timestamp.
- The latency peaks and then gradually decreases, because this is also relative to the produce timestamp.
Next step: Learn more about Replicator with the Replicator Tutorial.
Security
All the Confluent Platform components and clients in this example are enabled with many security features.
- Metadata Service (MDS) which is the central authority for authentication and authorization. It is configured with the Confluent Server Authorizer and talks to LDAP to authenticate clients.
- SSL for encryption and mTLS. The example automatically generates SSL certificates and creates keystores, truststores, and secures them with a password.
- Role-Based Access Control (RBAC) for authorization. If a resource has no associated ACLs, then users are not allowed to access the resource, except super users.
- ZooKeeper is configured for SSL AND SASL/DIGEST-MD5 (Note: no REST Proxy and Schema Registry TLS support with trial licenses).
- HTTPS for Control Center.
- HTTPS for Schema Registry.
- HTTPS for Connect.
You can see each component’s security configuration in the example’s docker-compose.yml file.
Note
This example showcases a secure Confluent Platform for educational purposes and is not meant to be complete best practices. There are certain differences between what is shown in the example and what you should do in production:
- Authorize users only for operations that they need, instead of making all of them super users
- If the
PLAINTEXTsecurity protocol is used, theseANONYMOUSusernames should not be configured as super users - Consider not even opening the
PLAINTEXTport ifSSLorSASL_SSLare configured
There is an OpenLDAP server running in the example, and each Kafka broker in the example is configured with MDS and can talk to LDAP so that it can authenticate clients and Confluent Platform services and clients.
Zookeeper has two listener ports:
| Name | Protocol | In this example, used for … | zookeeper | |
|---|---|---|---|---|
| N/A | SASL/DIGEST-MD5 | Validating trial license for REST Proxy and Schema Registry. (no TLS support) | 2181 | |
| N/A | mTLS | Broker communication (kafka1, kafka2) | 2182 | |
Each broker has five listener ports:
| Name | Protocol | In this example, used for … | kafka1 | kafka2 |
|---|---|---|---|---|
| N/A | MDS | Authorization via RBAC | 8091 | 8092 |
| INTERNAL | SASL_PLAINTEXT | CP Kafka clients (e.g. Confluent Metrics Reporter), SASL_PLAINTEXT | 9091 | 9092 |
| TOKEN | SASL_SSL | Confluent Platform service (e.g. Schema Registry) when they need to use impersonation | 10091 | 10092 |
| SSL | SSL | End clients, (e.g. stream-demo), with SSL no SASL | 11091 | 11092 |
| CLEAR | PLAINTEXT | No security, available as a backdoor; for demo and learning only | 12091 | 12092 |
End clients (non-CP clients):
- Authenticate using mTLS via the broker SSL listener.
- If they are also using Schema Registry, authenticate to Schema Registry via LDAP.
- If they are also using Confluent Monitoring interceptors, authenticate using mTLS via the broker SSL listener.
- Should never use the TOKEN listener which is meant only for internal communication between Confluent components.
- See client configuration used in the example by the
streams-democontainer running the Kafka Streams applicationwikipedia-activity-monitor.
Verify the ports on which the Kafka brokers are listening with the following command, and they should match the table shown below:
docker-compose logs kafka1 | grep "Registered broker 1"
docker-compose logs kafka2 | grep "Registered broker 2"
For example only: Communicate with brokers via the PLAINTEXT port, client security configurations are not required
# CLEAR/PLAINTEXT port
docker-compose exec kafka1 kafka-consumer-groups --list --bootstrap-server kafka1:12091
End clients: Communicate with brokers via the SSL port, and SSL parameters configured via the
--command-configargument for command line tools or--consumer.configfor kafka-console-consumer.# SSL/SSL port docker-compose exec kafka1 kafka-consumer-groups --list --bootstrap-server kafka1:11091 \ --command-config /etc/kafka/secrets/client_without_interceptors_ssl.config
If a client tries to communicate with brokers via the SSL port but does not specify the SSL parameters, it will fail
# SSL/SSL port
docker-compose exec kafka1 kafka-consumer-groups --list --bootstrap-server kafka1:11091
Your output should resemble:
ERROR Uncaught exception in thread 'kafka-admin-client-thread | adminclient-1': (org.apache.kafka.common.utils.KafkaThread)
java.lang.OutOfMemoryError: Java heap space
...
Communicate with brokers via the SASL_PLAINTEXT port, and SASL_PLAINTEXT parameters configured via the
--command-configargument for command line tools or--consumer.configfor kafka-console-consumer.# INTERNAL/SASL_PLAIN port docker-compose exec kafka1 kafka-consumer-groups --list --bootstrap-server kafka1:9091 \ --command-config /etc/kafka/secrets/client_sasl_plain.config
Verify which users are configured to be super users.
docker-compose logs kafka1 | grep "super.users ="
Your output should resemble the following. Notice this authorizes each service name which authenticates as itself, as well as the unauthenticated
PLAINTEXTwhich authenticates asANONYMOUS(for demo purposes only):kafka1 | super.users = User:admin;User:mds;User:superUser;User:ANONYMOUS
Verify that LDAP user
appSA(which is not a super user) can consume messages from topicwikipedia.parsed. Notice that it is configured to authenticate to brokers with mTLS and authenticate to Schema Registry with LDAP.docker-compose exec connect kafka-avro-console-consumer --bootstrap-server kafka1:11091,kafka2:11092 \ --consumer-property security.protocol=SSL \ --consumer-property ssl.truststore.location=/etc/kafka/secrets/kafka.appSA.truststore.jks \ --consumer-property ssl.truststore.password=confluent \ --consumer-property ssl.keystore.location=/etc/kafka/secrets/kafka.appSA.keystore.jks \ --consumer-property ssl.keystore.password=confluent \ --consumer-property ssl.key.password=confluent \ --property schema.registry.url=https://schemaregistry:8085 \ --property schema.registry.ssl.truststore.location=/etc/kafka/secrets/kafka.appSA.truststore.jks \ --property schema.registry.ssl.truststore.password=confluent \ --property basic.auth.credentials.source=USER_INFO \ --property schema.registry.basic.auth.user.info=appSA:appSA \ --group wikipedia.test \ --topic wikipedia.parsed \ --max-messages 5
Verify that LDAP user
badappcannot consume messages from topicwikipedia.parsed.docker-compose exec connect kafka-avro-console-consumer --bootstrap-server kafka1:11091,kafka2:11092 \ --consumer-property security.protocol=SSL \ --consumer-property ssl.truststore.location=/etc/kafka/secrets/kafka.badapp.truststore.jks \ --consumer-property ssl.truststore.password=confluent \ --consumer-property ssl.keystore.location=/etc/kafka/secrets/kafka.badapp.keystore.jks \ --consumer-property ssl.keystore.password=confluent \ --consumer-property ssl.key.password=confluent \ --property schema.registry.url=https://schemaregistry:8085 \ --property schema.registry.ssl.truststore.location=/etc/kafka/secrets/kafka.badapp.truststore.jks \ --property schema.registry.ssl.truststore.password=confluent \ --property basic.auth.credentials.source=USER_INFO \ --property schema.registry.basic.auth.user.info=badapp:badapp \ --group wikipedia.test \ --topic wikipedia.parsed \ --max-messages 5
Your output should resemble:
ERROR [Consumer clientId=consumer-wikipedia.test-1, groupId=wikipedia.test] Topic authorization failed for topics [wikipedia.parsed]
org.apache.kafka.common.errors.TopicAuthorizationException: Not authorized to access topics: [wikipedia.parsed]
Add a role binding that permits
badappclient to consume from topicwikipedia.parsedand its related subject in Schema Registry.# First get the KAFKA_CLUSTER_ID KAFKA_CLUSTER_ID=$(curl -s http://localhost:8091/v1/metadata/id | jq -r ".id") # Then create the role binding for the topic ``wikipedia.parsed`` docker-compose exec tools bash -c "confluent iam rolebinding create \ --principal User:badapp \ --role ResourceOwner \ --resource Topic:wikipedia.parsed \ --kafka-cluster-id $KAFKA_CLUSTER_ID" # Then create the role binding for the group ``wikipedia.test`` docker-compose exec tools bash -c "confluent iam rolebinding create \ --principal User:badapp \ --role ResourceOwner \ --resource Group:wikipedia.test \ --kafka-cluster-id $KAFKA_CLUSTER_ID" # Then create the role binding for the subject ``wikipedia.parsed-value``, i.e., the topic-value (versus the topic-key) docker-compose exec tools bash -c "confluent iam rolebinding create \ --principal User:badapp \ --role ResourceOwner \ --resource Subject:wikipedia.parsed-value \ --kafka-cluster-id $KAFKA_CLUSTER_ID \ --schema-registry-cluster-id schema-registry"
Verify that LDAP user
badappnow can consume messages from topicwikipedia.parsed.docker-compose exec connect kafka-avro-console-consumer --bootstrap-server kafka1:11091,kafka2:11092 \ --consumer-property security.protocol=SSL \ --consumer-property ssl.truststore.location=/etc/kafka/secrets/kafka.badapp.truststore.jks \ --consumer-property ssl.truststore.password=confluent \ --consumer-property ssl.keystore.location=/etc/kafka/secrets/kafka.badapp.keystore.jks \ --consumer-property ssl.keystore.password=confluent \ --consumer-property ssl.key.password=confluent \ --property schema.registry.url=https://schemaregistry:8085 \ --property schema.registry.ssl.truststore.location=/etc/kafka/secrets/kafka.badapp.truststore.jks \ --property schema.registry.ssl.truststore.password=confluent \ --property basic.auth.credentials.source=USER_INFO \ --property schema.registry.basic.auth.user.info=badapp:badapp \ --group wikipedia.test \ --topic wikipedia.parsed \ --max-messages 5
View all the role bindings that were configured for RBAC in this cluster.
cd scripts/validate
./validate_bindings.sh
Because ZooKeeper is configured for SASL/DIGEST-MD5, any commands that communicate with ZooKeeper need properties set for ZooKeeper authentication. This authentication configuration is provided by the
KAFKA_OPTSsetting on the brokers. For example, notice that the throttle script runs on the Docker containerkafka1which has the appropriate KAFKA_OPTS setting. The command would otherwise fail if run on any other container aside fromkafka1orkafka2.Next step: Learn more about security with the Security Tutorial.
Data Governance with Schema Registry
All the applications and connectors used in this example are configured to automatically read and write Avro-formatted data, leveraging the Confluent Schema Registry .
The security in place between Schema Registry and the end clients, e.g. appSA, is as follows:
- Encryption: TLS, e.g. client has
schema.registry.ssl.truststore.*configurations - Authentication: bearer token authentication from HTTP basic auth headers, e.g. client has
schema.registry.basic.auth.user.infoandbasic.auth.credentials.sourceconfigurations - Authorization: Schema Registry uses the bearer token with RBAC to authorize the client
View the Schema Registry subjects for topics that have registered schemas for their keys and/or values. Notice the
curlarguments include (a) TLS information required to interact with Schema Registry which is listening for HTTPS on port 8085, and (b) authentication credentials required for RBAC (using superUser:superUser to see all of them).docker-compose exec schemaregistry curl -X GET --cert /etc/kafka/secrets/schemaregistry.certificate.pem --key /etc/kafka/secrets/schemaregistry.key --tlsv1.2 --cacert /etc/kafka/secrets/snakeoil-ca-1.crt -u superUser:superUser https://schemaregistry:8085/subjects | jq .
Your output should resemble:
 [
   "wikipedia.parsed.replica-value",
   "EN_WIKIPEDIA_GT_1_COUNTS-value",
   "WIKIPEDIABOT-value",
   "_confluent-ksql-ksql-clusterquery_CTAS_EN_WIKIPEDIA_GT_1_4-Aggregate-aggregate-changelog-value",
   "EN_WIKIPEDIA_GT_1-value",
   "wikipedia.parsed.count-by-channel-value",
   "_confluent-ksql-ksql-clusterquery_CTAS_EN_WIKIPEDIA_GT_1_4-Aggregate-groupby-repartition-value",
   "WIKIPEDIANOBOT-value",
   "wikipedia.parsed-value"
]
Instead of using the superUser credentials, now use client credentials noexist:noexist (user does not exist in LDAP) to try to register a new Avro schema (a record with two fields
usernameanduserid) into Schema Registry for the value of a new topicusers. It should fail due to an authorization error.docker-compose exec schemaregistry curl -X POST -H "Content-Type: application/vnd.schemaregistry.v1+json" --cert /etc/kafka/secrets/schemaregistry.certificate.pem --key /etc/kafka/secrets/schemaregistry.key --tlsv1.2 --cacert /etc/kafka/secrets/snakeoil-ca-1.crt --data '{ "schema": "[ { \"type\":\"record\", \"name\":\"user\", \"fields\": [ {\"name\":\"userid\",\"type\":\"long\"}, {\"name\":\"username\",\"type\":\"string\"} ]} ]" }' -u noexist:noexist https://schemaregistry:8085/subjects/users-value/versions
Your output should resemble:
{"error_code":401,"message":"Unauthorized"}
Instead of using credentials for a user that does not exist, now use the client credentials appSA:appSA (the user appSA exists in LDAP) to try to register a new Avro schema (a record with two fields
usernameanduserid) into Schema Registry for the value of a new topicusers. It should fail due to an authorization error, with a different message than above.docker-compose exec schemaregistry curl -X POST -H "Content-Type: application/vnd.schemaregistry.v1+json" --cert /etc/kafka/secrets/schemaregistry.certificate.pem --key /etc/kafka/secrets/schemaregistry.key --tlsv1.2 --cacert /etc/kafka/secrets/snakeoil-ca-1.crt --data '{ "schema": "[ { \"type\":\"record\", \"name\":\"user\", \"fields\": [ {\"name\":\"userid\",\"type\":\"long\"}, {\"name\":\"username\",\"type\":\"string\"} ]} ]" }' -u appSA:appSA https://schemaregistry:8085/subjects/users-value/versions
Your output should resemble:
{"error_code":40403,"message":"User is denied operation Write on Subject: users-value"}
Create a role binding for the
appSAclient permitting it access to Schema Registry.# First get the KAFKA_CLUSTER_ID KAFKA_CLUSTER_ID=$(curl -s http://localhost:8091/v1/metadata/id | jq -r ".id") # Then create the role binding for the subject ``users-value``, i.e., the topic-value (versus the topic-key) docker-compose exec tools bash -c "confluent iam rolebinding create \ --principal User:appSA \ --role ResourceOwner \ --resource Subject:users-value \ --kafka-cluster-id $KAFKA_CLUSTER_ID \ --schema-registry-cluster-id schema-registry"
Again try to register the schema. It should pass this time. Note the schema id that it returns, e.g. below schema id is
7.docker-compose exec schemaregistry curl -X POST -H "Content-Type: application/vnd.schemaregistry.v1+json" --cert /etc/kafka/secrets/schemaregistry.certificate.pem --key /etc/kafka/secrets/schemaregistry.key --tlsv1.2 --cacert /etc/kafka/secrets/snakeoil-ca-1.crt --data '{ "schema": "[ { \"type\":\"record\", \"name\":\"user\", \"fields\": [ {\"name\":\"userid\",\"type\":\"long\"}, {\"name\":\"username\",\"type\":\"string\"} ]} ]" }' -u appSA:appSA https://schemaregistry:8085/subjects/users-value/versions
Your output should resemble:
{"id":7}
View the new schema for the subject
users-value. From Confluent Control Center, click Topics. Scroll down to and click on the topic users and select “SCHEMA”.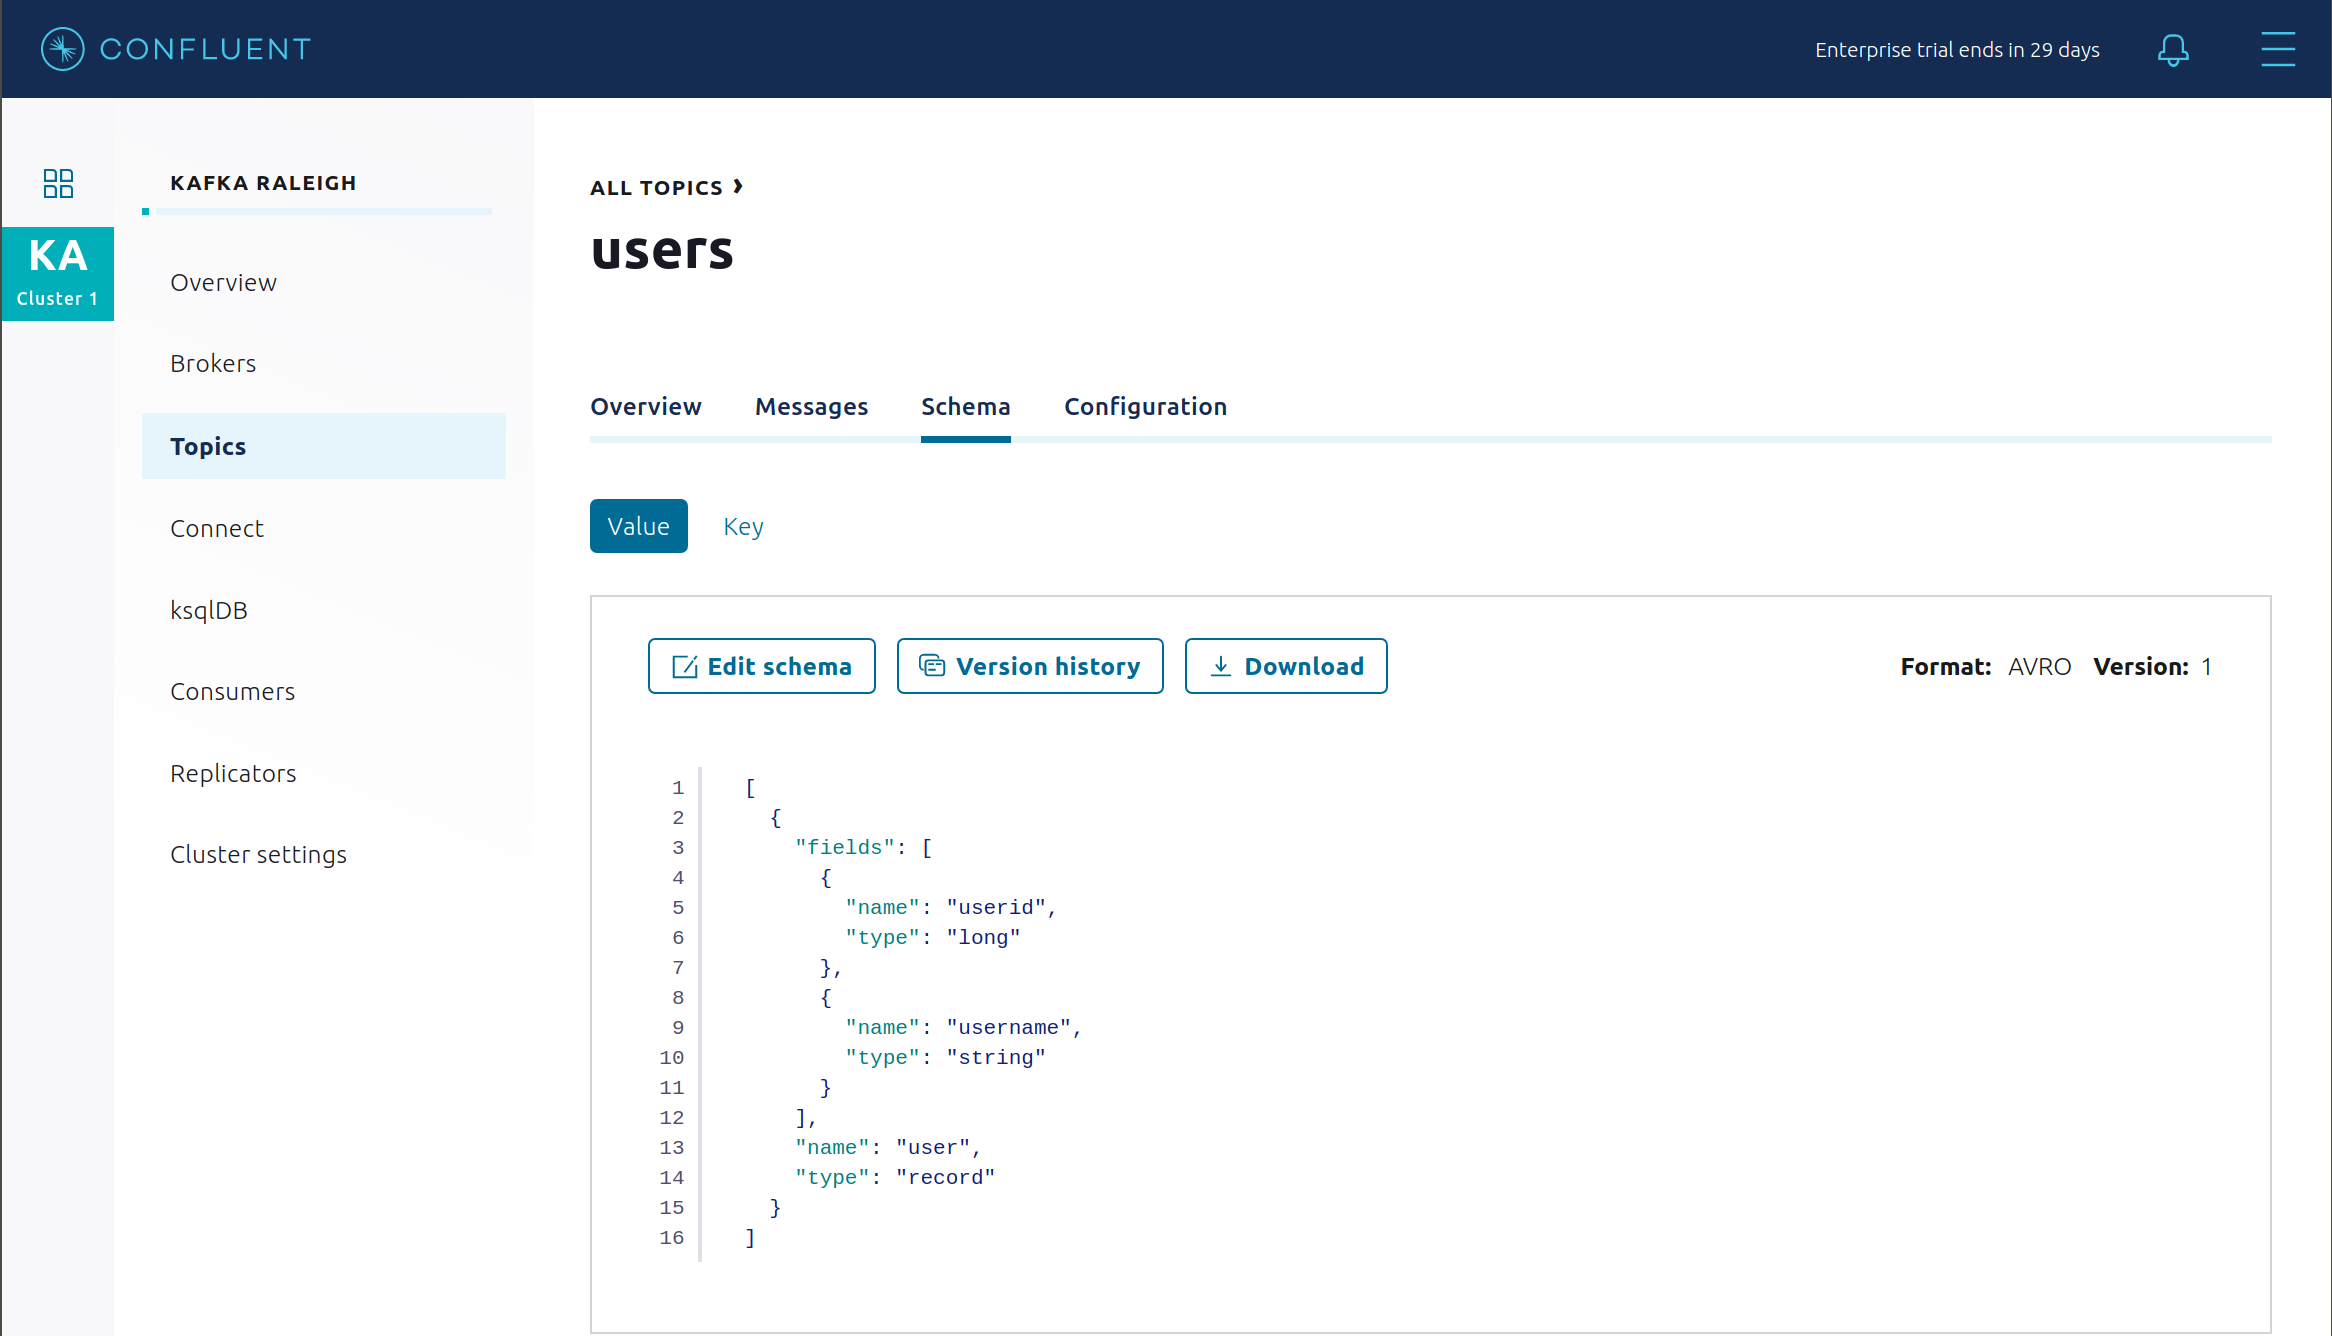
You may alternatively request the schema via the command line:
docker-compose exec schemaregistry curl -X GET --cert /etc/kafka/secrets/schemaregistry.certificate.pem --key /etc/kafka/secrets/schemaregistry.key --tlsv1.2 --cacert /etc/kafka/secrets/snakeoil-ca-1.crt -u appSA:appSA https://schemaregistry:8085/subjects/users-value/versions/1 | jq .
Your output should resemble:
{
  "subject": "users-value",
  "version": 1,
  "id": 7,
  "schema": "{\"type\":\"record\",\"name\":\"user\",\"fields\":[{\"name\":\"username\",\"type\":\"string\"},{\"name\":\"userid\",\"type\":\"long\"}]}"
}
Describe the topic
users. Notice that it has a special configurationconfluent.value.schema.validation=truewhich enables Schema Validation, a data governance feature in Confluent Server that gives operators a centralized location within the Kafka cluster itself to enforce data format correctness. Enabling Schema Validation allows brokers configured withconfluent.schema.registry.urlto validate that data produced to the topic is using a valid schema.docker-compose exec kafka1 kafka-topics --describe --topic users --bootstrap-server kafka1:9091 --command-config /etc/kafka/secrets/client_sasl_plain.config
Your output should resemble:
Topic: users      PartitionCount: 2       ReplicationFactor: 2    Configs: confluent.value.schema.validation=true
        Topic: users      Partition: 0    Leader: 1       Replicas: 1,2   Isr: 1,2        Offline:        LiveObservers:
        Topic: users      Partition: 1    Leader: 2       Replicas: 2,1   Isr: 2,1        Offline:        LiveObservers:
Produce a non-Avro message to this topic using
kafka-console-producer, and it will result in a failure.docker-compose exec connect kafka-console-producer --topic users --broker-list kafka1:11091 \ --producer-property security.protocol=SSL \ --producer-property ssl.truststore.location=/etc/kafka/secrets/kafka.appSA.truststore.jks \ --producer-property ssl.truststore.password=confluent \ --producer-property ssl.keystore.location=/etc/kafka/secrets/kafka.appSA.keystore.jks \ --producer-property ssl.keystore.password=confluent \ --producer-property ssl.key.password=confluent
The error should resemble:
ERROR Error when sending message to topic users with key: null, value: 5 bytes with error: (org.apache.kafka.clients.producer.internals.ErrorLoggingCallback)
org.apache.kafka.common.InvalidRecordException: This record has failed the validation on broker and hence be rejected.
Describe the topic
wikipedia.parsed, which is the topic that the kafka-connect-irc source connector is writing to. Notice that it also has enabled Schema Validation.docker-compose exec kafka1 kafka-topics --describe --topic wikipedia.parsed --bootstrap-server kafka1:9091 --command-config /etc/kafka/secrets/client_sasl_plain.config
Describe the topic
wikipedia.parsed.replica, which is the topic that Replicator has replicated fromwikipedia.parsed. Notice that it also has enabled Schema Validation, because Replicator default istopic.config.sync=true(see Replicator documentation).docker-compose exec kafka1 kafka-topics --describe --topic wikipedia.parsed.replica --bootstrap-server kafka1:9091 --command-config /etc/kafka/secrets/client_sasl_plain.config
Next step: Learn more about Schema Registry with the Schema Registry Tutorial.
Confluent REST Proxy
The Confluent REST Proxy is running for optional client access.
Use the REST Proxy, which is listening for HTTPS on port 8086, to try to produce a message to the topic
users, referencing schema id7. This schema was registered in Schema Registry in the previous section. It should fail due to an authorization error.docker-compose exec restproxy curl -X POST -H "Content-Type: application/vnd.kafka.avro.v2+json" -H "Accept: application/vnd.kafka.v2+json" --cert /etc/kafka/secrets/restproxy.certificate.pem --key /etc/kafka/secrets/restproxy.key --tlsv1.2 --cacert /etc/kafka/secrets/snakeoil-ca-1.crt --data '{"value_schema_id": 7, "records": [{"value": {"user":{"userid": 1, "username": "Bunny Smith"}}}]}' -u appSA:appSA https://restproxy:8086/topics/users
Your output should resemble:
{"offsets":[{"partition":null,"offset":null,"error_code":40301,"error":"Not authorized to access topics: [users]"}],"key_schema_id":null,"value_schema_id":7}
Create a role binding for the client permitting it produce to the topic
users.# First get the KAFKA_CLUSTER_ID KAFKA_CLUSTER_ID=$(curl -s http://localhost:8091/v1/metadata/id | jq -r ".id") # Then create the role binding for the topic ``users`` docker-compose exec tools bash -c "confluent iam rolebinding create \ --principal User:appSA \ --role DeveloperWrite \ --resource Topic:users \ --kafka-cluster-id $KAFKA_CLUSTER_ID"
Again try to produce a message to the topic
users. It should pass this time.docker-compose exec restproxy curl -X POST -H "Content-Type: application/vnd.kafka.avro.v2+json" -H "Accept: application/vnd.kafka.v2+json" --cert /etc/kafka/secrets/restproxy.certificate.pem --key /etc/kafka/secrets/restproxy.key --tlsv1.2 --cacert /etc/kafka/secrets/snakeoil-ca-1.crt --data '{"value_schema_id": 7, "records": [{"value": {"user":{"userid": 1, "username": "Bunny Smith"}}}]}' -u appSA:appSA https://restproxy:8086/topics/users
Your output should resemble:
{"offsets":[{"partition":1,"offset":0,"error_code":null,"error":null}],"key_schema_id":null,"value_schema_id":7}
Create consumer instance
my_avro_consumer.docker-compose exec restproxy curl -X POST -H "Content-Type: application/vnd.kafka.v2+json" --cert /etc/kafka/secrets/restproxy.certificate.pem --key /etc/kafka/secrets/restproxy.key --tlsv1.2 --cacert /etc/kafka/secrets/snakeoil-ca-1.crt --data '{"name": "my_consumer_instance", "format": "avro", "auto.offset.reset": "earliest"}' -u appSA:appSA https://restproxy:8086/consumers/my_avro_consumer
Your output should resemble:
{"instance_id":"my_consumer_instance","base_uri":"https://restproxy:8086/consumers/my_avro_consumer/instances/my_consumer_instance"}
Subscribe
my_avro_consumerto theuserstopic.docker-compose exec restproxy curl -X POST -H "Content-Type: application/vnd.kafka.v2+json" --cert /etc/kafka/secrets/restproxy.certificate.pem --key /etc/kafka/secrets/restproxy.key --tlsv1.2 --cacert /etc/kafka/secrets/snakeoil-ca-1.crt --data '{"topics":["users"]}' -u appSA:appSA https://restproxy:8086/consumers/my_avro_consumer/instances/my_consumer_instance/subscription
Try to consume messages for
my_avro_consumersubscriptions. It should fail due to an authorization error.docker-compose exec restproxy curl -X GET -H "Accept: application/vnd.kafka.avro.v2+json" --cert /etc/kafka/secrets/restproxy.certificate.pem --key /etc/kafka/secrets/restproxy.key --tlsv1.2 --cacert /etc/kafka/secrets/snakeoil-ca-1.crt -u appSA:appSA https://restproxy:8086/consumers/my_avro_consumer/instances/my_consumer_instance/records
Your output should resemble:
{"error_code":40301,"message":"Not authorized to access group: my_avro_consumer"}
Create a role binding for the client permitting it access to the consumer group
my_avro_consumer.# First get the KAFKA_CLUSTER_ID KAFKA_CLUSTER_ID=$(curl -s http://localhost:8091/v1/metadata/id | jq -r ".id") # Then create the role binding for the group ``my_avro_consumer`` docker-compose exec tools bash -c "confluent iam rolebinding create \ --principal User:appSA \ --role ResourceOwner \ --resource Group:my_avro_consumer \ --kafka-cluster-id $KAFKA_CLUSTER_ID"
Again try to consume messages for
my_avro_consumersubscriptions. It should fail due to a different authorization error.# Note: Issue this command twice due to https://github.com/confluentinc/kafka-rest/issues/432 docker-compose exec restproxy curl -X GET -H "Accept: application/vnd.kafka.avro.v2+json" --cert /etc/kafka/secrets/restproxy.certificate.pem --key /etc/kafka/secrets/restproxy.key --tlsv1.2 --cacert /etc/kafka/secrets/snakeoil-ca-1.crt -u appSA:appSA https://restproxy:8086/consumers/my_avro_consumer/instances/my_consumer_instance/records docker-compose exec restproxy curl -X GET -H "Accept: application/vnd.kafka.avro.v2+json" --cert /etc/kafka/secrets/restproxy.certificate.pem --key /etc/kafka/secrets/restproxy.key --tlsv1.2 --cacert /etc/kafka/secrets/snakeoil-ca-1.crt -u appSA:appSA https://restproxy:8086/consumers/my_avro_consumer/instances/my_consumer_instance/records
Your output should resemble:
{"error_code":40301,"message":"Not authorized to access topics: [users]"}
Create a role binding for the client permitting it access to the topic
users.# First get the KAFKA_CLUSTER_ID KAFKA_CLUSTER_ID=$(curl -s http://localhost:8091/v1/metadata/id | jq -r ".id") # Then create the role binding for the group my_avro_consumer docker-compose exec tools bash -c "confluent iam rolebinding create \ --principal User:appSA \ --role DeveloperRead \ --resource Topic:users \ --kafka-cluster-id $KAFKA_CLUSTER_ID"
Again try to consume messages for
my_avro_consumersubscriptions. It should pass this time.# Note: Issue this command twice due to https://github.com/confluentinc/kafka-rest/issues/432 docker-compose exec restproxy curl -X GET -H "Accept: application/vnd.kafka.avro.v2+json" --cert /etc/kafka/secrets/restproxy.certificate.pem --key /etc/kafka/secrets/restproxy.key --tlsv1.2 --cacert /etc/kafka/secrets/snakeoil-ca-1.crt -u appSA:appSA https://restproxy:8086/consumers/my_avro_consumer/instances/my_consumer_instance/records docker-compose exec restproxy curl -X GET -H "Accept: application/vnd.kafka.avro.v2+json" --cert /etc/kafka/secrets/restproxy.certificate.pem --key /etc/kafka/secrets/restproxy.key --tlsv1.2 --cacert /etc/kafka/secrets/snakeoil-ca-1.crt -u appSA:appSA https://restproxy:8086/consumers/my_avro_consumer/instances/my_consumer_instance/records Your output should resemble:
[{"topic":"users","key":null,"value":{"userid":1,"username":"Bunny Smith"},"partition":1,"offset":0}]
Delete the consumer instance
my_avro_consumer.docker-compose exec restproxy curl -X DELETE -H "Content-Type: application/vnd.kafka.v2+json" --cert /etc/kafka/secrets/restproxy.certificate.pem --key /etc/kafka/secrets/restproxy.key --tlsv1.2 --cacert /etc/kafka/secrets/snakeoil-ca-1.crt -u appSA:appSA https://restproxy:8086/consumers/my_avro_consumer/instances/my_consumer_instance
Failed Broker
To simulate a failed broker, stop the Docker container running one of the two Kafka brokers.
Stop the Docker container running Kafka broker 2.
docker-compose stop kafka2
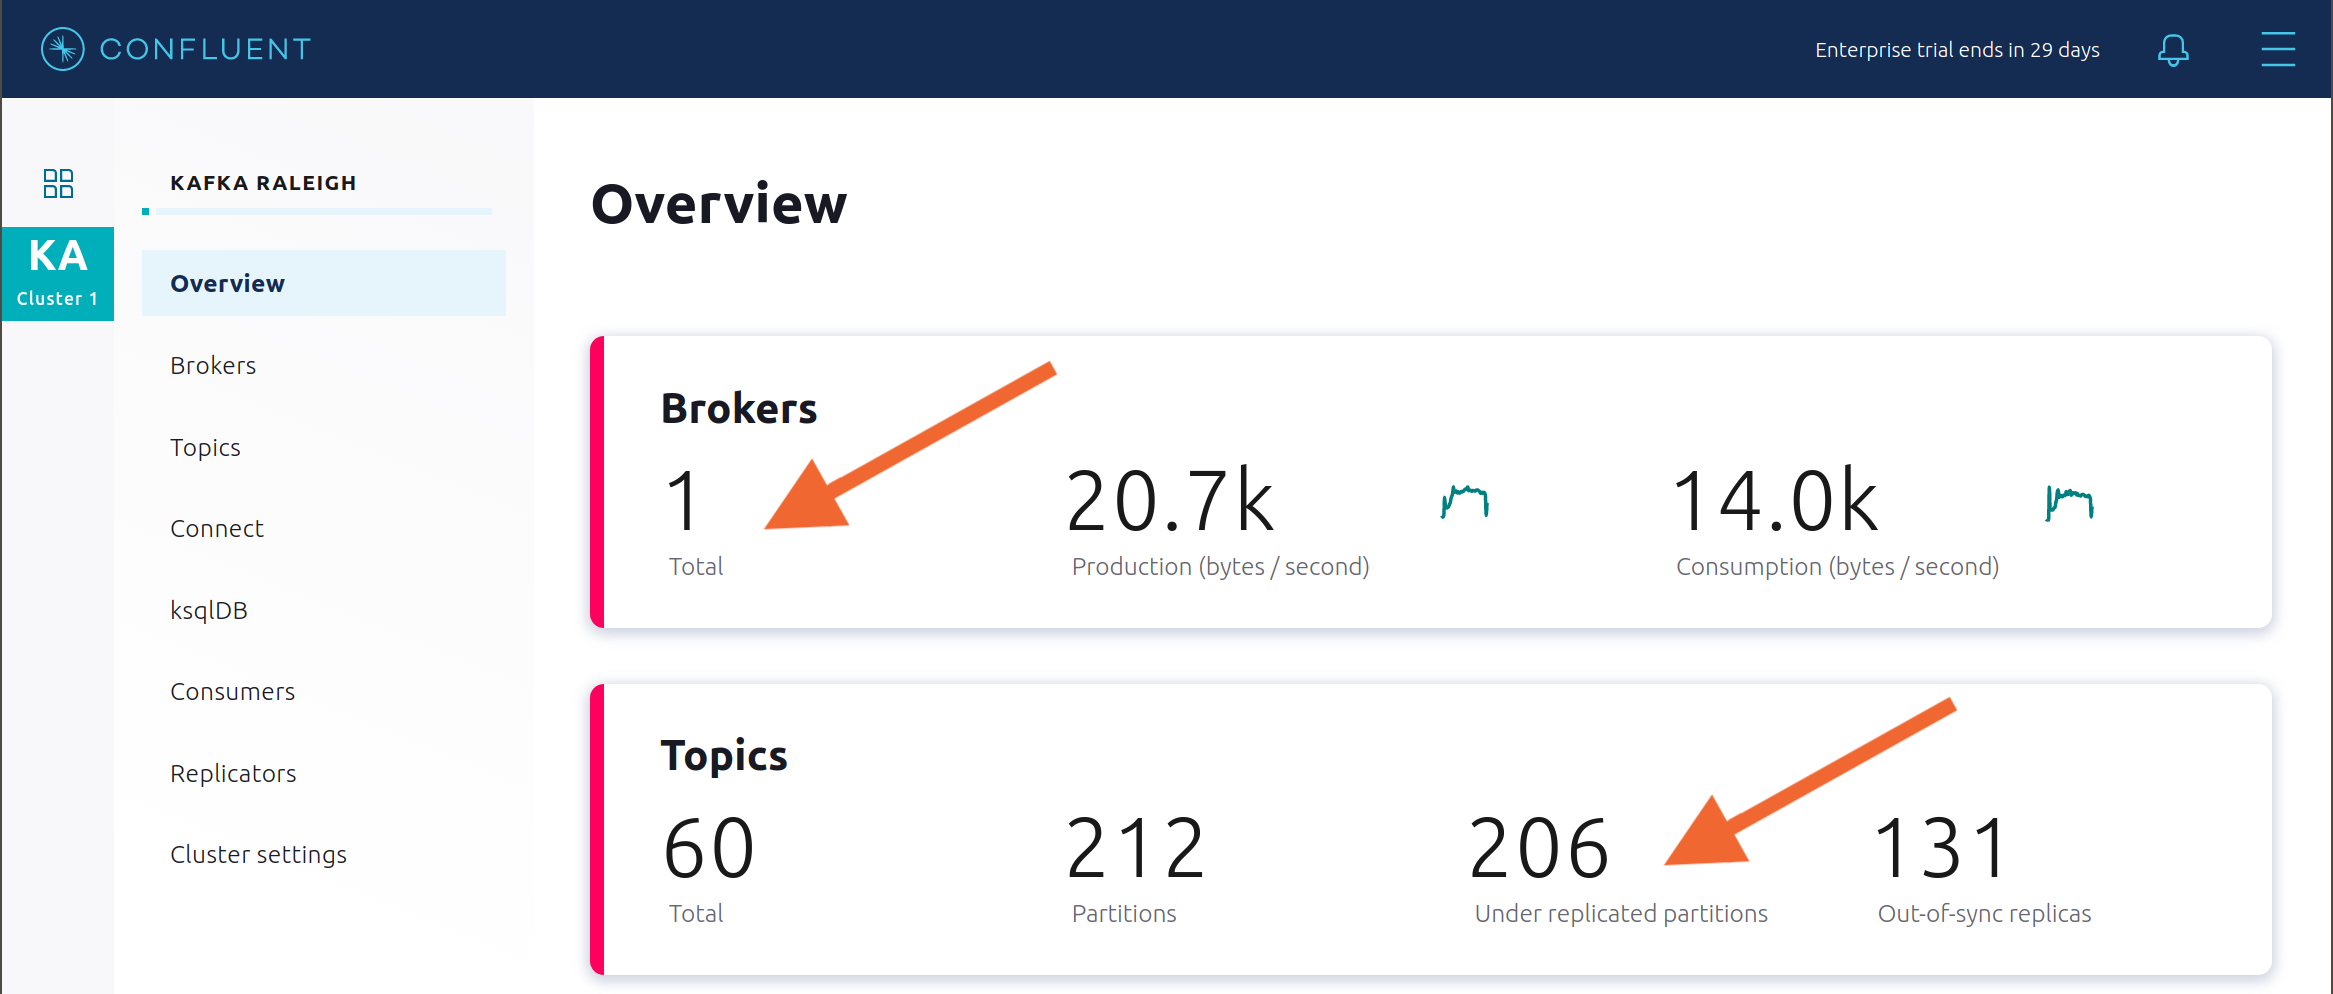
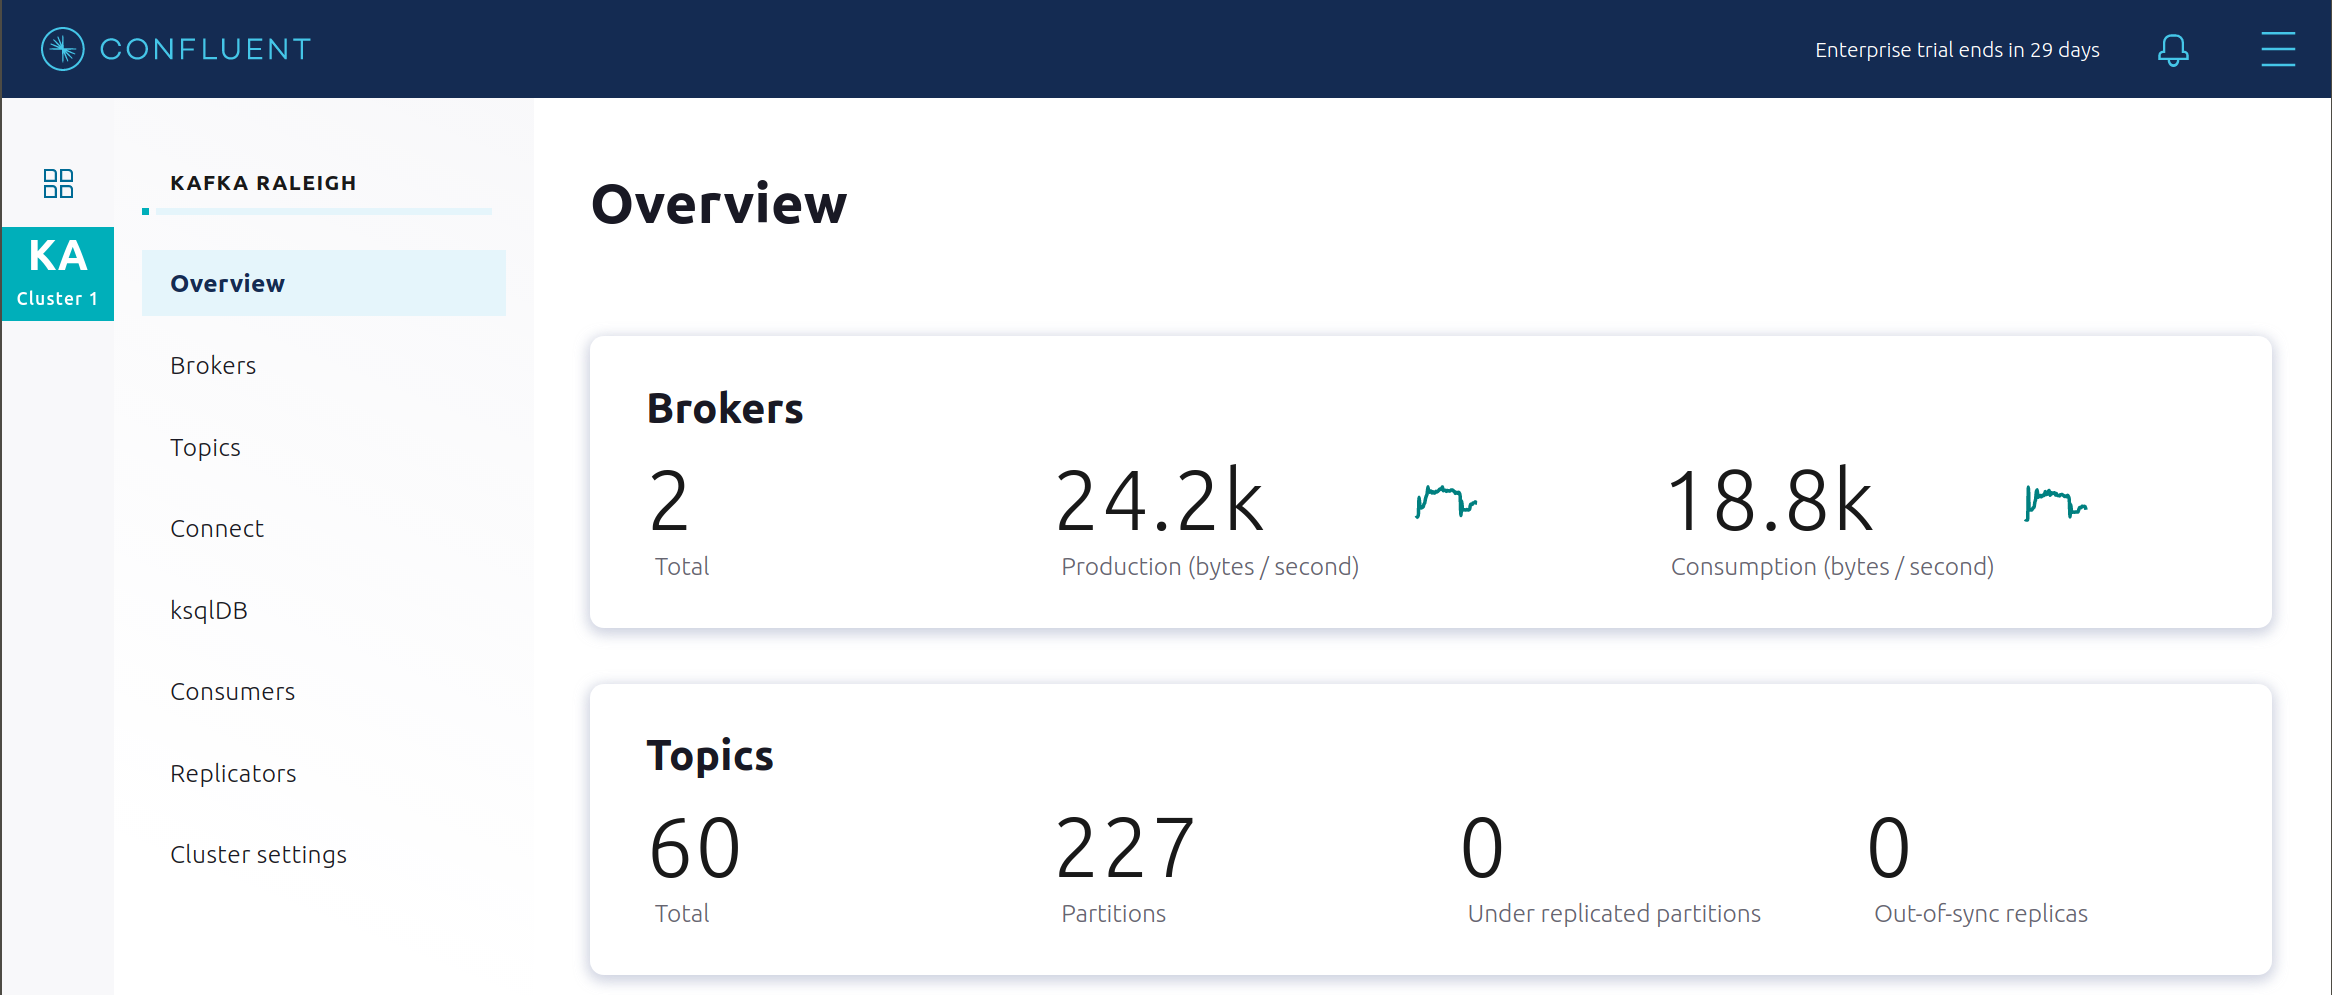
After a few minutes, observe the Broker summary show that the number of brokers has decreased from 2 to 1, and there are many under replicated partitions.
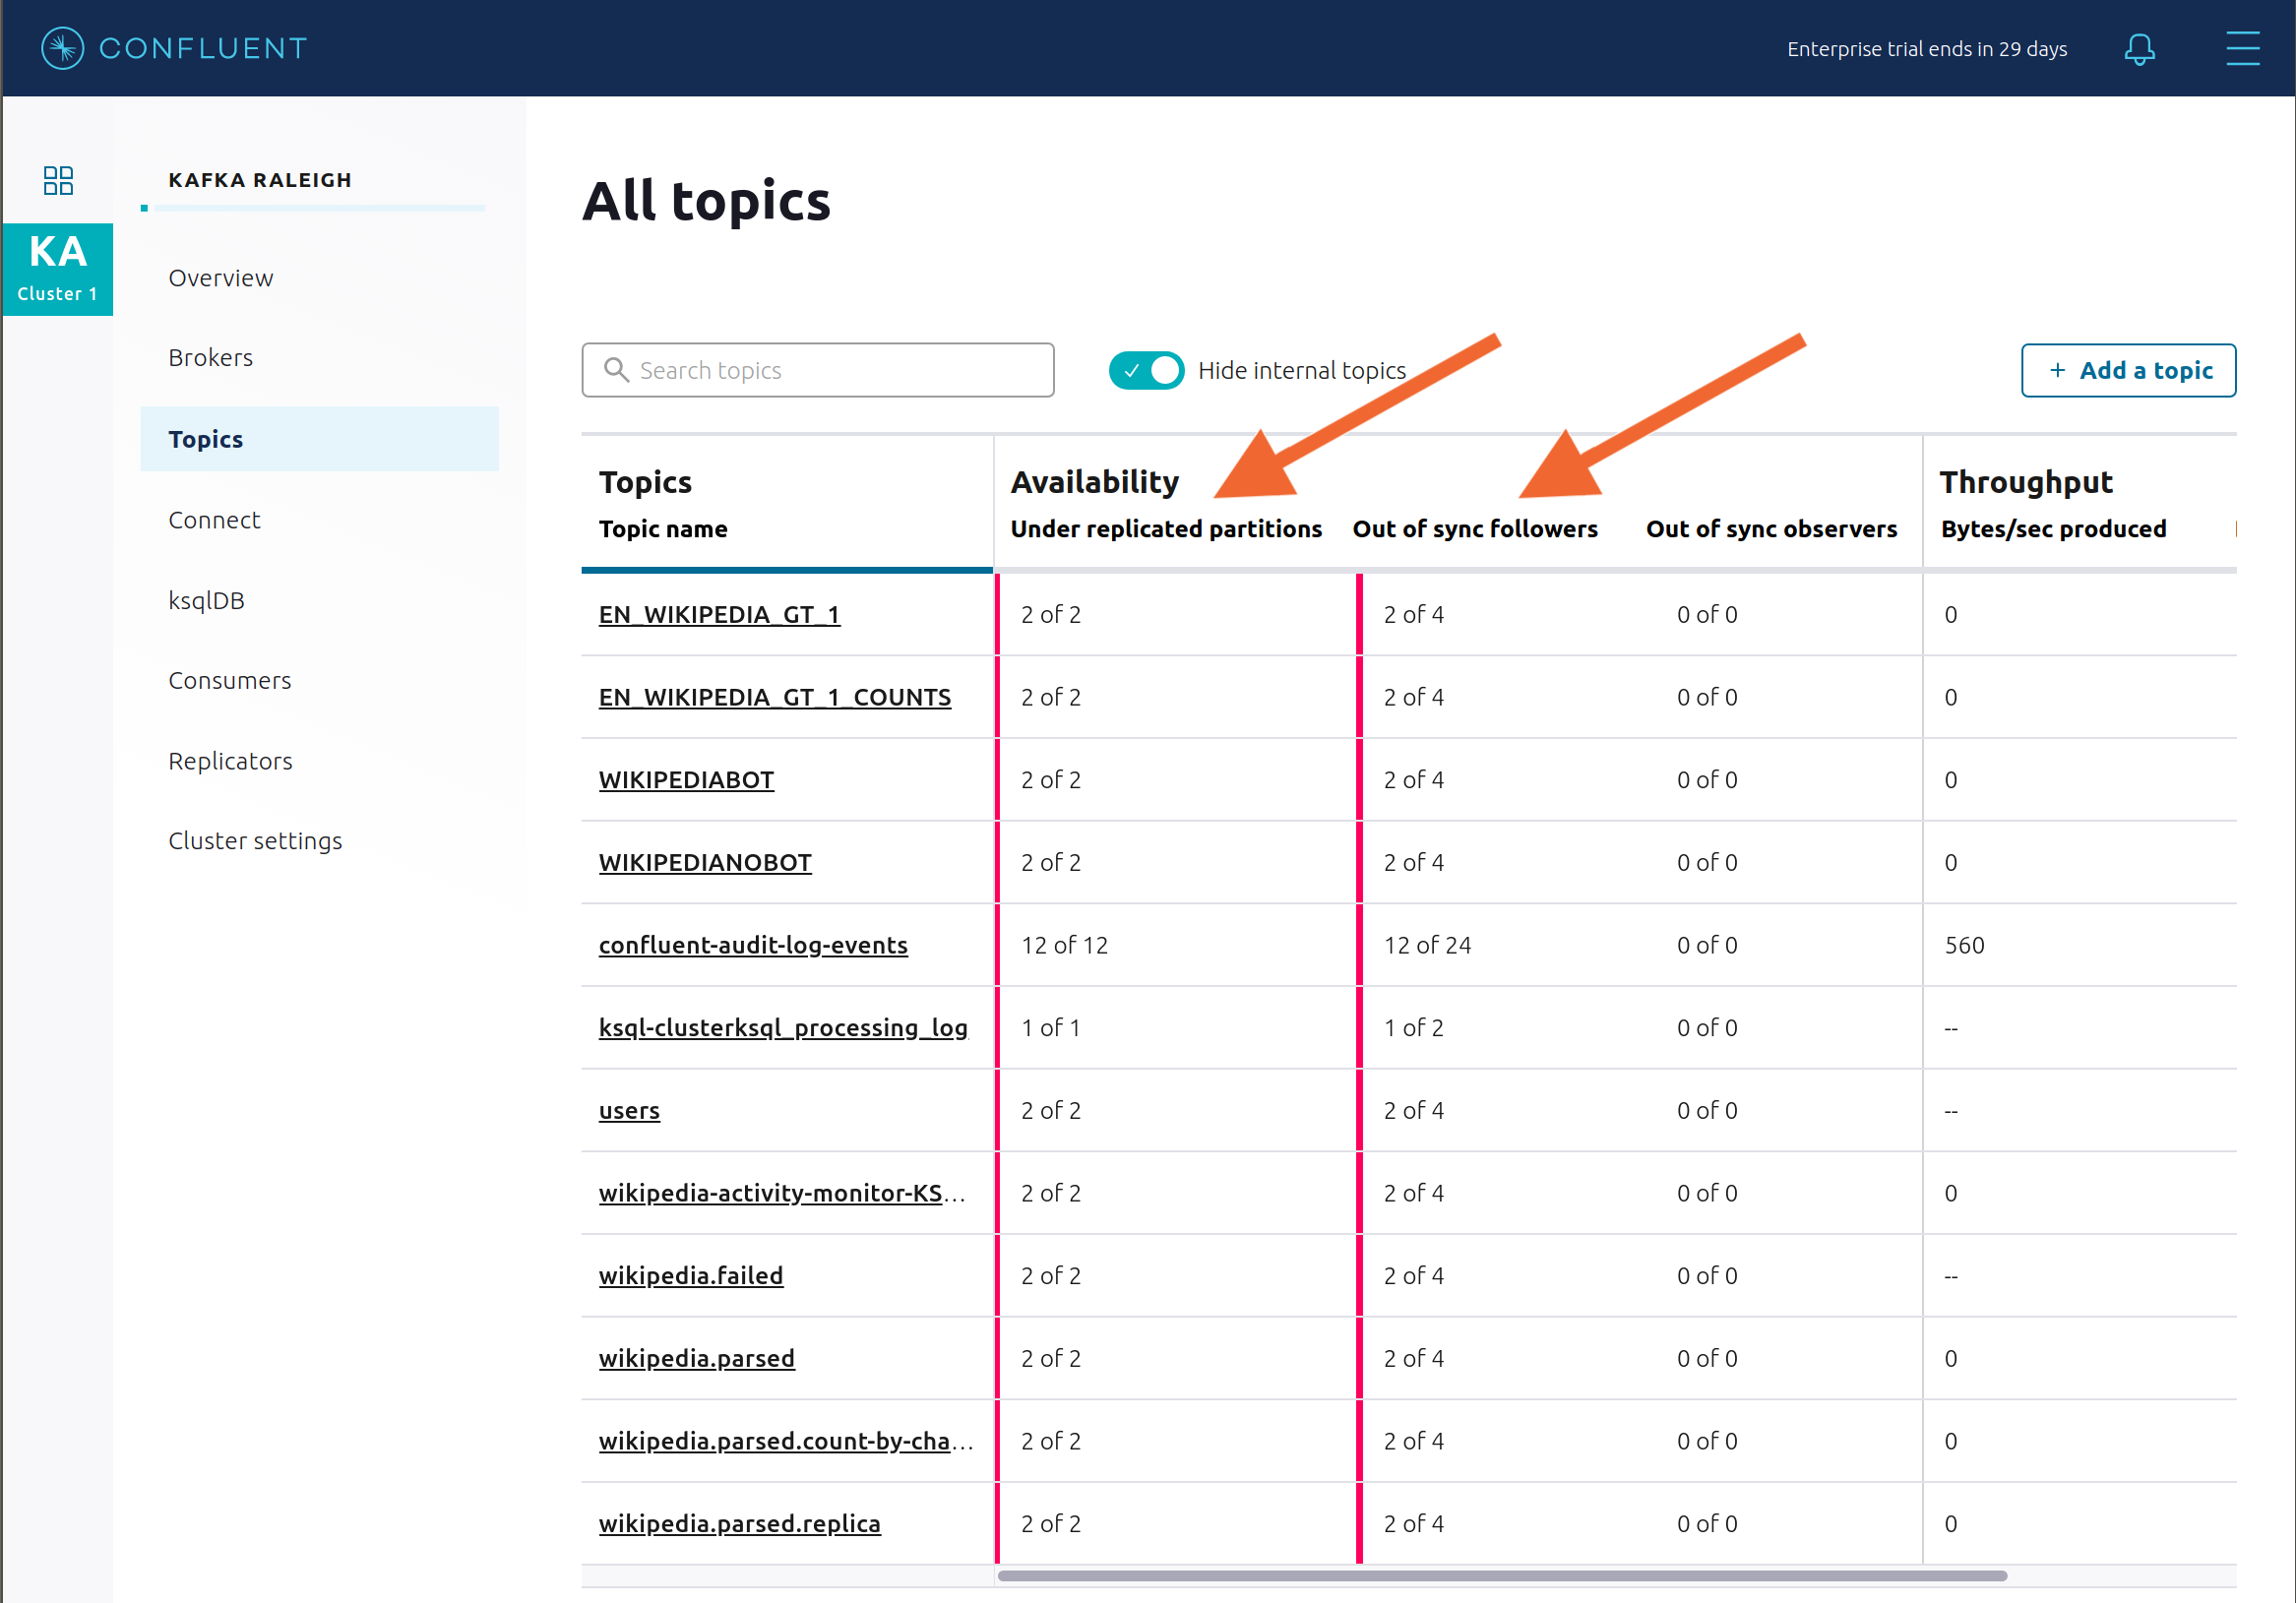
View Topic information details to see that there are out of sync replicas on broker 2.
Look at the production and consumption metrics and notice that the clients are all still working.
Restart the Docker container running Kafka broker 2.
docker-compose start kafka2
After about a minute, observe the Broker summary in Confluent Control Center. The broker count has recovered to 2, and the topic partitions are back to reporting no under replicated partitions.
Click on the broker count
2inside the “Brokers” box and when the “Brokers overview” pane appears, click inside the “Partitioning and replication” box to view when broker counts changed.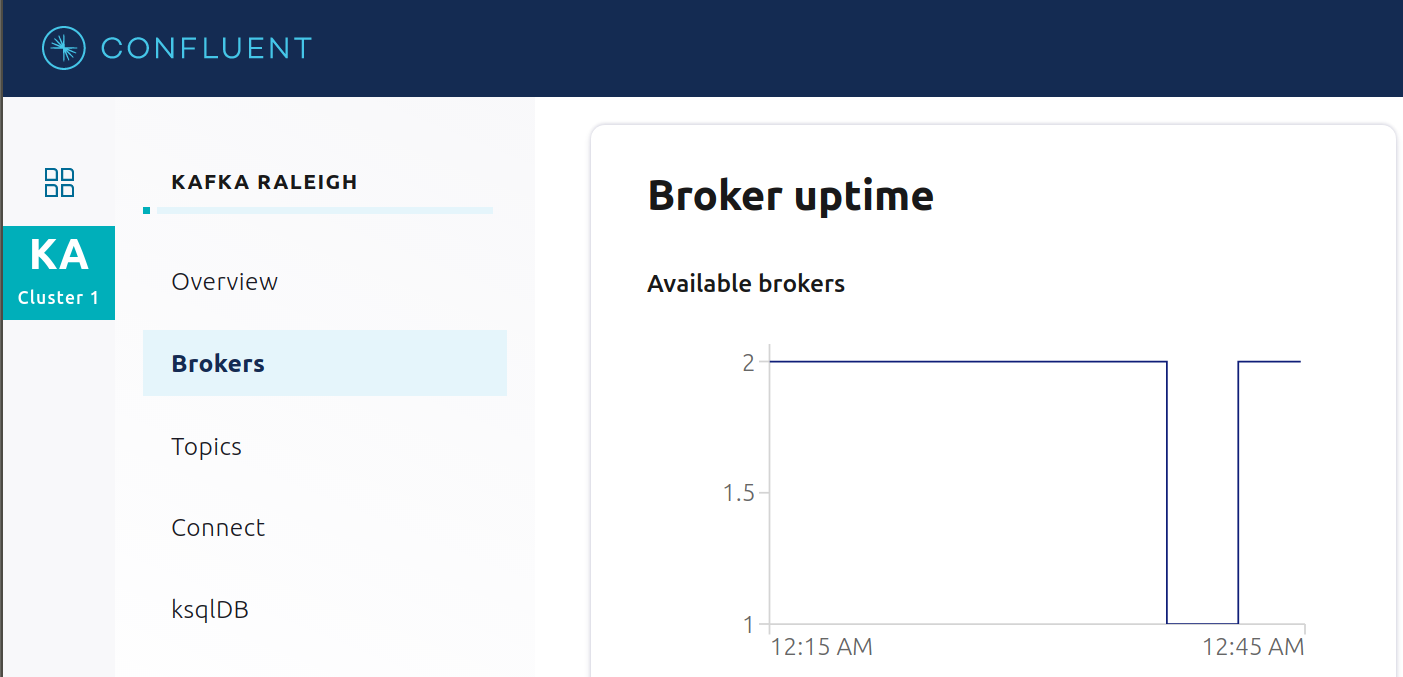
Alerting
There are many types of Control Center alerts and many ways to configure them. Use the Alerts management page to define triggers and actions, or click on individual resources to setup alerts from there.
This example already has pre-configured triggers and actions. View the Alerts
Triggersscreen, and clickEditagainst each trigger to see configuration details.- The trigger
Under Replicated Partitionshappens when a broker reports non-zero under replicated partitions, and it causes an actionEmail Administrator. - The trigger
Consumption Differencehappens when consumption difference for the Elasticsearch connector consumer group is greater than0, and it causes an actionEmail Administrator.
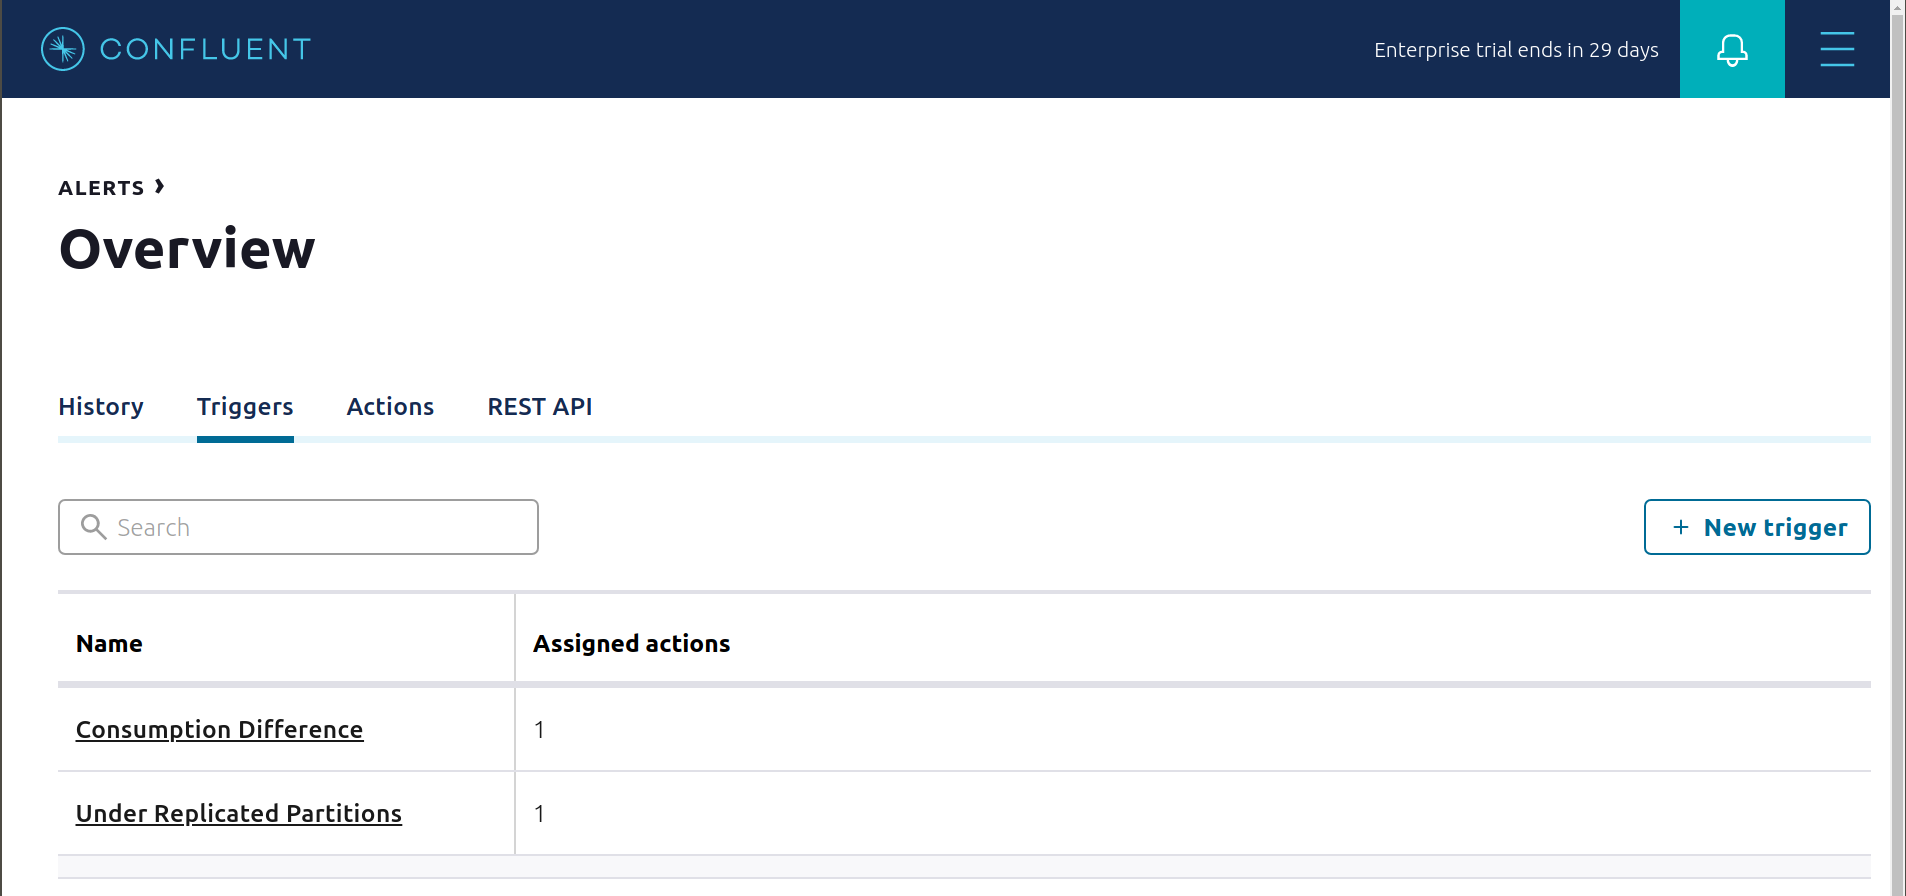
- The trigger
If you followed the steps in the failed broker section, view the Alert history to see that the trigger
Under Replicated Partitionshappened and caused an alert when you stopped broker 2.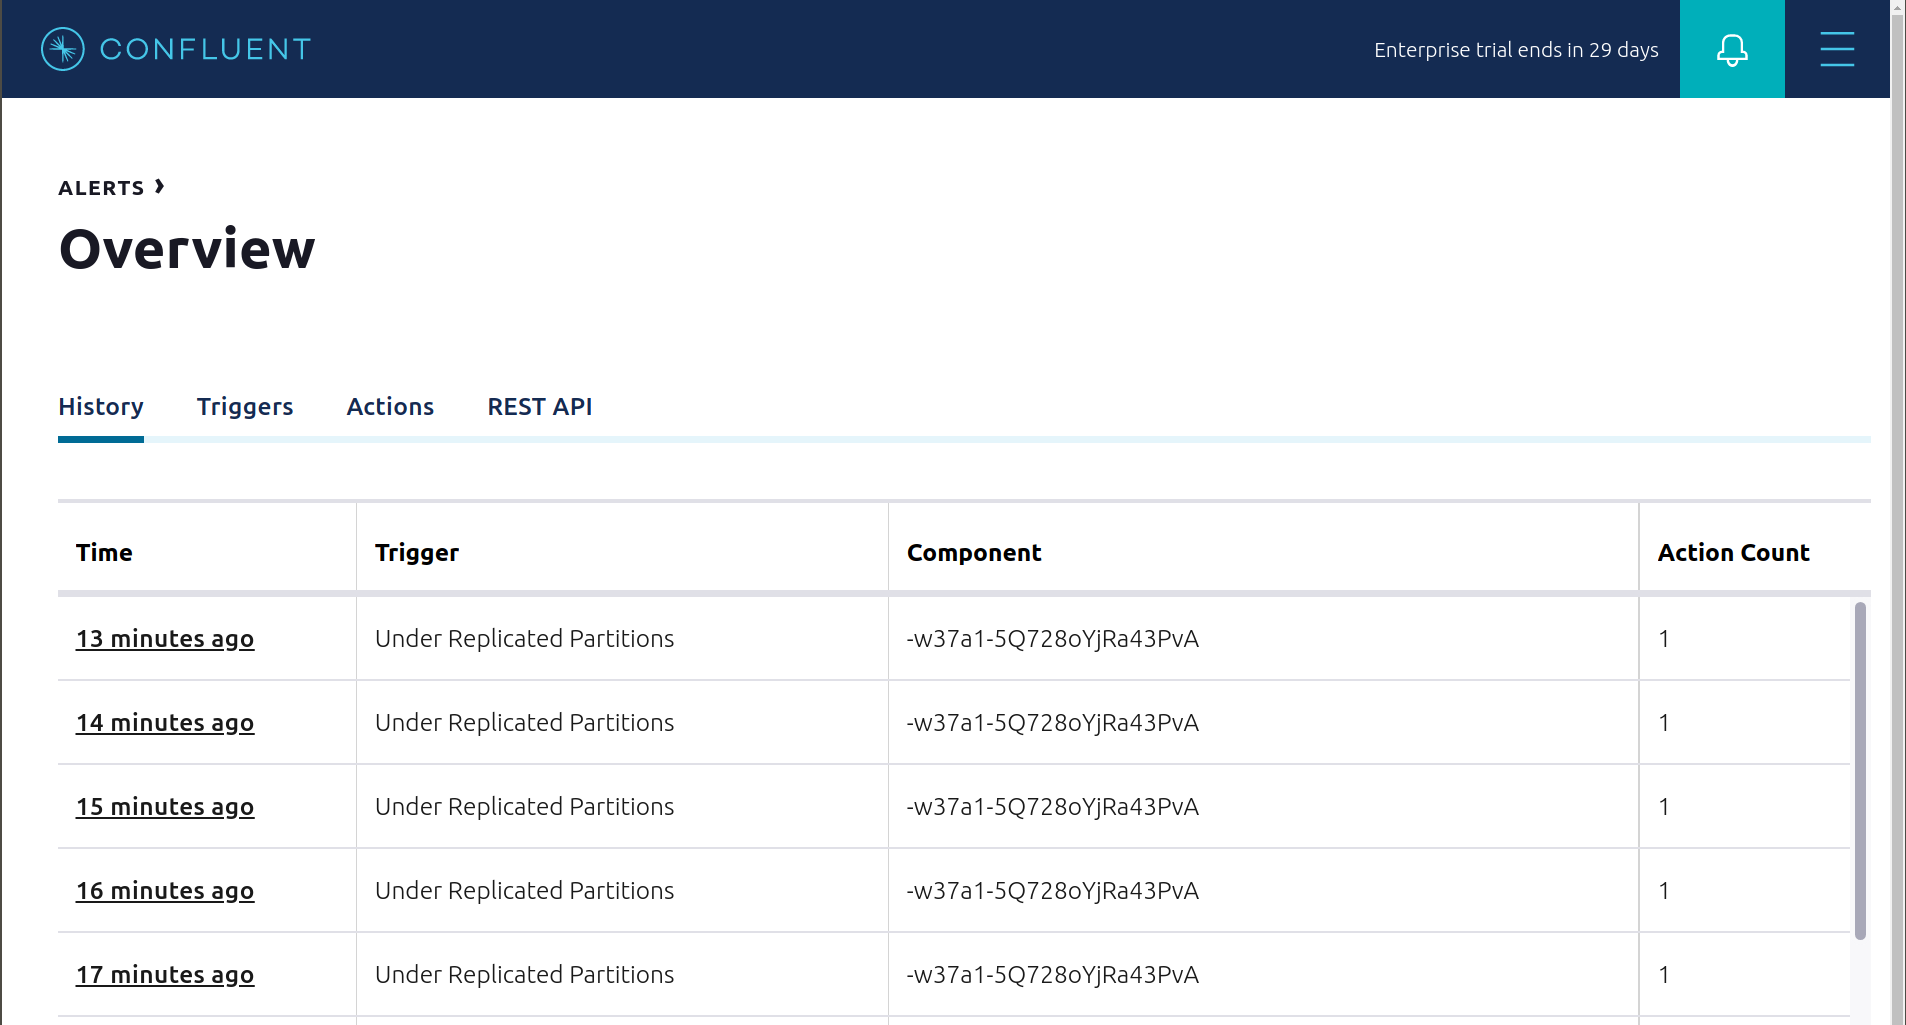
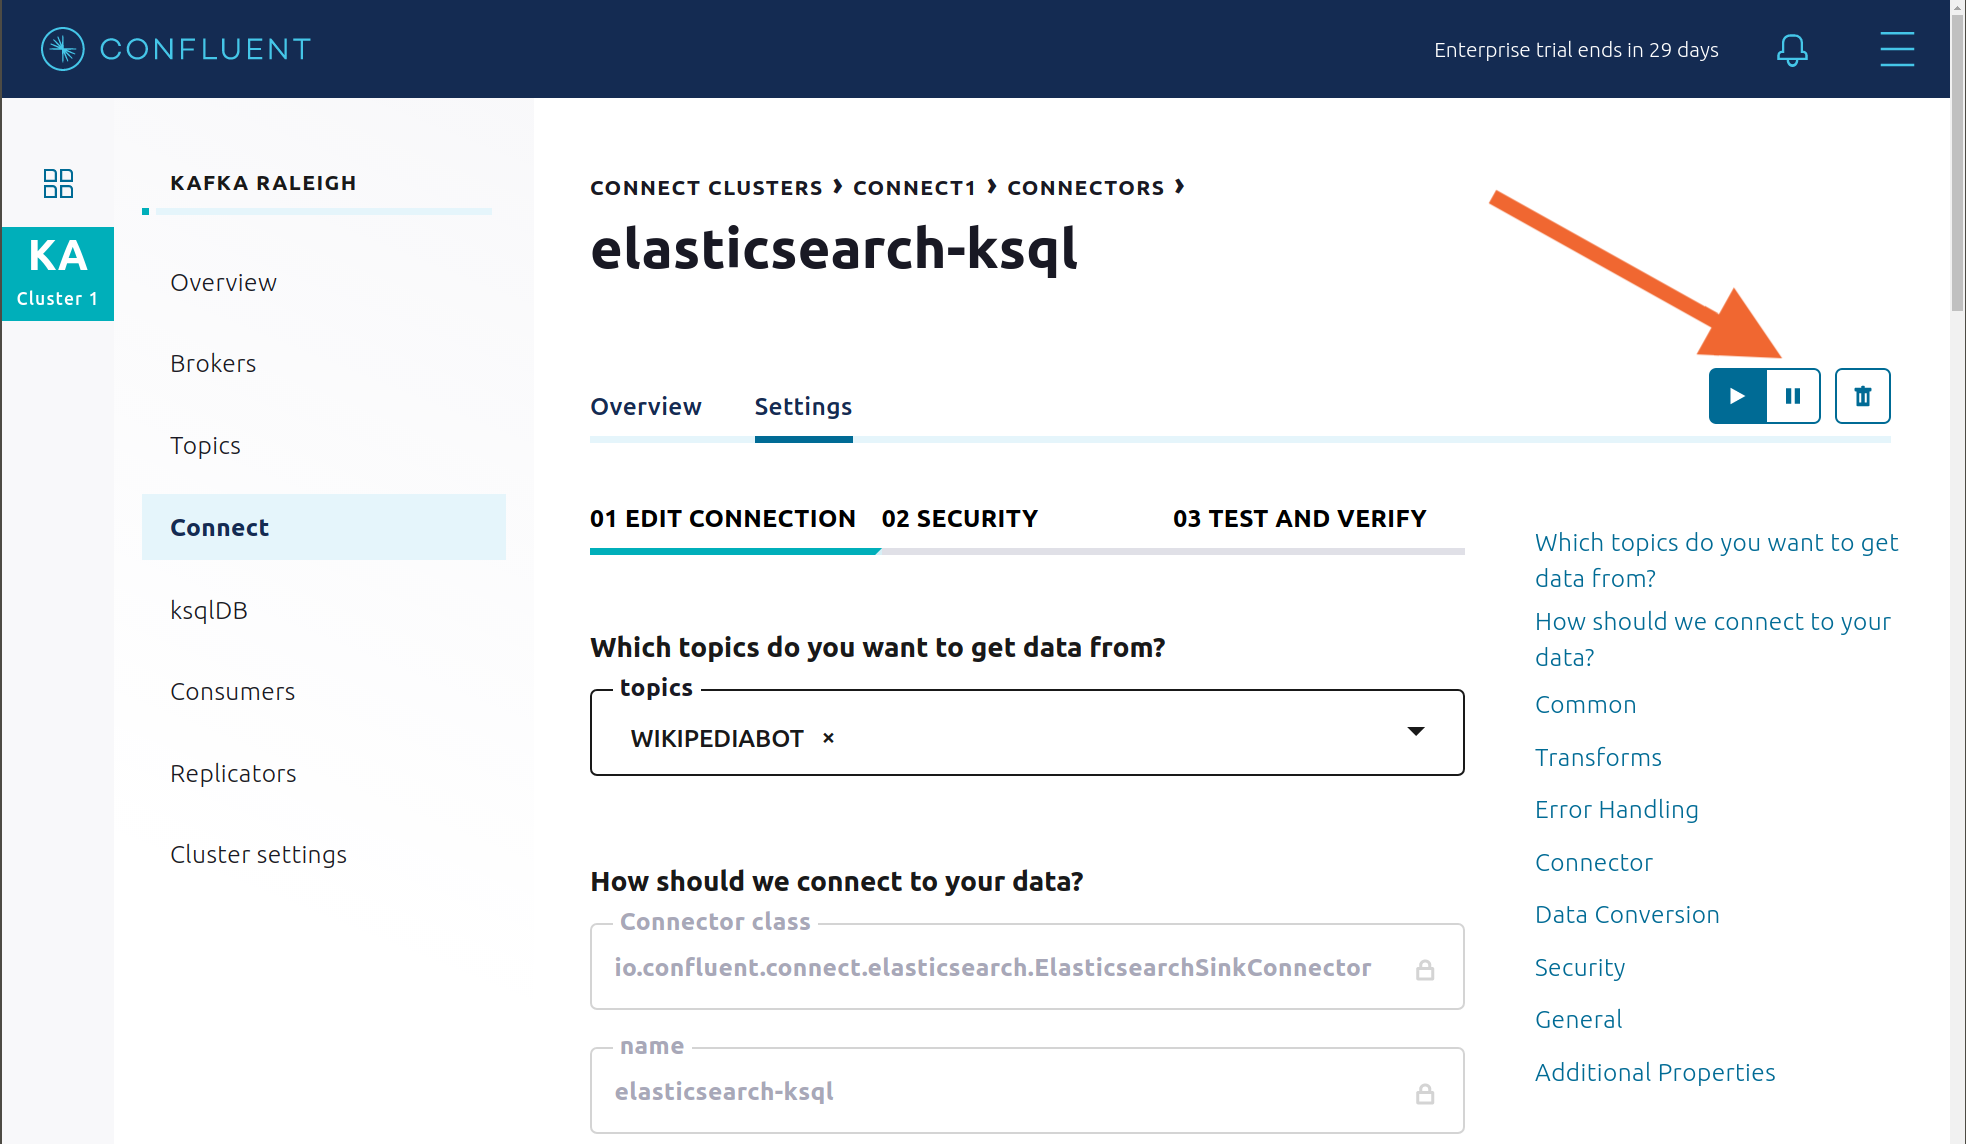
You can also trigger the
Consumption Differencetrigger. In the Kafka Connect -> Sinks screen, edit the running Elasticsearch sink connector.In the Connect view, pause the Elasticsearch sink connector in Settings by pressing the pause icon in the top right. This will stop consumption for the related consumer group.
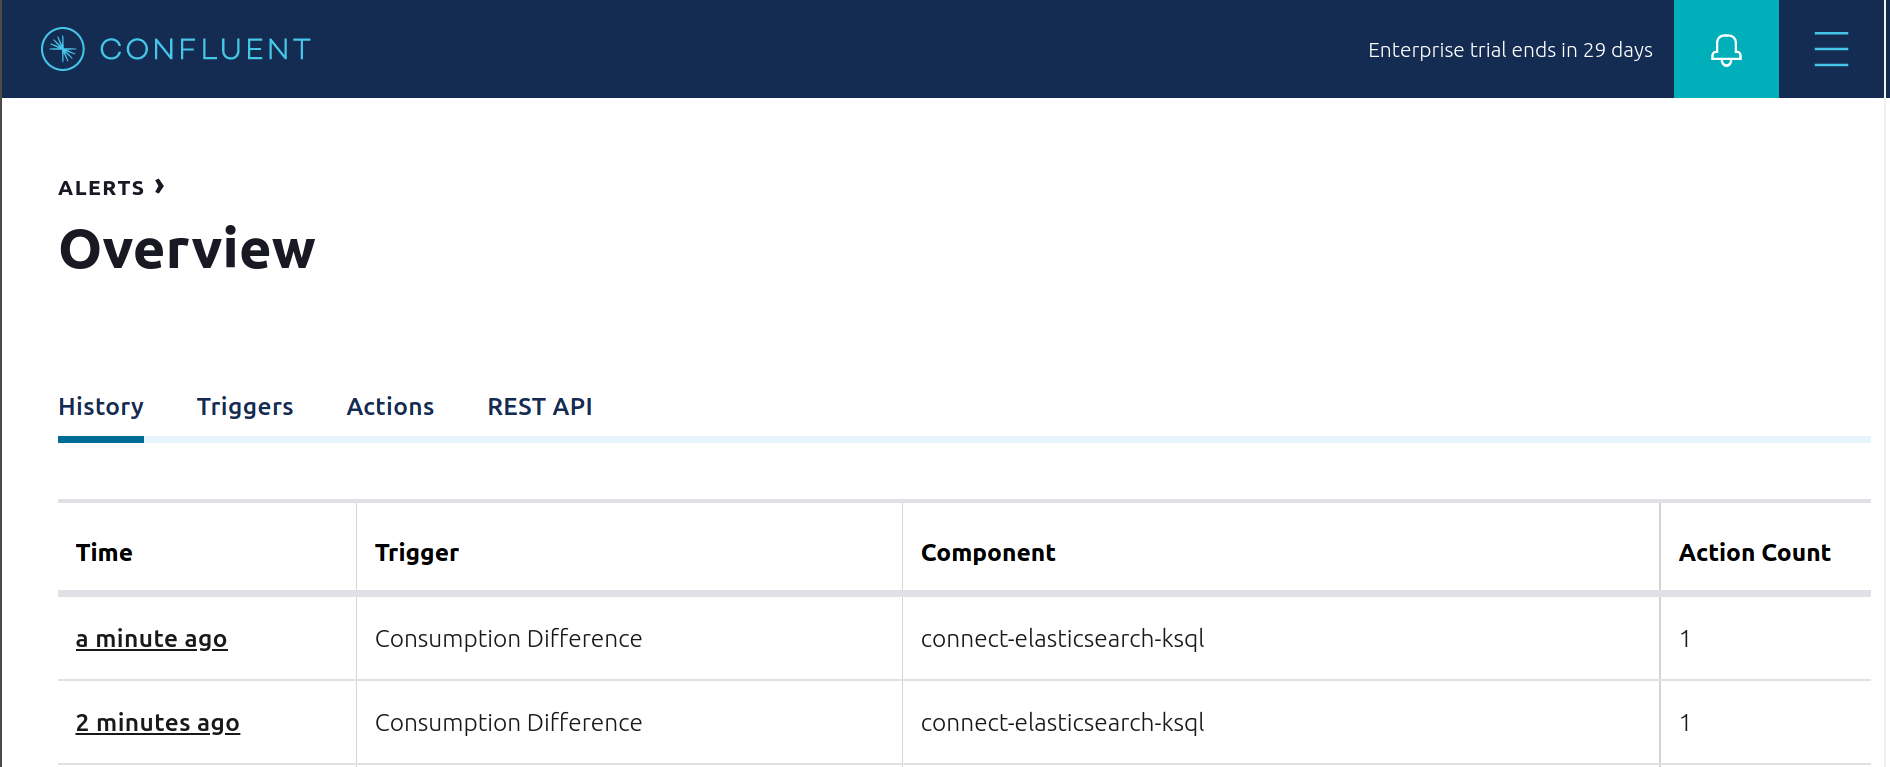
View the Alert history to see that this trigger happened and caused an alert.
Monitoring
This tutorial has demonstrated how Confluent Control Center helps users manage their Confluent Platform deployment and how it provides monitoring capabilities for the cluster and applications. For most Confluent Platform users the Confluent Control Center monitoring and integrations are sufficent for production usage; however, some users wish to integrate with other monitoring solutions like Prometheus, Grafana, Datadog, and Splunk. The following JMX-based monitoring stacks help users setup a ‘single pane of glass’ monitoring solution for all their organization’s services and applications, including Kafka.
Here are some examples of monitoring stacks that integrate with Confluent Platform:
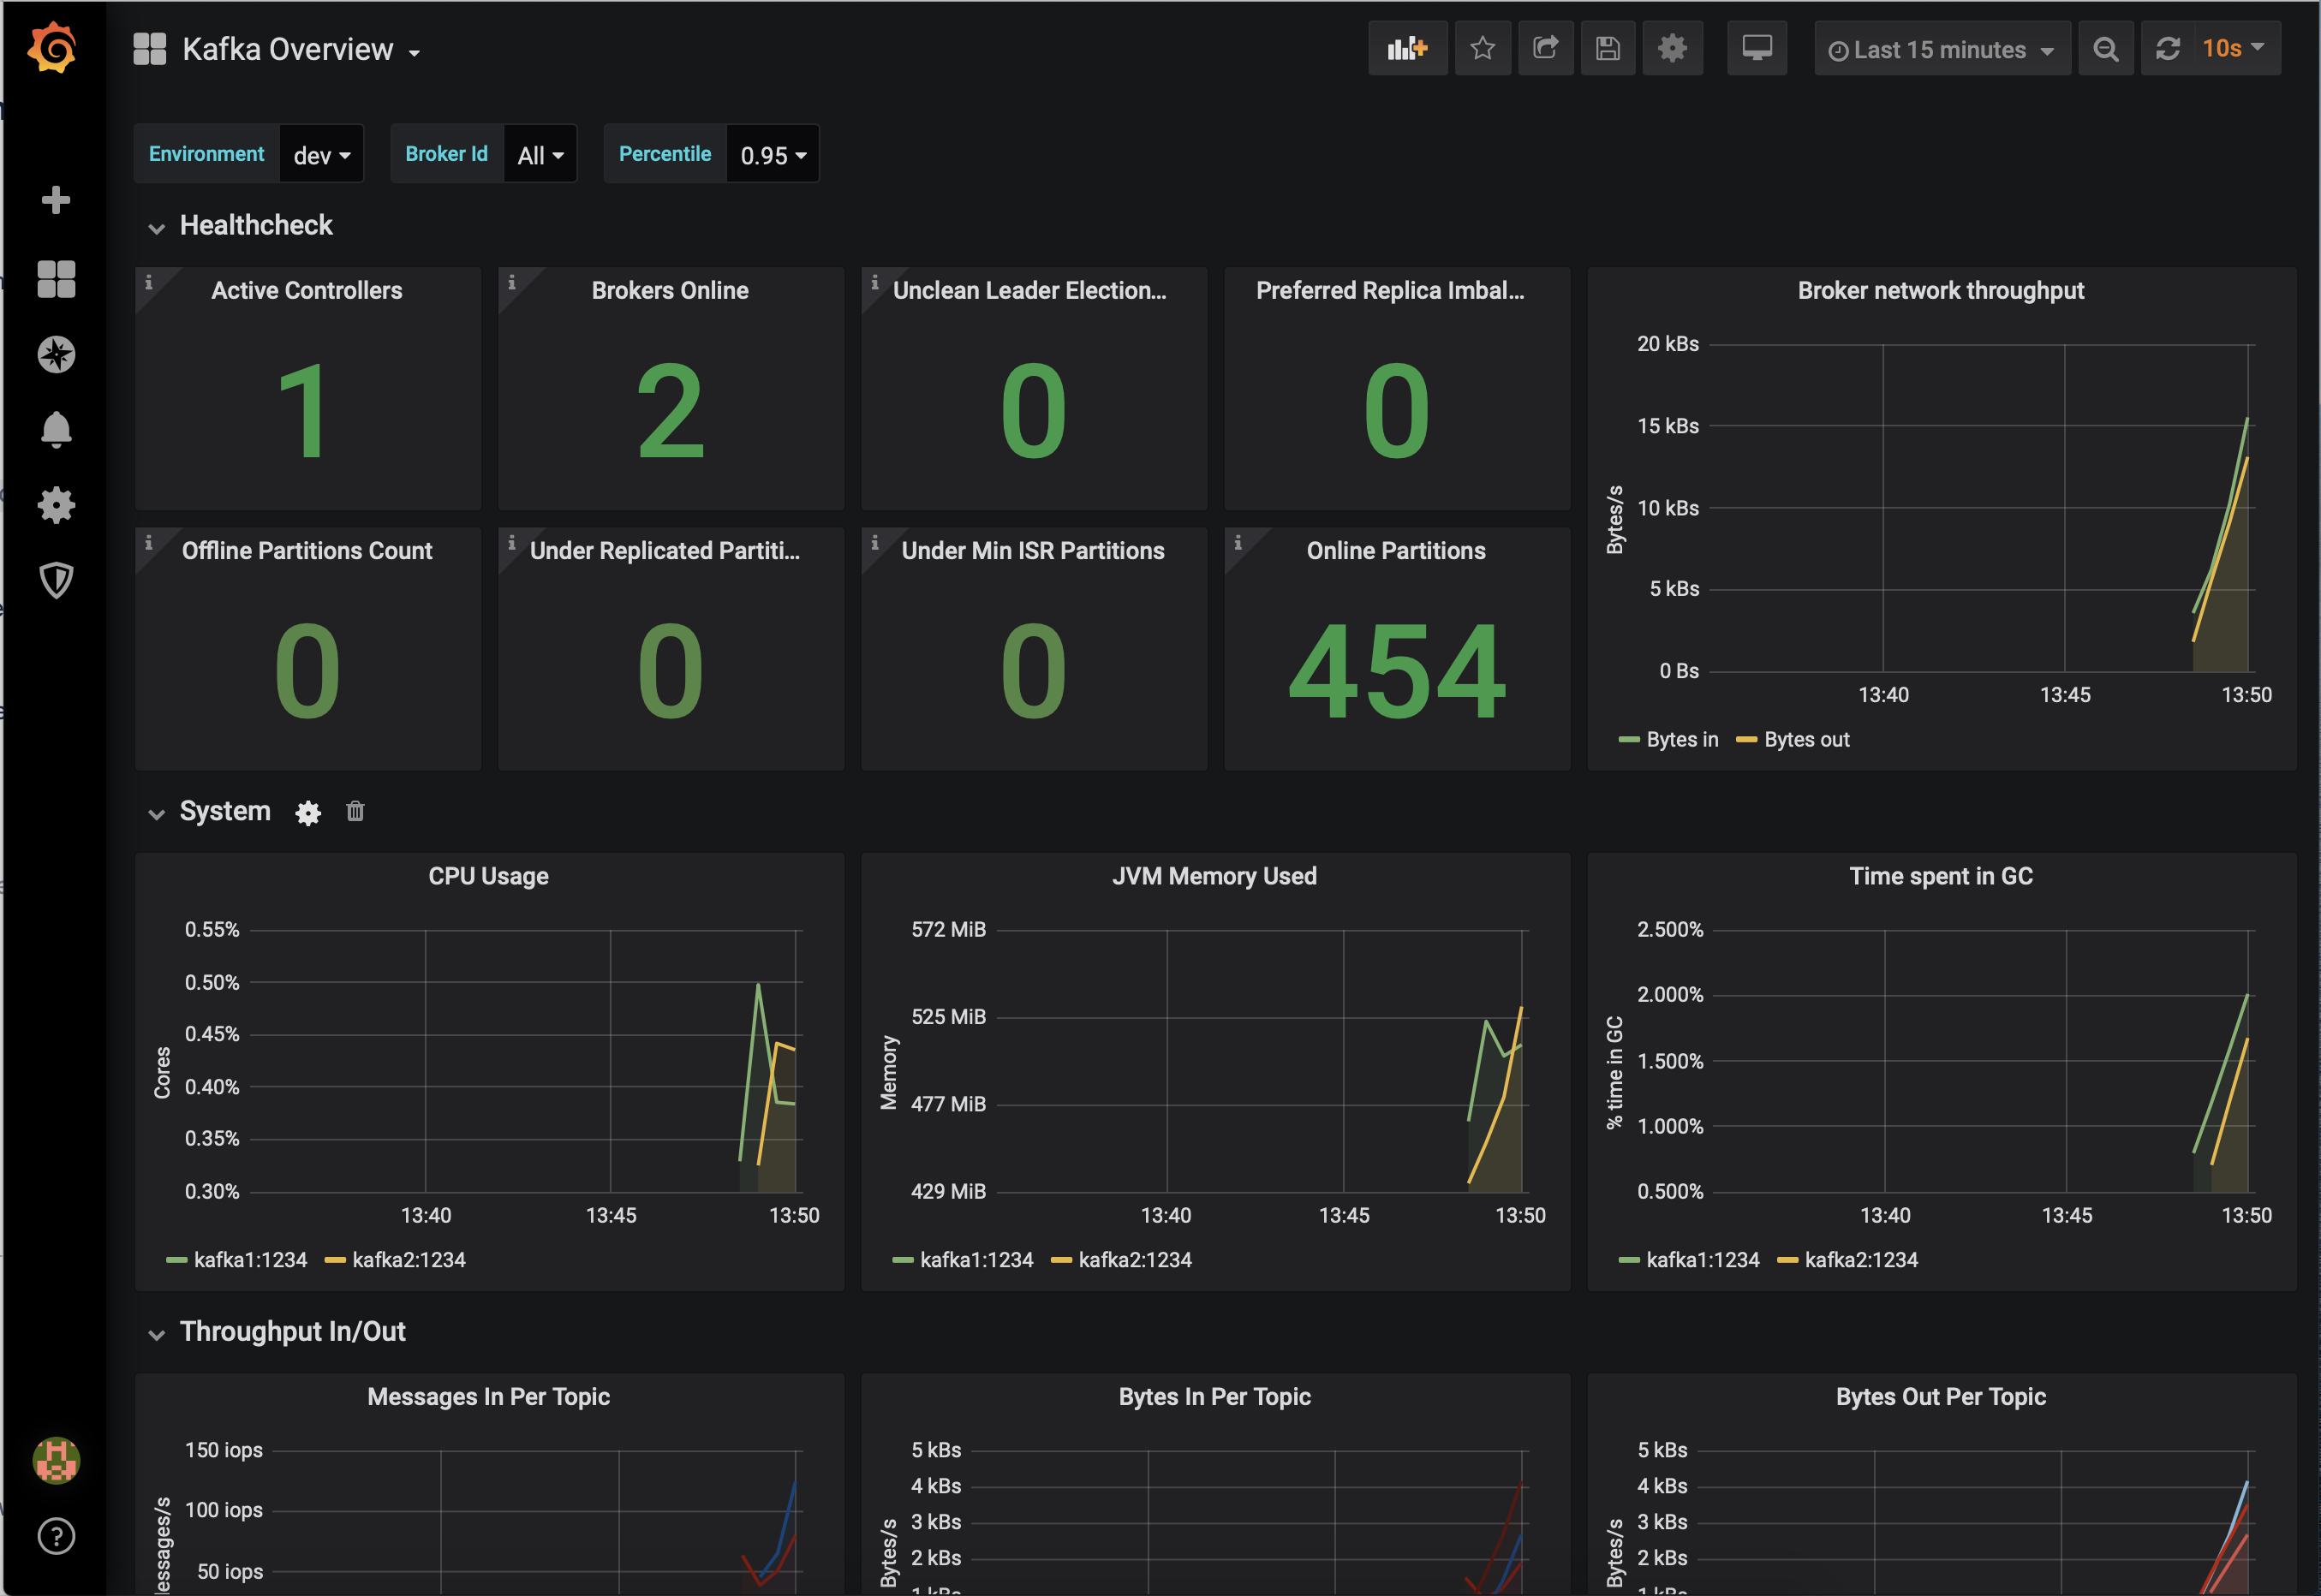
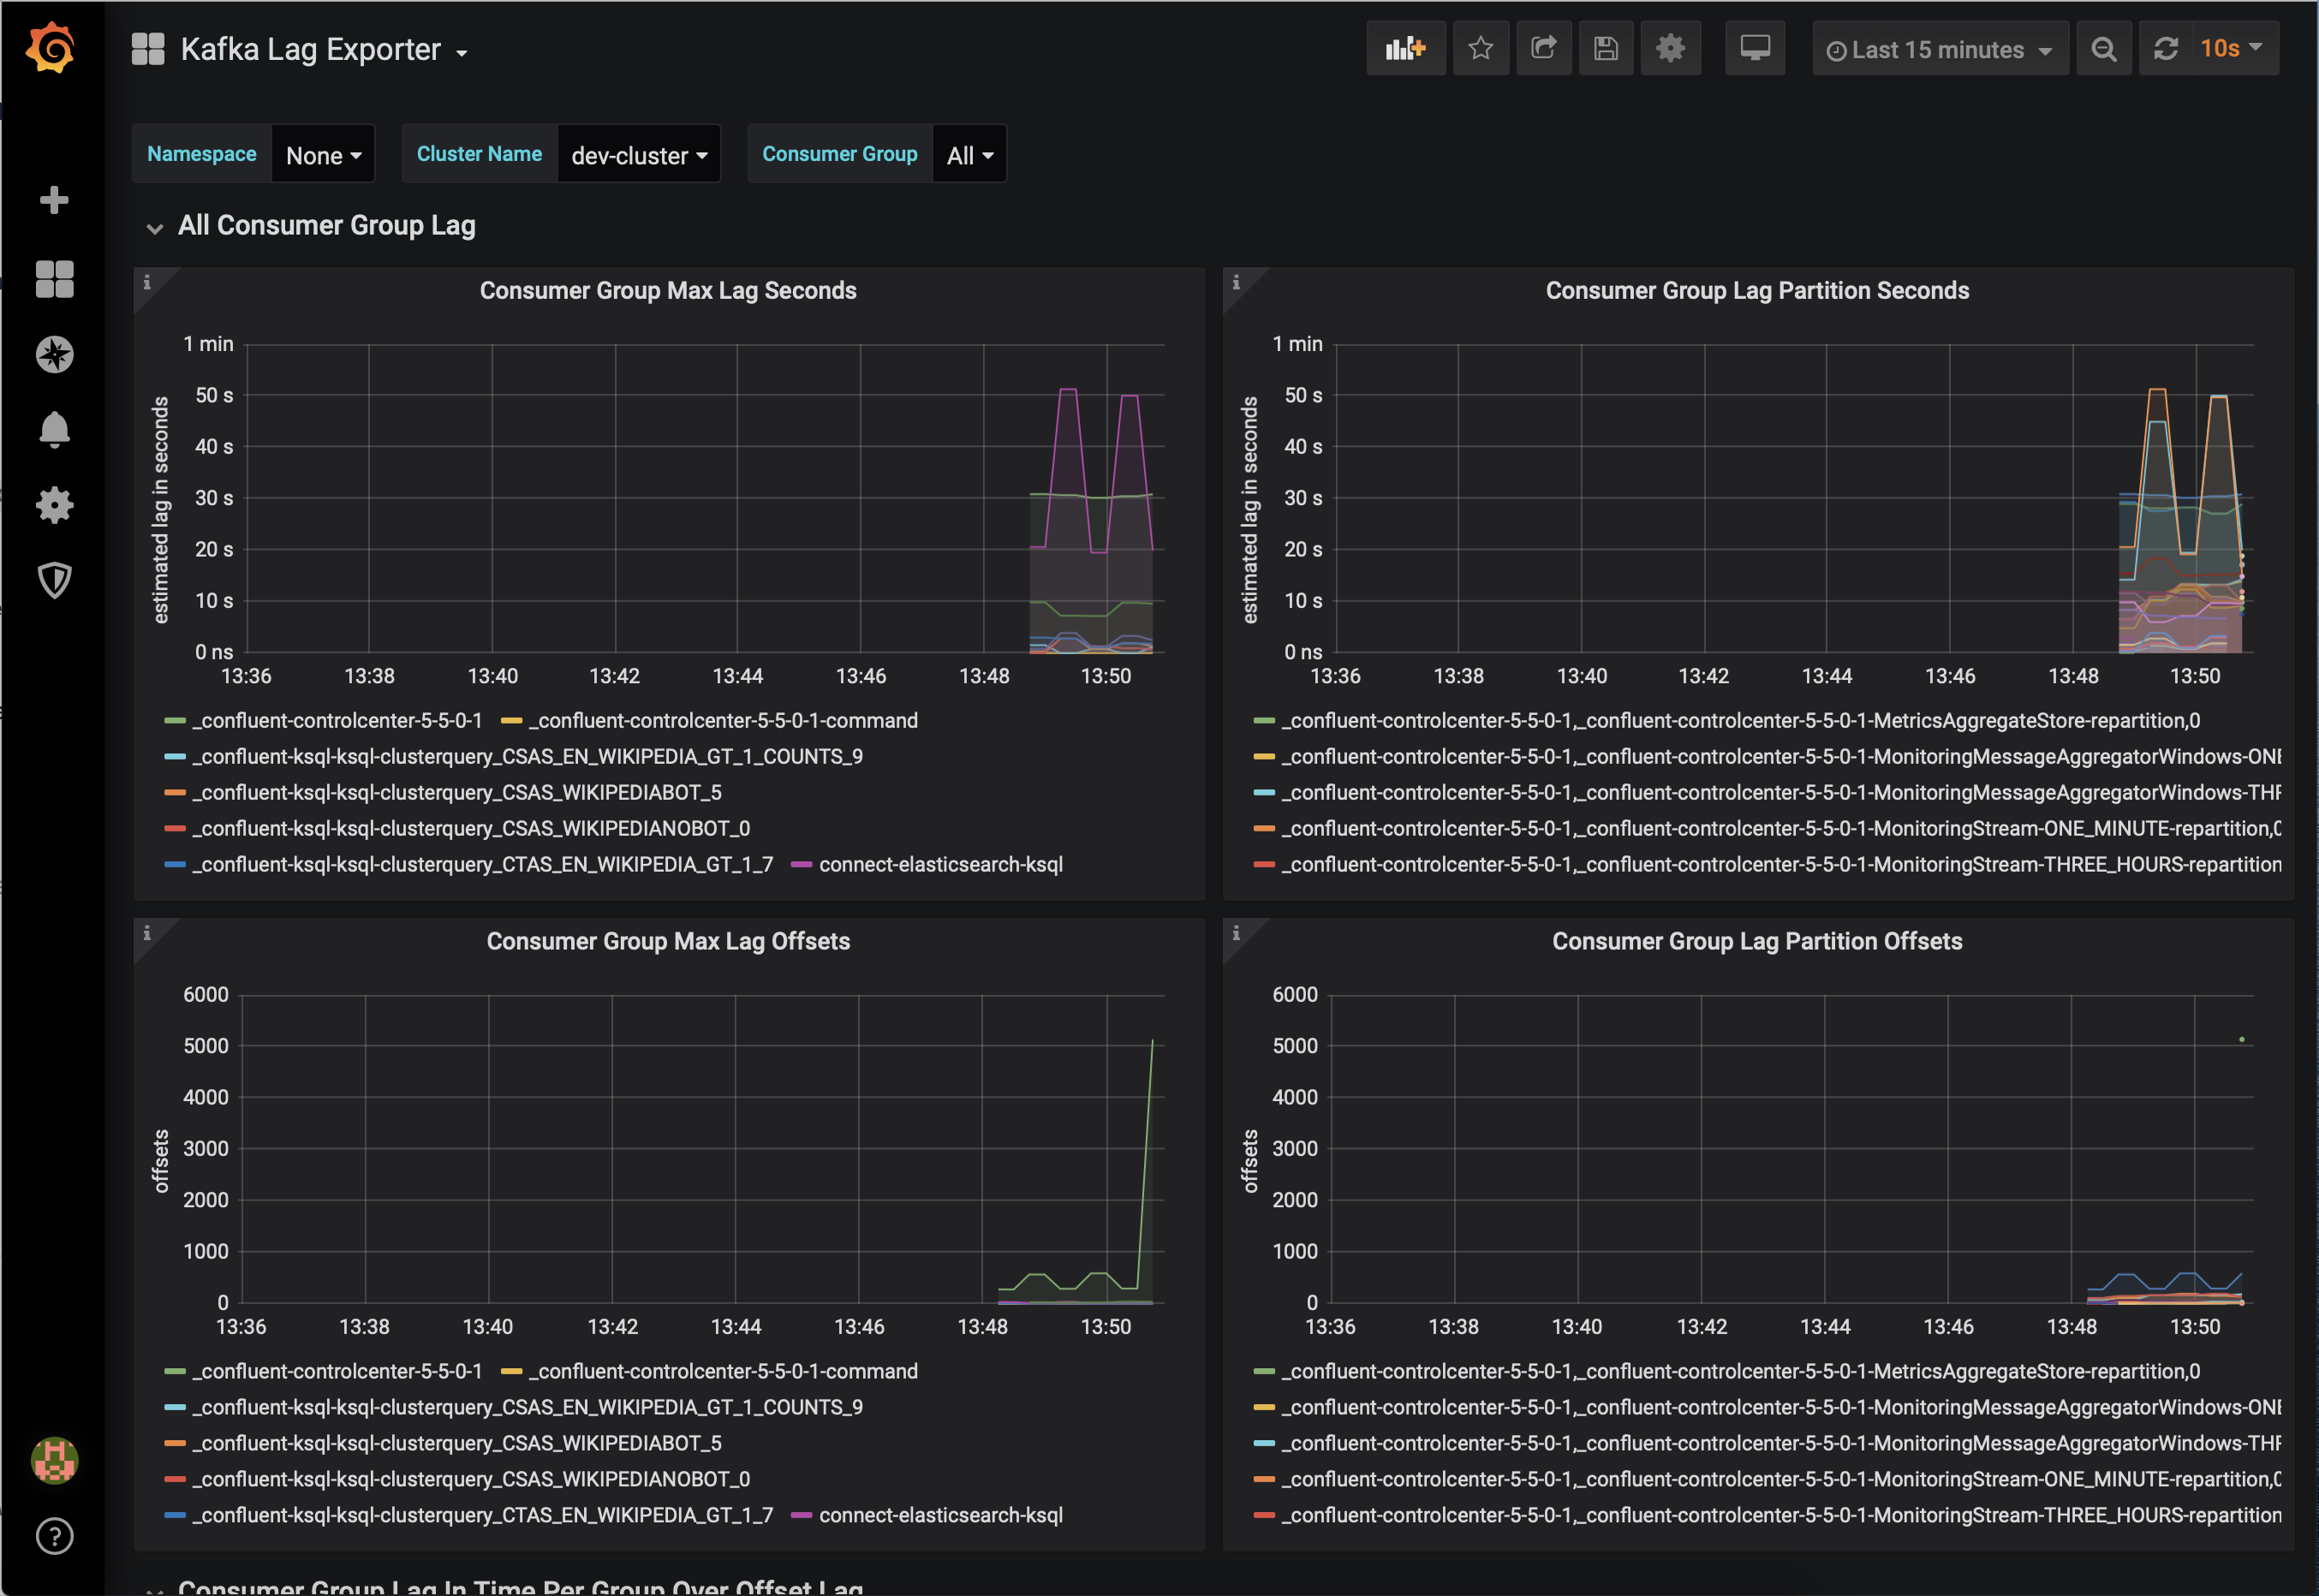
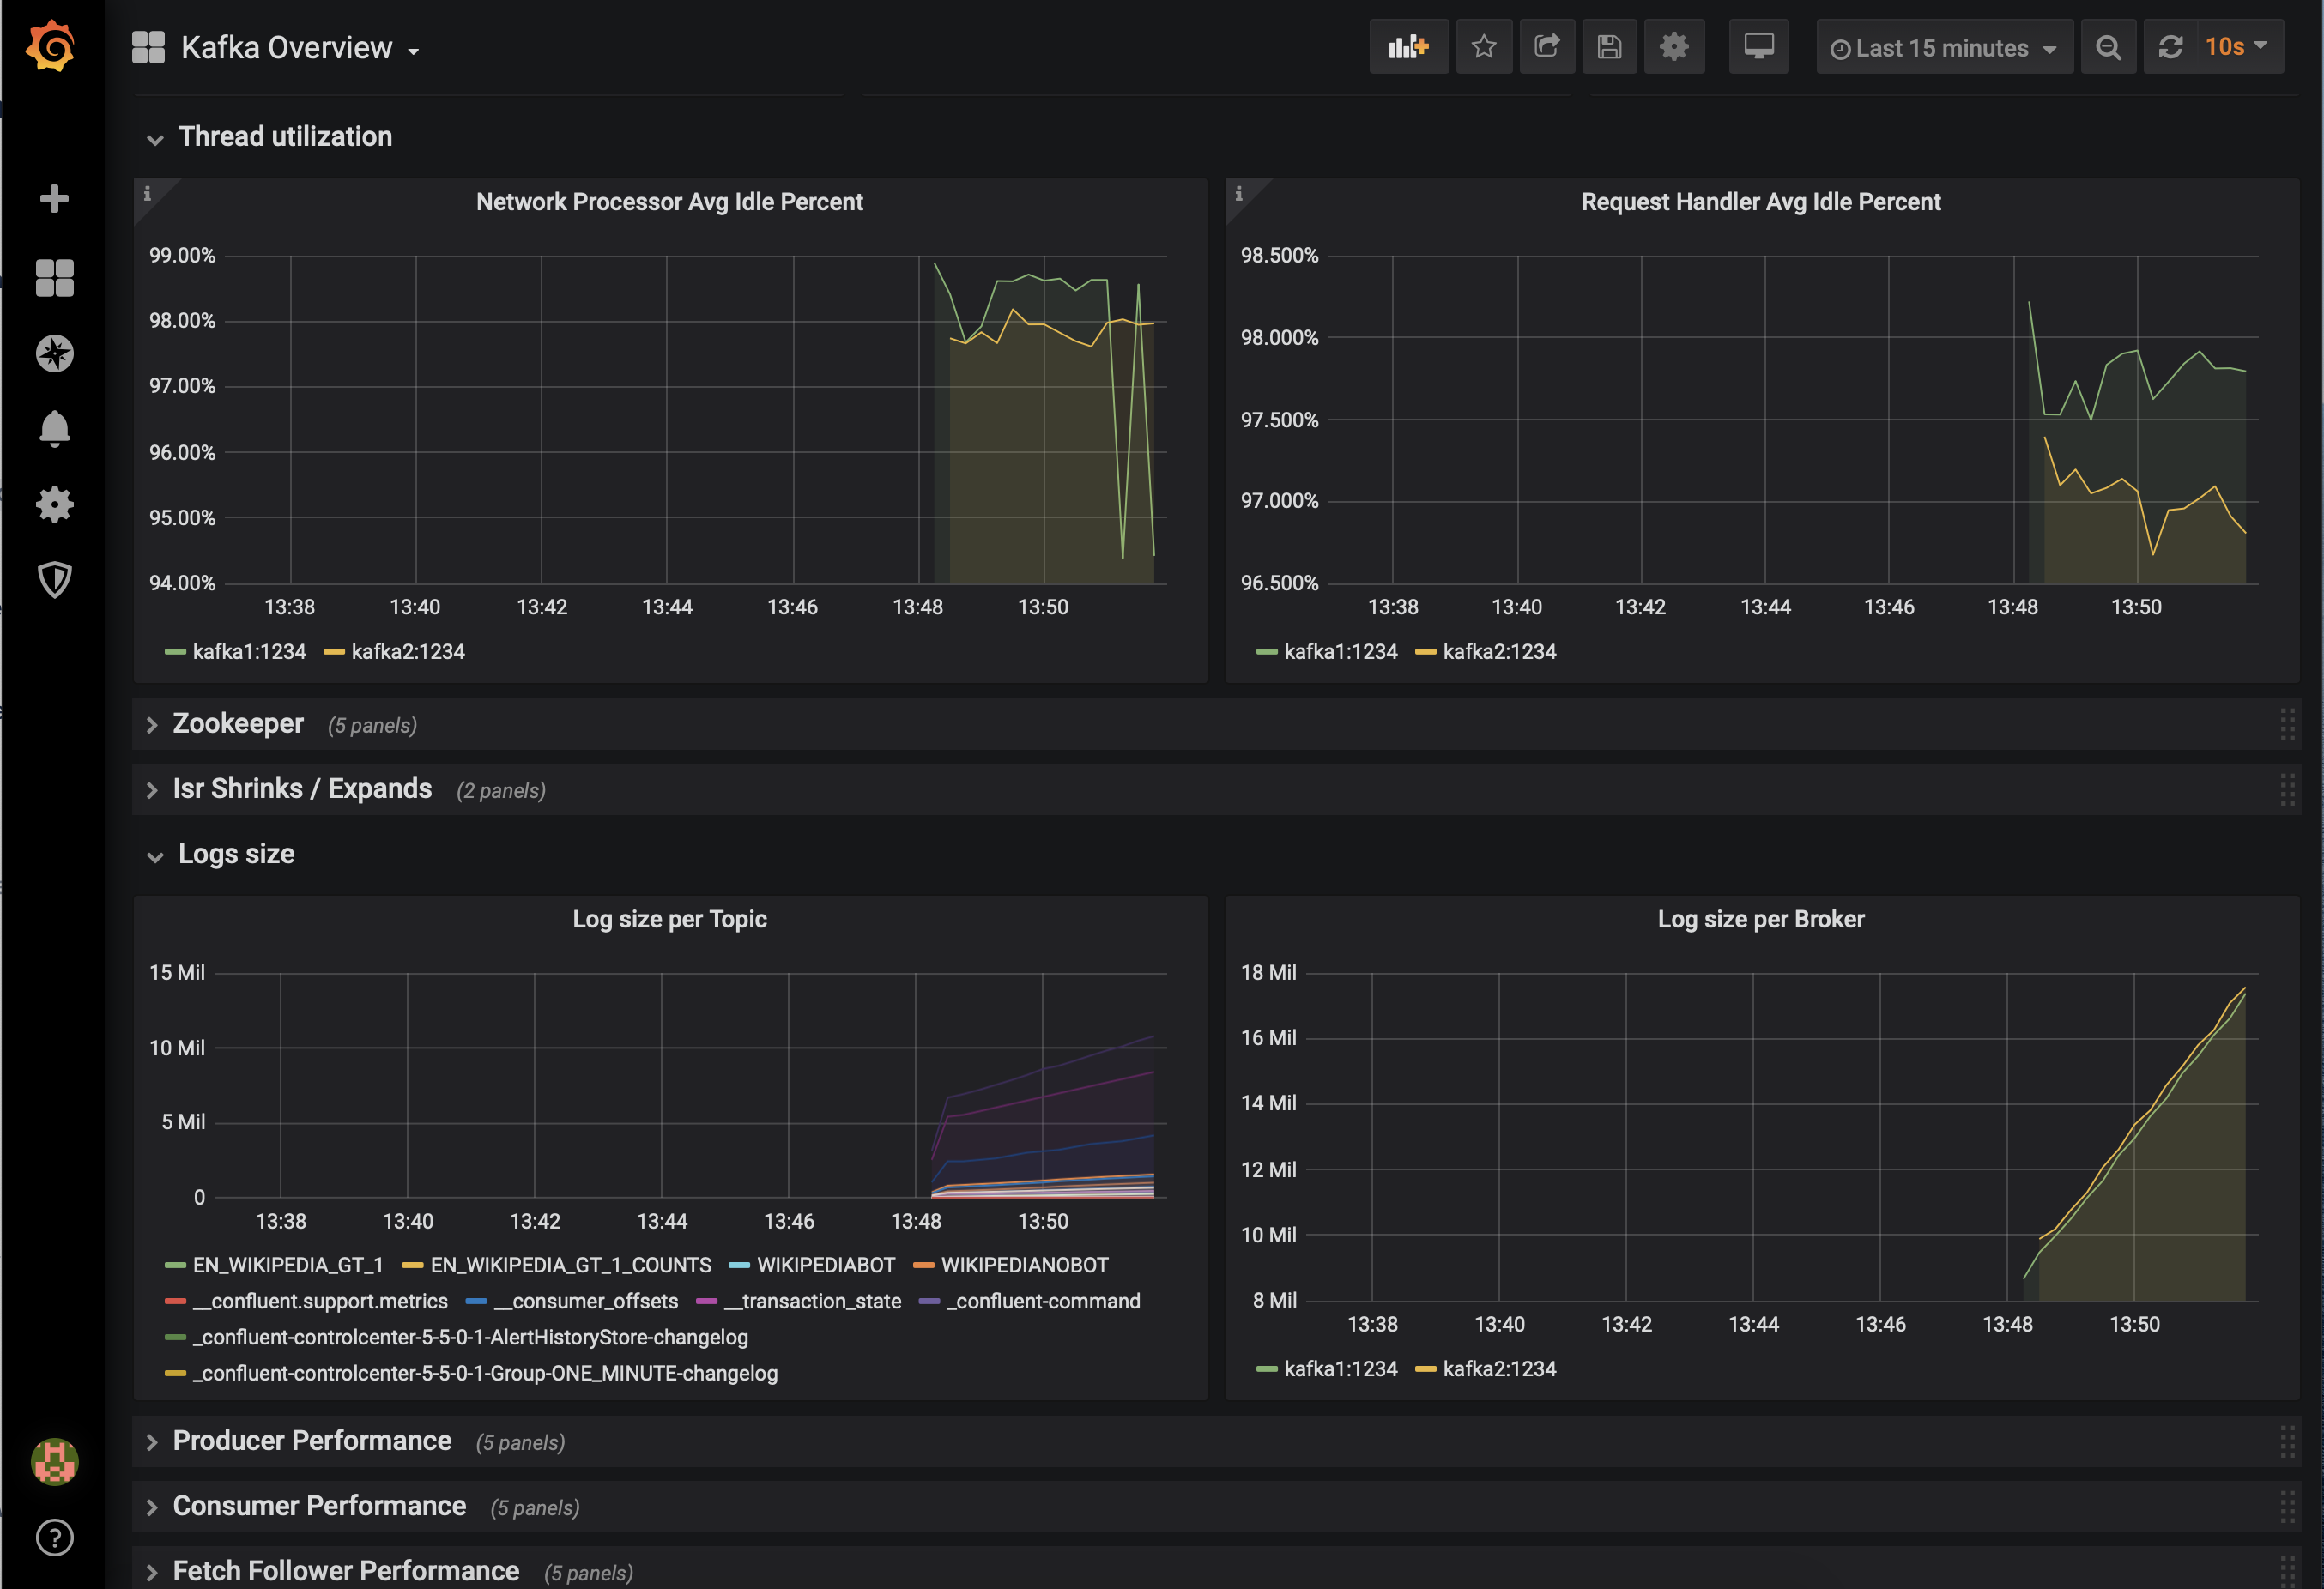
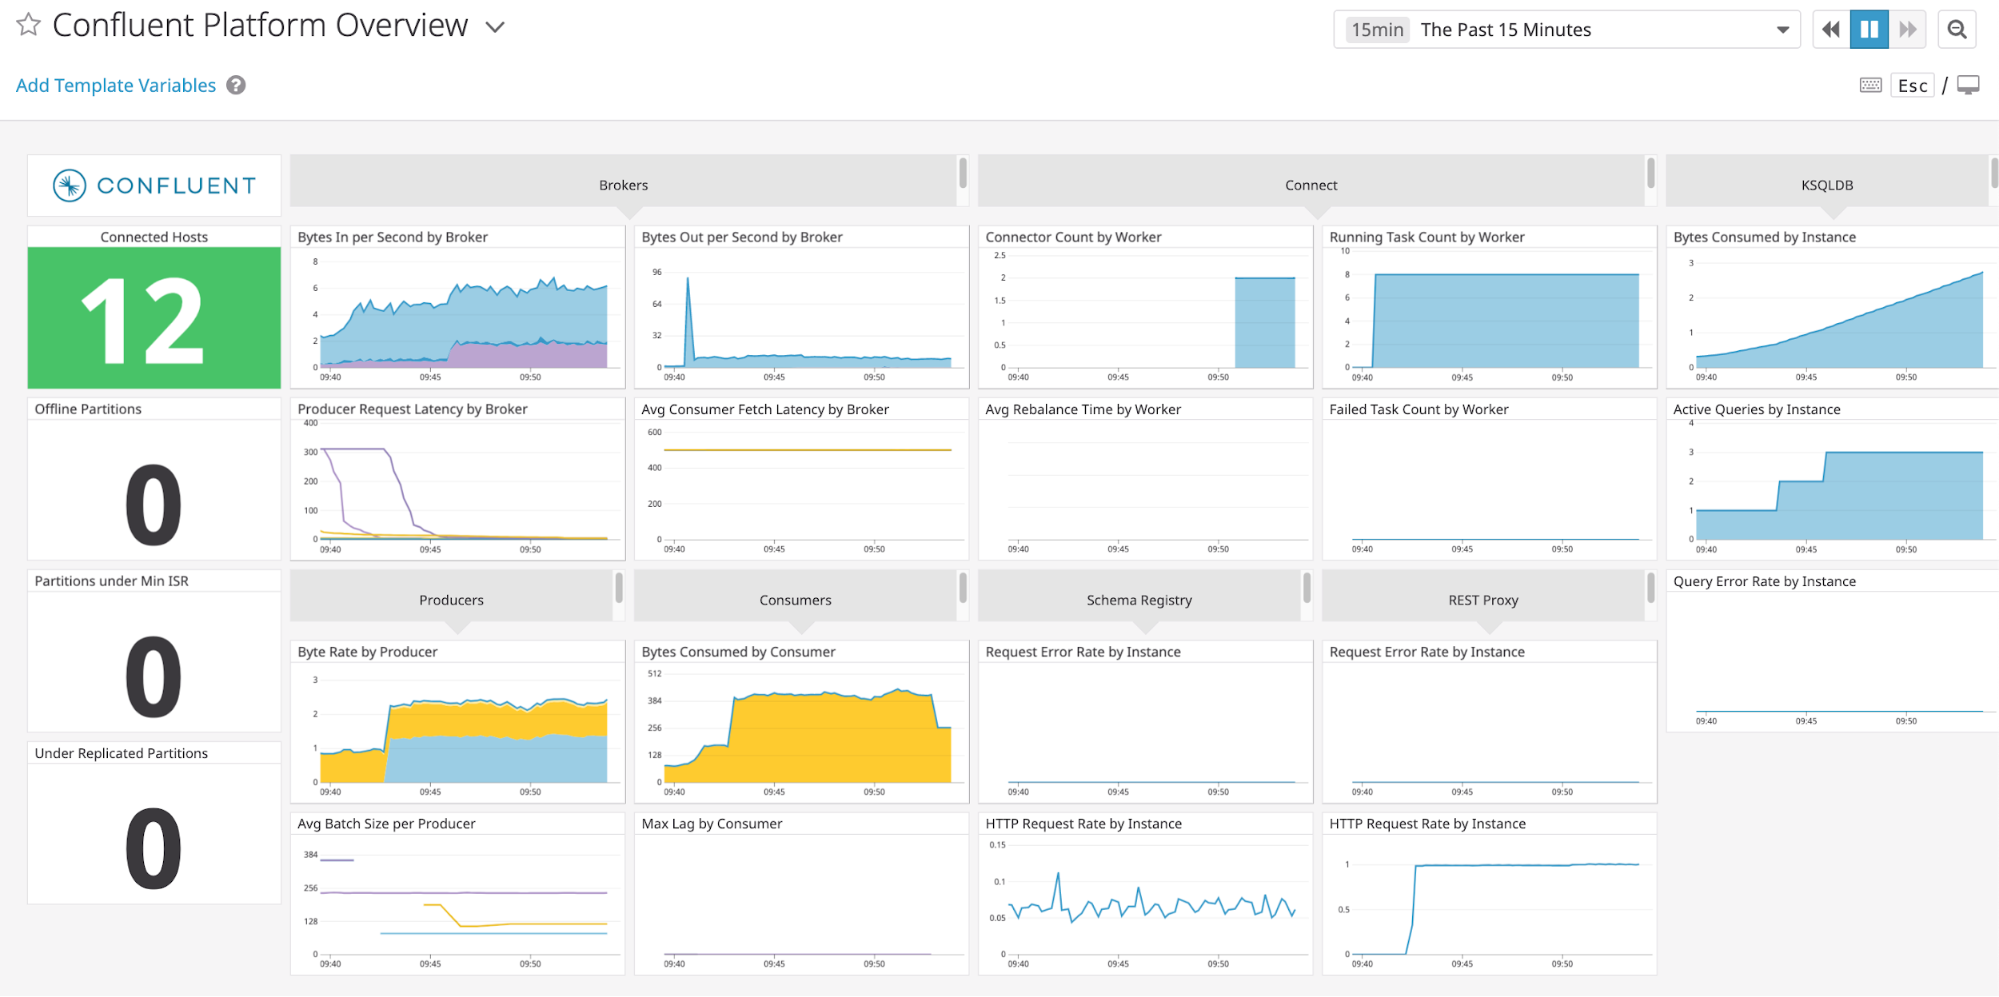
JMX Exporter + Prometheus + Grafana (runnable with cp-demo from https://github.com/confluentinc/jmx-monitoring-stacks):
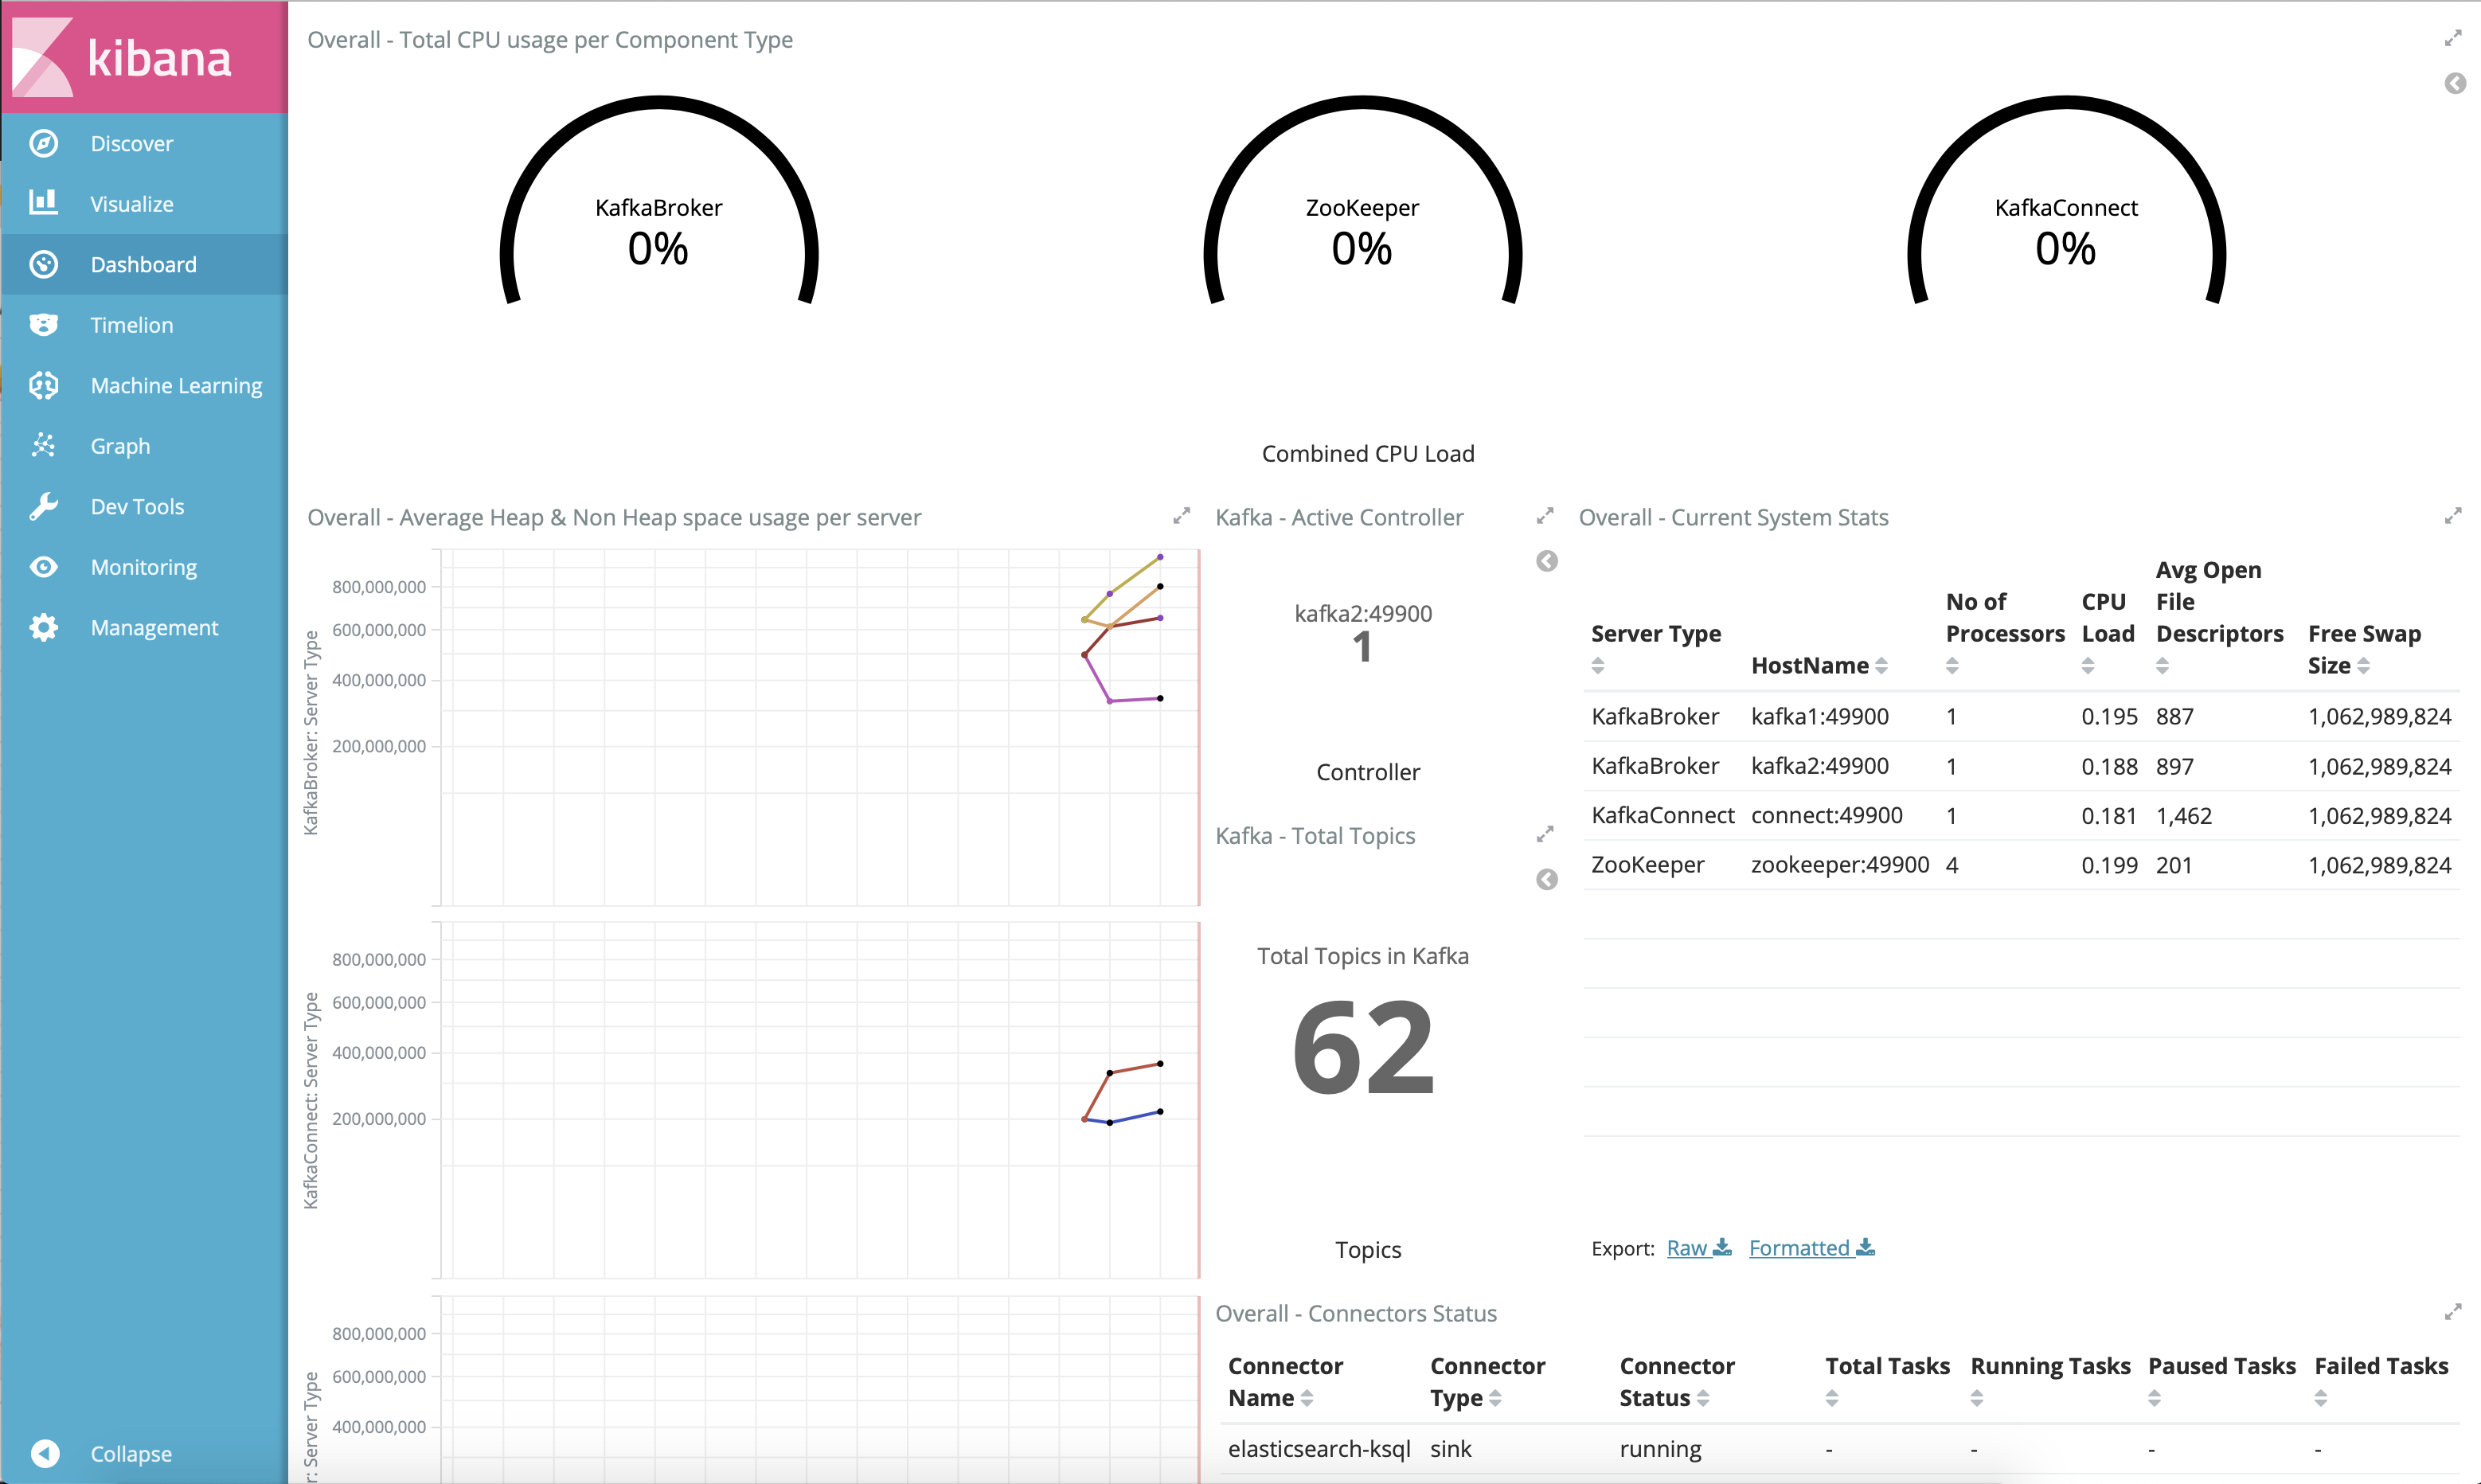
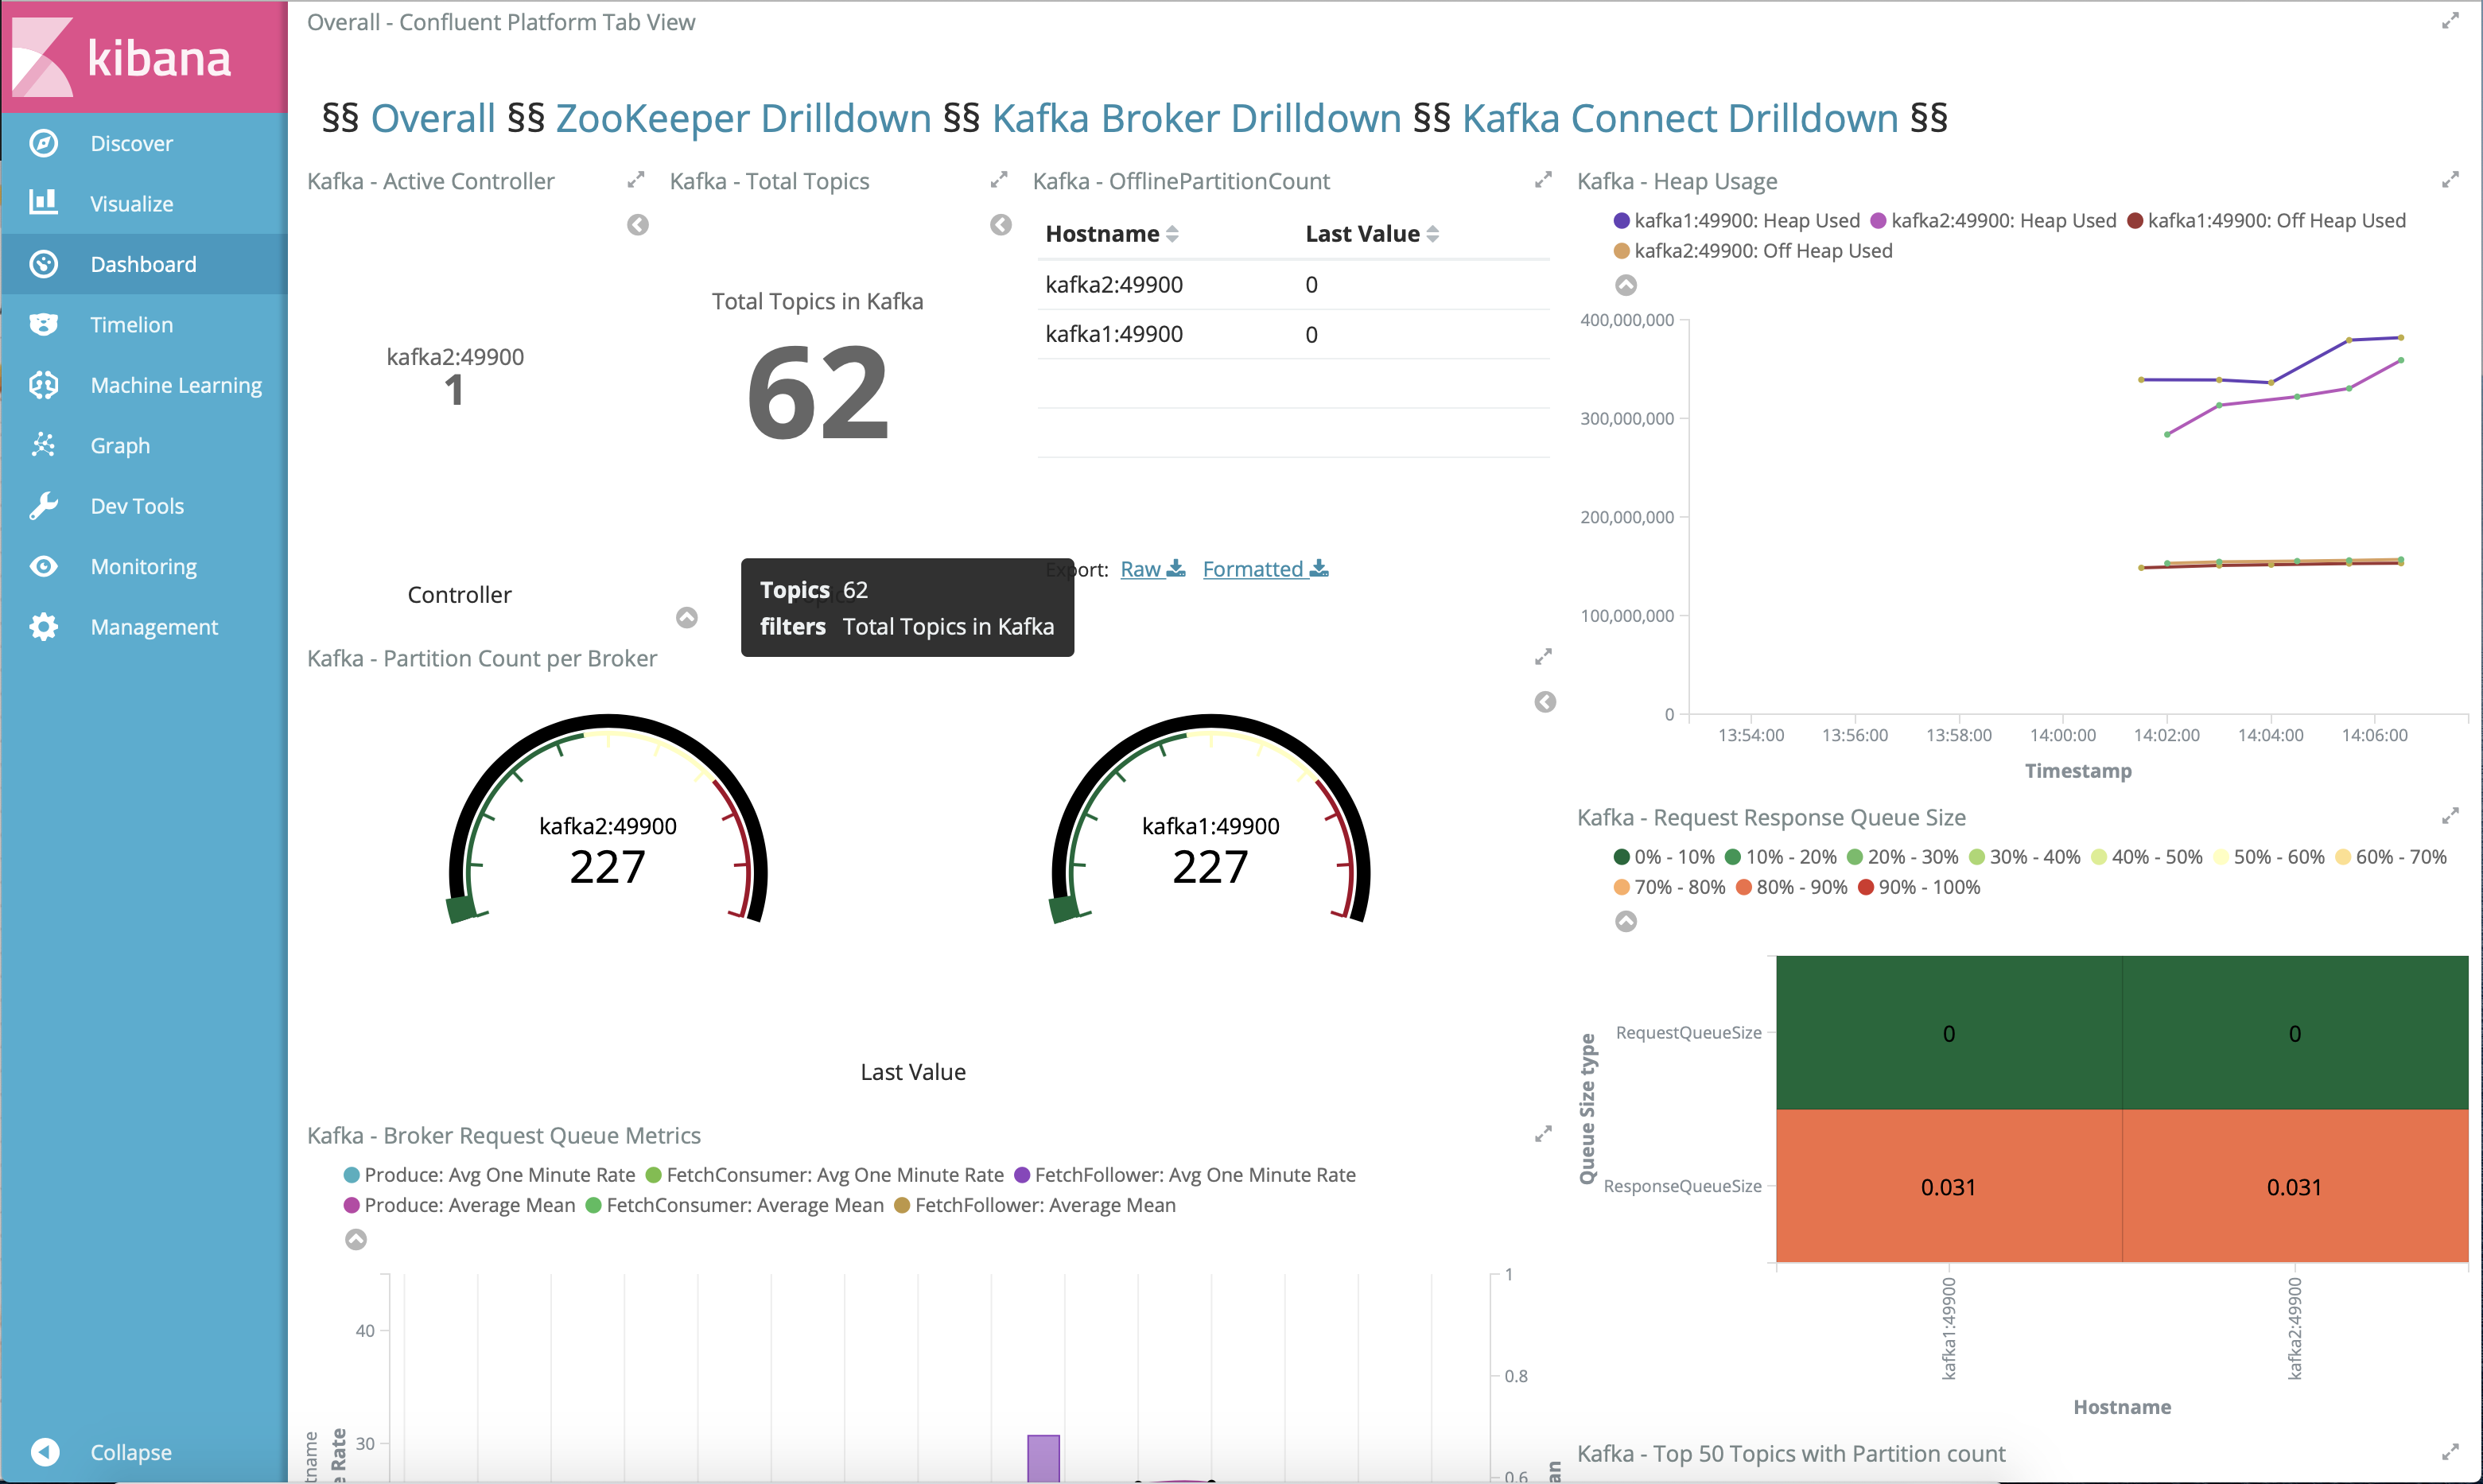
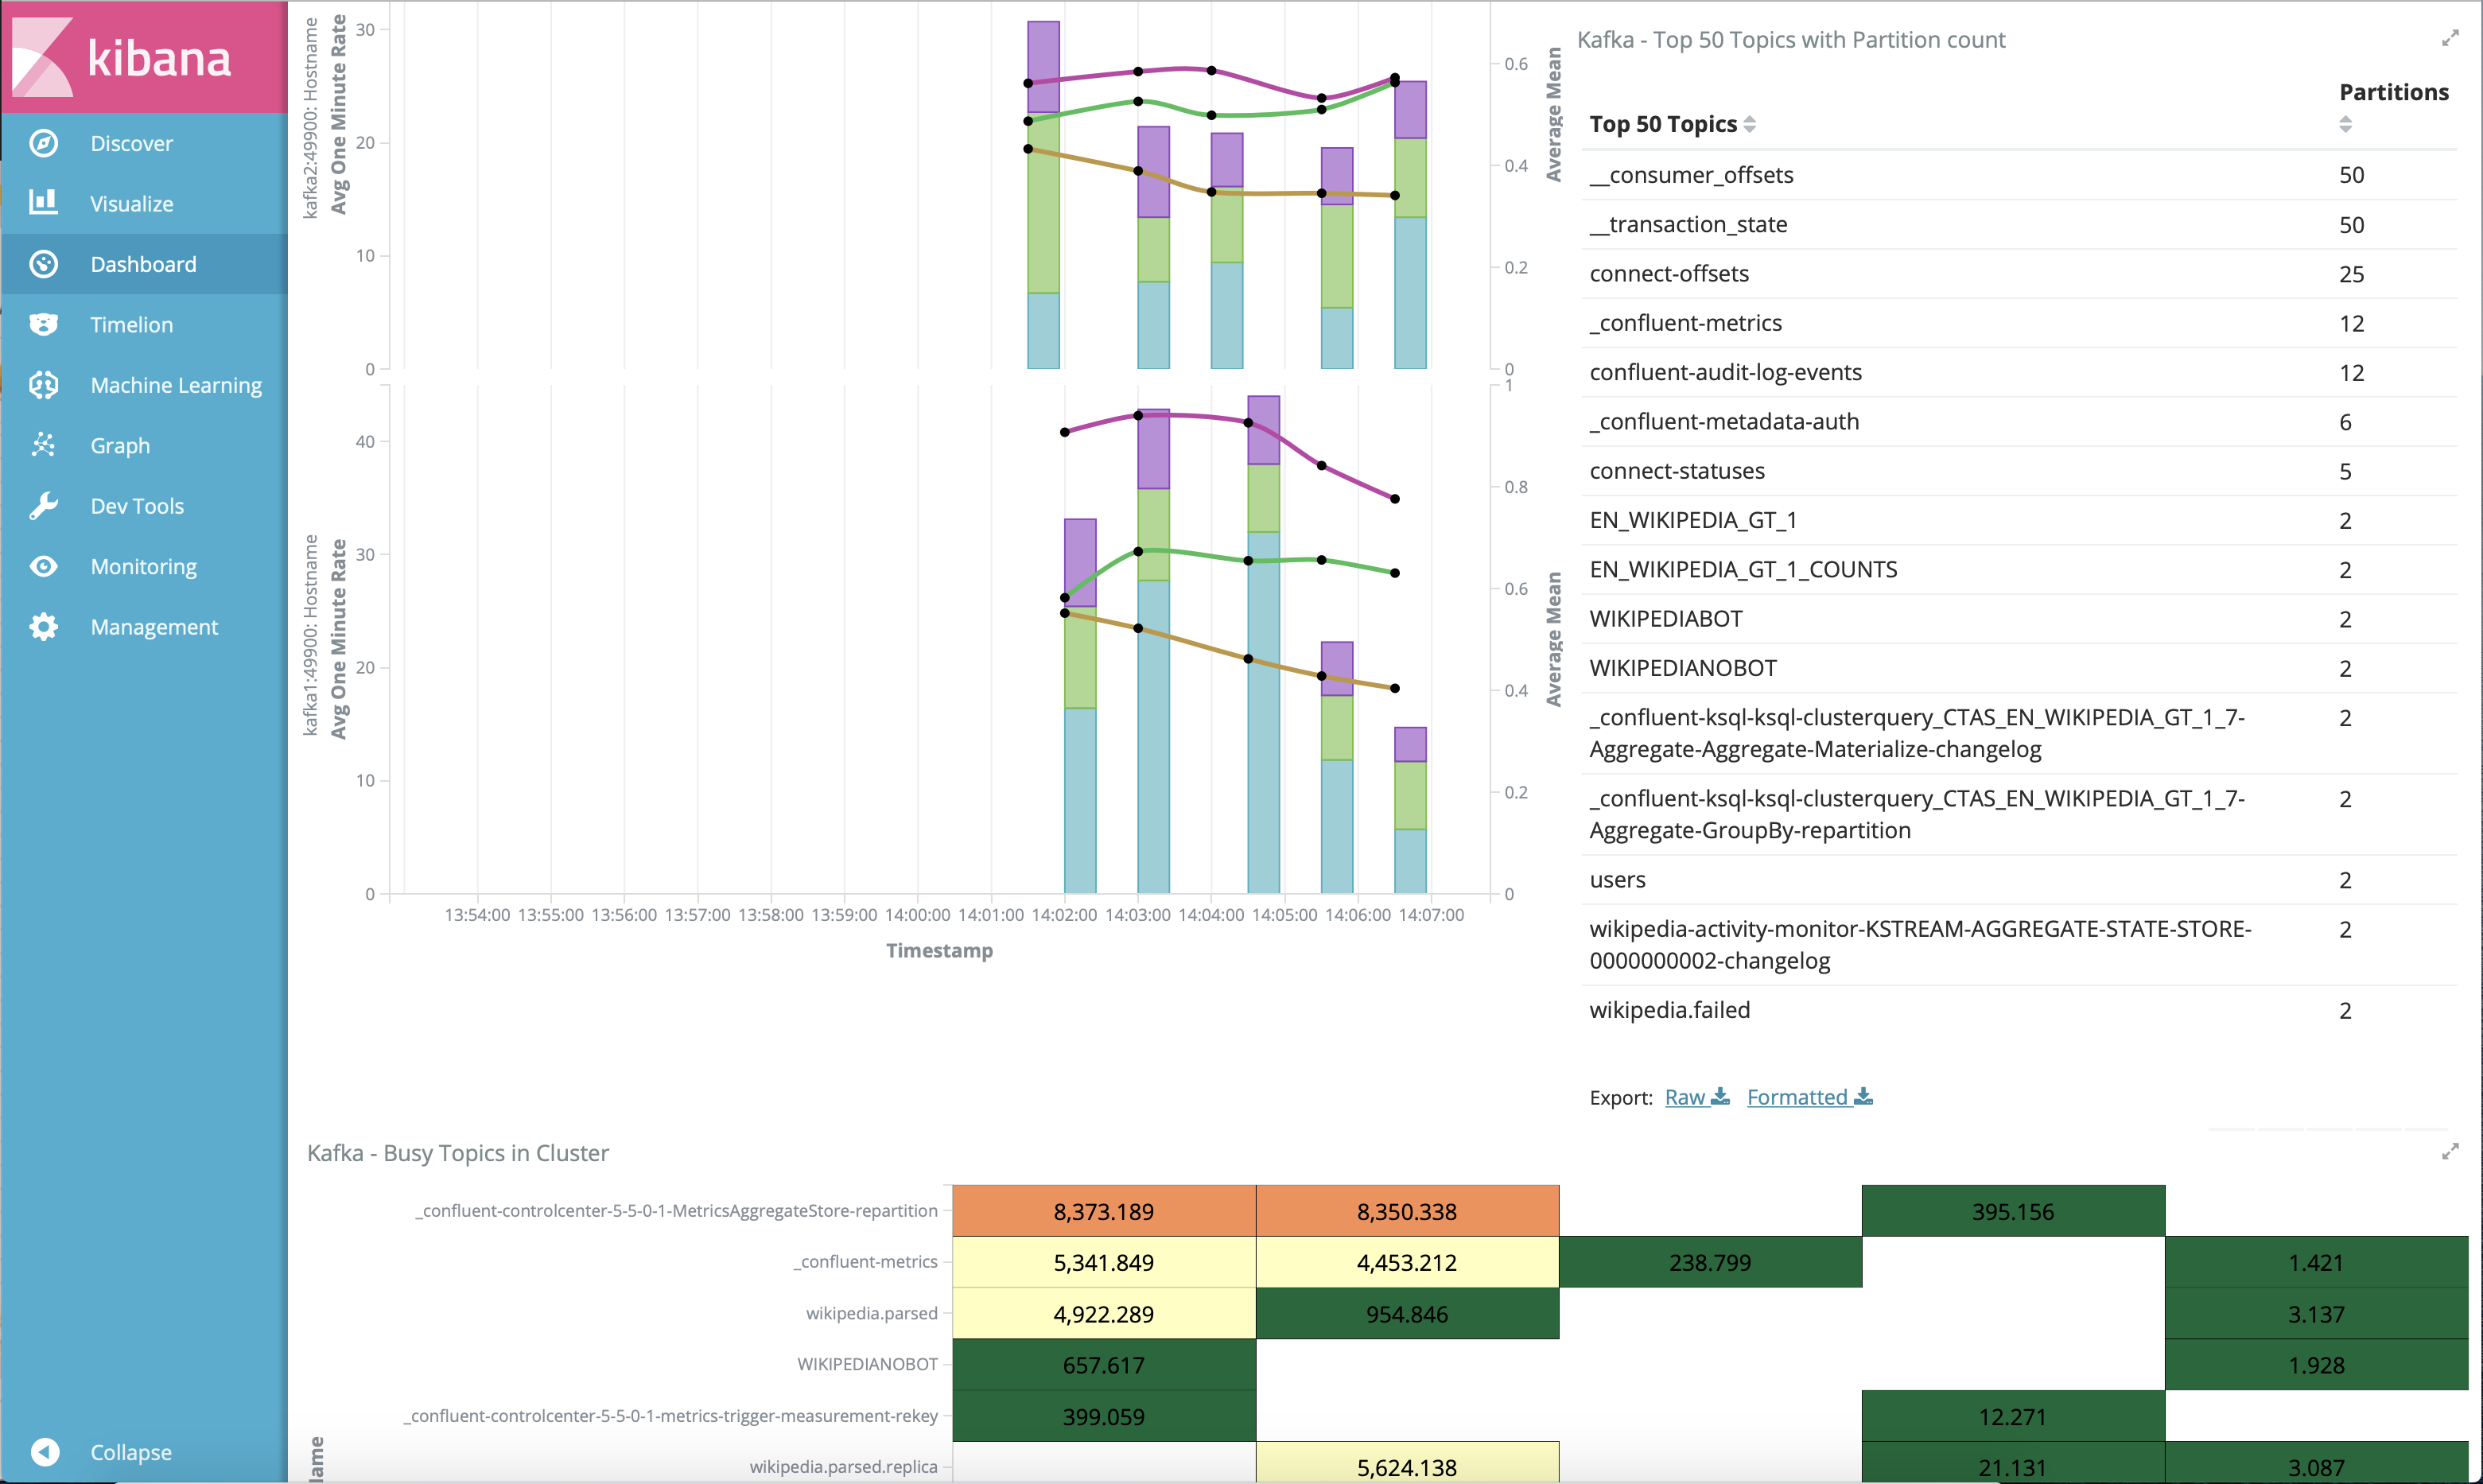
Jolokia + Elasticsearch + Kibana (runnable with cp-demo from https://github.com/confluentinc/jmx-monitoring-stacks):
Monitoring Confluent Platform with Datadog:
Troubleshooting
Here are some suggestions on how to troubleshoot the example.
Verify the status of the Docker containers show
Upstate, except for thekafka-clientcontainer which is expected to haveExit 0state.docker-compose psYour output should resemble:
           Name                          Command                  State                                           Ports
------------------------------------------------------------------------------------------------------------------------------------------------------------
connect                       bash -c sleep 10 && cp /us ...   Up             0.0.0.0:8083->8083/tcp, 9092/tcp
control-center                /etc/confluent/docker/run        Up (healthy)   0.0.0.0:9021->9021/tcp, 0.0.0.0:9022->9022/tcp
elasticsearch                 /bin/bash bin/es-docker          Up             0.0.0.0:9200->9200/tcp, 0.0.0.0:9300->9300/tcp
kafka-client                  bash -c -a echo Waiting fo ...   Exit 0
kafka1                        bash -c if [ ! -f /etc/kaf ...   Up (healthy)   0.0.0.0:10091->10091/tcp, 0.0.0.0:11091->11091/tcp, 0.0.0.0:12091->12091/tcp,
                                                                              0.0.0.0:8091->8091/tcp, 0.0.0.0:9091->9091/tcp, 9092/tcp
kafka2                        bash -c if [ ! -f /etc/kaf ...   Up (healthy)   0.0.0.0:10092->10092/tcp, 0.0.0.0:11092->11092/tcp, 0.0.0.0:12092->12092/tcp,
                                                                              0.0.0.0:8092->8092/tcp, 0.0.0.0:9092->9092/tcp
kibana                        /bin/sh -c /usr/local/bin/ ...   Up             0.0.0.0:5601->5601/tcp
ksqldb-cli                    /bin/sh                          Up
ksqldb-server                 /etc/confluent/docker/run        Up (healthy)   0.0.0.0:8088->8088/tcp
openldap                      /container/tool/run --copy ...   Up             0.0.0.0:389->389/tcp, 636/tcp
restproxy                     /etc/confluent/docker/run        Up             8082/tcp, 0.0.0.0:8086->8086/tcp
schemaregistry                /etc/confluent/docker/run        Up             8081/tcp, 0.0.0.0:8085->8085/tcp
streams-demo                  /app/start.sh                    Up             9092/tcp
tools                         /bin/bash                        Up
zookeeper                     /etc/confluent/docker/run        Up (healthy)   0.0.0.0:2181->2181/tcp, 2888/tcp, 3888/tcp
If any containers are not in
Upstate, verify in the advanced Docker preferences settings that the memory available to Docker is at least 8 GB (default is 2 GB).For those Docker containers that are not in
Upstate, view the container’s logs with the commanddocker-compose logs [container]and look for error messages and exceptions.docker-compose logsTo view sample messages for each topic, including
wikipedia.parsed:./scripts/consumers/listen.sh
If a command that communicates with ZooKeeper appears to be failing with the error
org.apache.zookeeper.KeeperException$NoAuthException, change the container you are running the command from to be eitherkafka1orkafka2. This is because ZooKeeper is configured for SASL/DIGEST-MD5, and any commands that communicate with ZooKeeper need properties set for ZooKeeper authentication.Run any of the validation scripts to check that things are working.
cd scripts/validate/
If you are running
cp-demofor a long time and issuing Confluent CLI commands on thetoolscontainer that return:Your token has expired. You are now logged out. Error: You must log in to run that command.
Then run the following command, which refreshes the token by logging back in to MDS:
./scripts/helper/refresh_mds_login.sh
Teardown
Stop the consumer group
appto stop consuming from topicwikipedia.parsed. Note that the command below stops the consumers gracefully withkill -15, so the consumers follow the shutdown sequence../scripts/app/stop_consumer_app_group_graceful.sh
Stop the Docker environment, destroy all components and clear all Docker volumes.
./scripts/stop.sh