

Control Center for Confluent Platform
Confluent Control Center is a web-based tool for managing and monitoring Apache Kafka® in Confluent Platform. Control Center provides a user interface that enables you to get a quick overview of cluster health, observe and control messages, topics, and Schema Registry, and to develop and run ksqlDB queries.
This documentation covers Control Center, the version included with Confluent Platform 8.0 and later. For the version bundled with Confluent Platform 7.9 and earlier, see the Control Center (Legacy) documentation.
Control Center manages and monitors Confluent Platform. Control Center is not Confluent for Kubernetes (CFK), which deploys and operates Confluent Platform on Kubernetes. For CFK, see Confluent for Kubernetes.
New to Apache Kafka®? See the Apache Kafka 101 course.
Looking for a fully managed cloud-native service for Apache Kafka®?
Sign up for Confluent Cloud and get started for free using the Cloud quick start.
Install and access
Install Control Center with a supported version of Confluent Platform. For a quick local setup with Docker, see Quick start. For installation and configuration details, see Confluent Control Center Deployment Overview and Control Center Configuration Reference for Confluent Platform.
To access Control Center on the default host and port, go to: http://localhost:9021/
Monitoring services
Control Center monitors Confluent Platform by collecting metrics about brokers, topics, and consumer group lag.
For monitoring Connect, Replicator, and ksqlDB clusters and underlying resources, metrics aren’t collected. Control Center requests information from these services to display status.
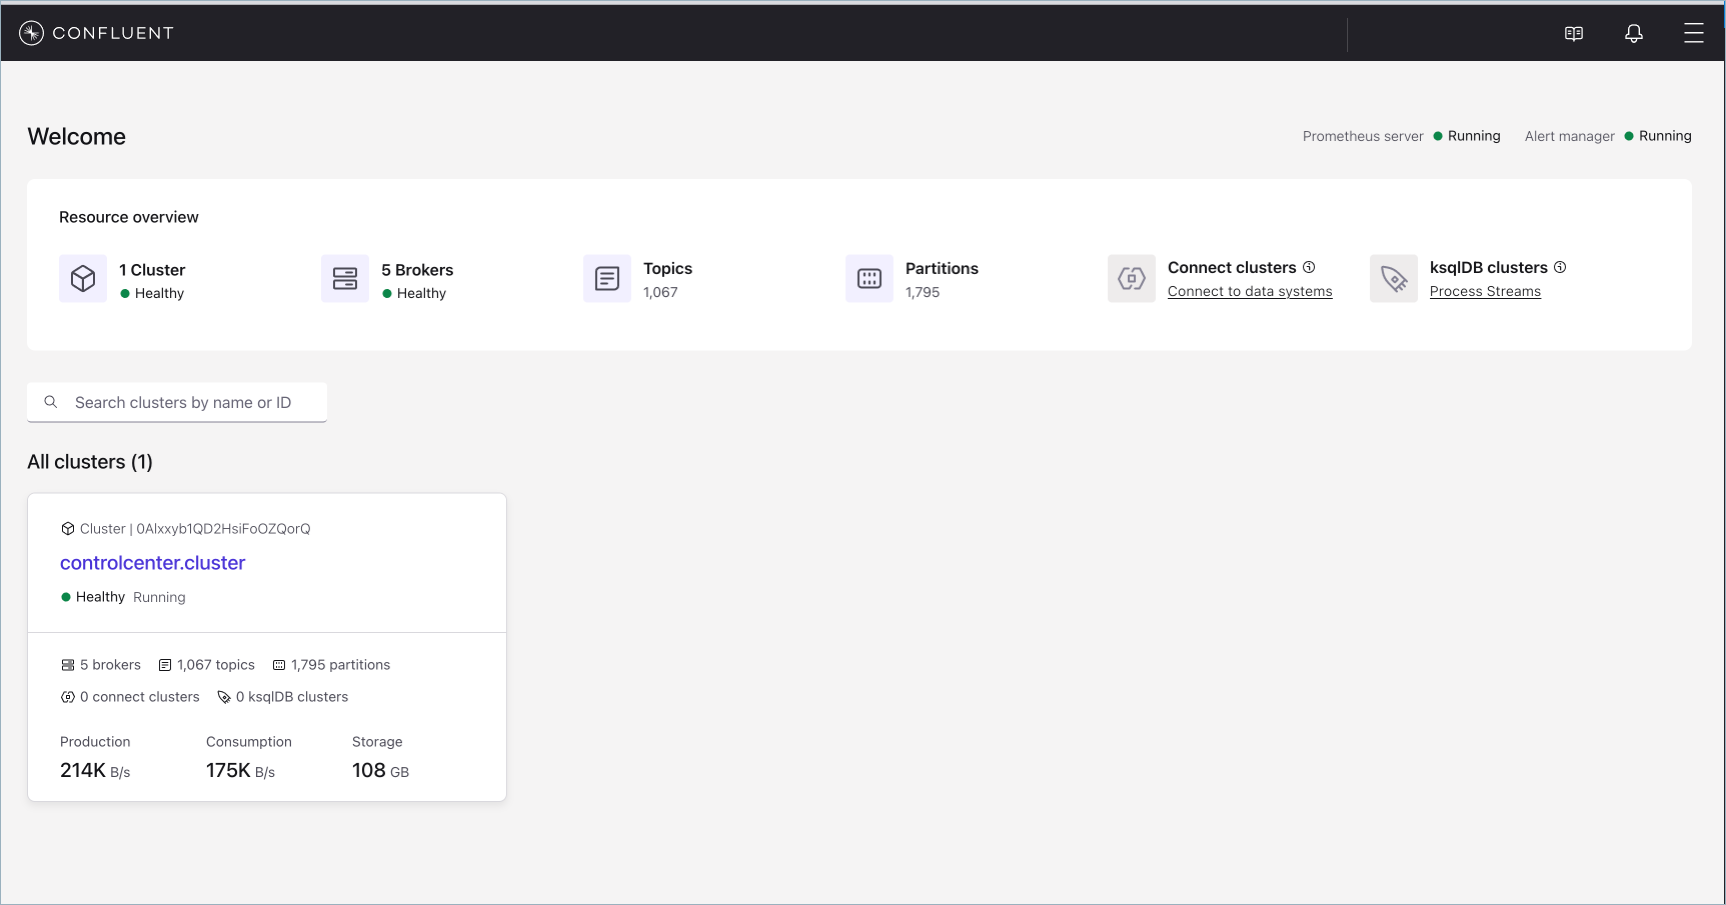
The following image shows an example of the monitoring capabilities of Control Center.
Management services
To provide management services, Control Center acts as a client that redirects requests to their appropriate servers. For example, Control Center redirects requests to update broker settings or create a topic to Kafka, and requests to create a connector to Kafka Connect.
Reduced infrastructure mode
To conserve resources, you can run Control Center in Reduced infrastructure mode. You don’t get any metrics or monitoring data in Reduced infrastructure mode. For more information, see Confluent Control Center Deployment Overview.
Configure Control Center to run in Reduced infrastructure mode with the mode property. If you don’t explicitly set Reduced infrastructure mode, you get metrics and monitoring.
Reduced infrastructure mode provides management services.
For Flink-only deployments, you can also run Control Center without a bootstrap Kafka cluster. For more information, see Kafka-less mode for Confluent Control Center.
Control Center features
Control Center includes the following pages where you can drill down to view data and configure features in your Kafka environment. The following table lists Control Center pages and what they display depending on the mode for Confluent Control Center.
Control Center feature |
Normal mode |
Reduced infrastructure mode |
|---|---|---|
View healthy and unhealthy clusters at a glance and search for a cluster that Control Center manages. Click on a cluster tile to drill into views of critical metrics and connected services for that cluster. |
View healthy and unhealthy clusters, the number of topics, and connected services. |
|
View broker partitioning and replication status, which broker is the active controller, and broker metrics like throughput and more. |
Same as Normal mode. To access the Brokers page in Reduced infrastructure mode, Use the Brokers navigation menu entry. |
|
Add and edit topics, view production and consumption metrics for a topic. Browse, create, and download messages, and manage Schema Registry for topics. |
Add and edit topics. Browse, create, download messages, and manage Schema Registry for topics. Internal topics aren’t created in Reduced infrastructure mode. |
|
Manage, monitor, and configure connectors with Kafka Connect, the toolkit for connecting external systems to Kafka. |
Same as Normal mode. |
|
Develop applications against ksqlDB, the streaming SQL engine for Kafka. Use the ksqlDB page in Control Center to: run, view, and stop SQL queries; browse and download messages from query results; add, describe, and drop streams and tables; and view schemas of available streams and tables in a cluster. |
Same as Normal mode. |
|
Monitor client metrics for producers and consumers. For a selected Kafka cluster, view data about consumer groups and lag, including the number of consumers in each group. |
For a selected Kafka cluster, view data about consumer groups, including the number of consumers in each group, the number of topics being consumed, and the consumer lag across all relevant topics. |
|
Monitor and configure replicated topics and create replica topics that preserve topic configuration in the source cluster. |
Configure replicated topics and create replica topics that preserve topic configuration in the source cluster. |
|
View and edit cluster properties and broker configurations. |
Same as Normal mode. |
|
Use Alerts to define the trigger criteria for anomalous events that occur during data monitoring and to trigger an alert when those events occur. Set triggers, actions, and view alert history across all your Control Center clusters. |
No Alerts are supported. |
Control Center security
Control Center offers security options for authentication and authorization to help you secure your deployment. For more information, see the following topics: