Important
You are viewing documentation for an older version of Confluent Platform. For the latest, click here.
Alerts
Control Center provides functionality for detecting anomalous events in your monitoring data and performing actions when those events occur.
Concepts
Triggers can be defined for topics, brokers, consumer groups, and clusters. Each trigger is based on a metric with condition value criteria that determines when the trigger should fire. Any actions associated with the trigger are executed when the criteria is met.
Detection of anomalous events (triggering criteria) is decoupled from the alert actions that should be taken when a triggering event occurs. This means that triggers and actions are defined independently, which provides flexibility when setting one or more actions to perform when a trigger fires.
Each time interceptor data is received by Control Center, metric values (consumption difference and latency) of the corresponding time windows are updated to reflect the new data. All newly updated metric values are then checked against all configured triggers to determine whether a trigger should fire.
Note
Interceptors can conceivably report data related to any time - alerting works across all time windows, not just those near real time.
A trigger can be associated with any number of defined actions. When a trigger fires, it causes all associated actions to be executed for which the max send rate of the action has not been exceeded. If the max send rate of a particular action has been exceeded, the trigger event is added to a list queue associated with the action and is included in the action event the next time it is executed (actions can report a set of triggers, not just one trigger).
Buffer for consumer group triggers
Because of normal lag in the system, time windows close to real time will frequently have associated metric values that would be cause for concern if the time window was further behind real time. For this reason, triggers for consumer groups have an associated buffer value. The buffer allows you to require an alertable state to persist for a configurable period of time to alleviate prematurely activating a consumer group trigger.
A triggered event that is within buffer seconds of real time is not immediately registered against actions. When the time window ultimately moves greater than the buffer seconds behind real time, any associated metric value that would still cause a trigger to be fired is then registered against any appropriate actions.
Note
Setting a condition for the buffer in seconds is only applicable to consumer group triggers.
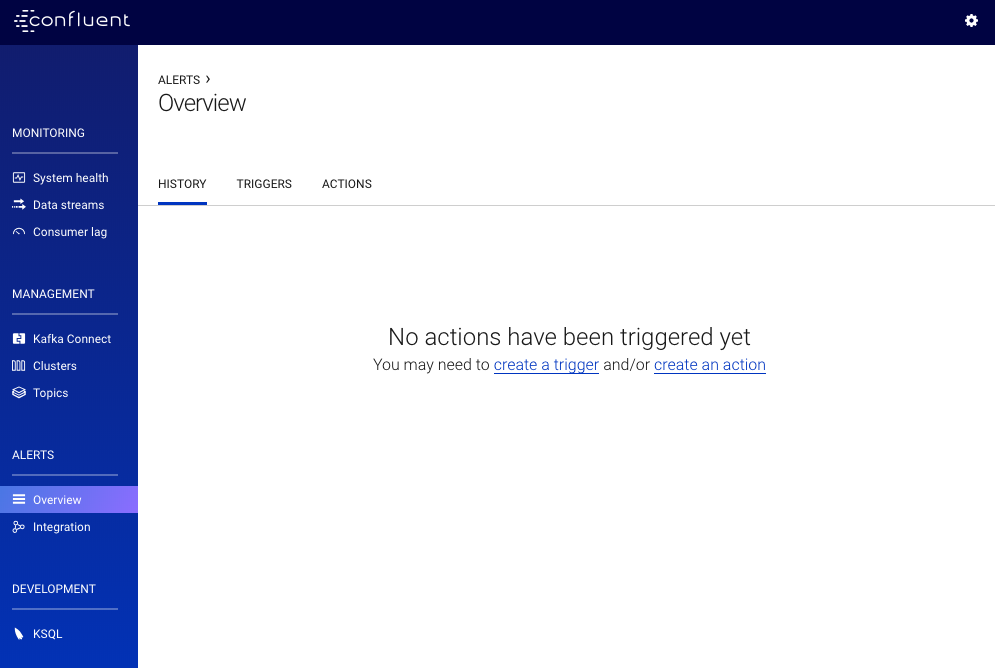
Overview page
To access the Alerts Overview page, from the navigation menu, click Alerts -> Overview.
The Overview page has the following main sections, accessible by clicking the tabs:
- HISTORY - Historical alert log
- TRIGGERS - Trigger Management
- ACTIONS - Actions Management
Trigger Management
Clicking on the Triggers tab shows a summary of all configured triggers:

Initially, the page is blank when there aren’t any triggers defined yet.
You can edit or delete an existing trigger using the edit or delete links in this table, or create a new trigger using the + New trigger button.
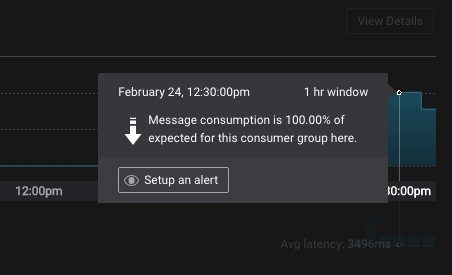
You can also initiate creating a new trigger by clicking on a consumer group delivery or latency monitoring chart progress indicator, and clicking the Set up an alert button. This pre-populates the new trigger form with relevant information.
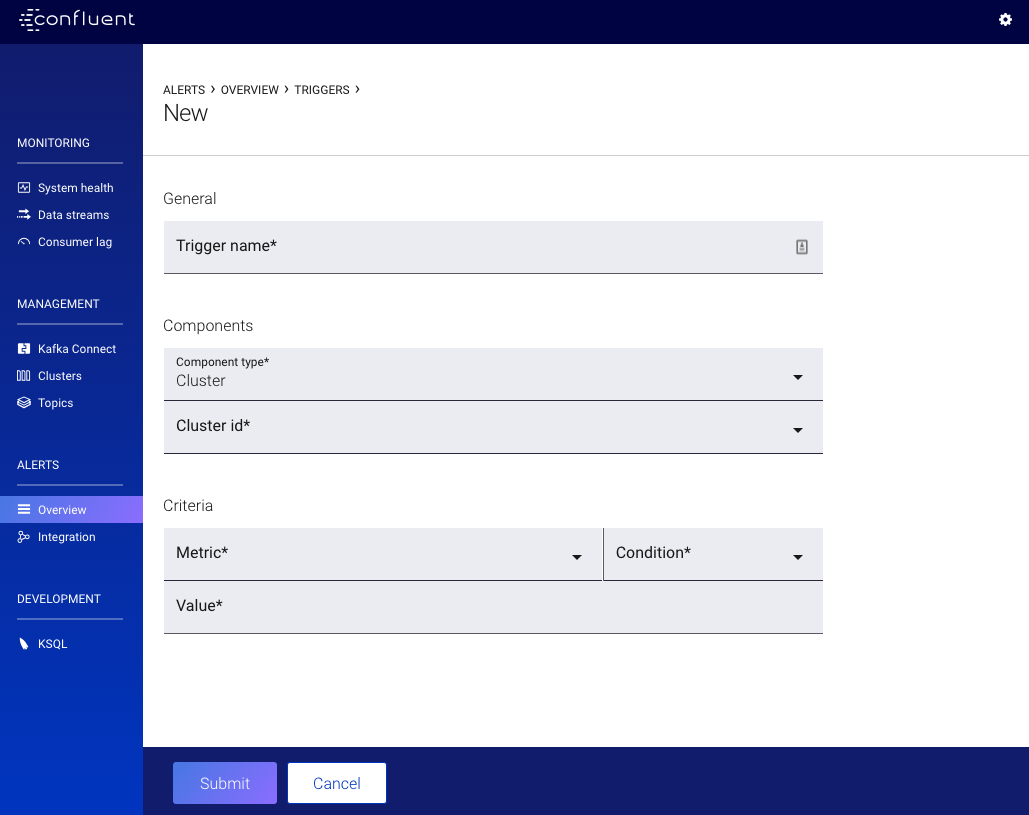
New/Edit Trigger Form
Complete the New Trigger form to define the criteria that will activate associated alert actions. Some of the fields are already populated for you when you clicked Set up an alert from a context menu.
The following types of triggers can be created:
Topic Triggers
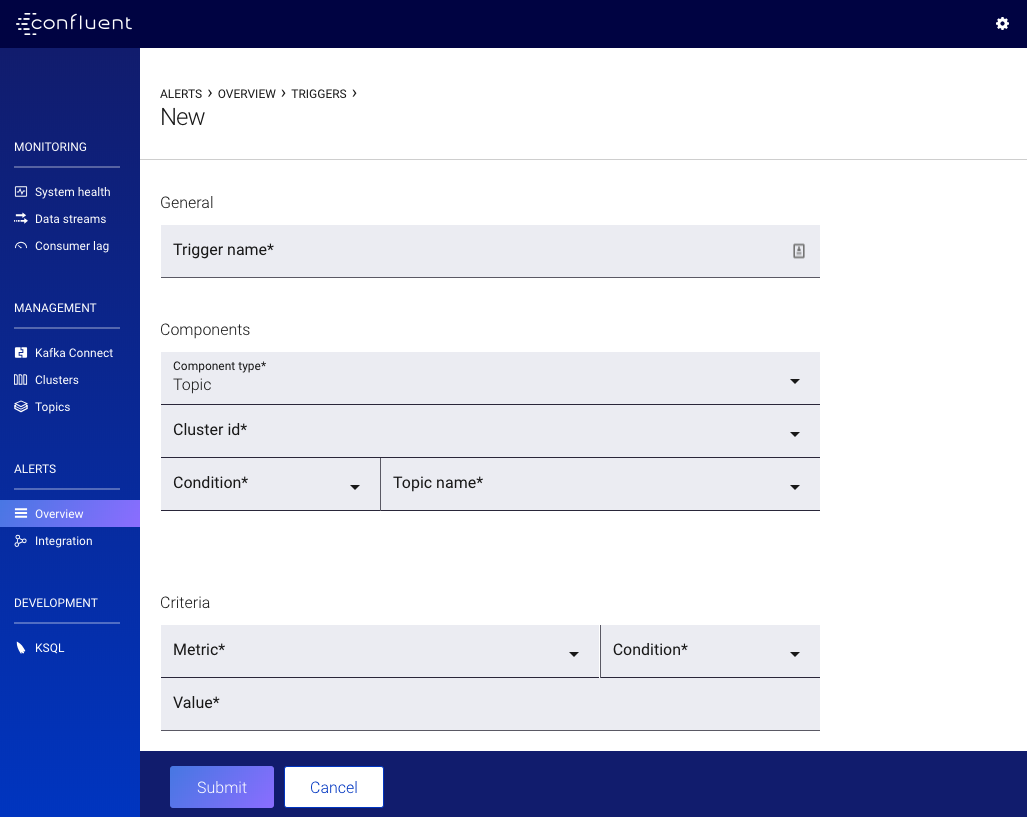
- Trigger name
- A unique name used to identify the trigger (for example: topic name production requests). Uniqueness is not enforced but you should use different names to avoid confusion.
- Component type
- Should be pre-selected as Topic if you clicked Set up an alert from the System Health > Topics tab. Otherwise, select Topic.
- Cluster id
- The trigger for a topic is limited to a specific cluster ID. If you require a topic to be triggered by multiple clusters, create independent triggers for each cluster.
- Condition
A select list of options for matching against the value field (below). The name of the topic can Equals, Begins with, Ends with, or Contains a specified value.
Note
For example, selecting Contains and then entering ‘topic’ into the value field will match ‘my topic’, ‘topical’, and ‘topics with data’. If Begins with is selected, the trigger will only match ‘topical’ and ‘topics with data’, not ‘my topic’.
- Topic name
The name or part of a topic name to be triggered against. Works in conjunction with Condition in order to match against one or many topics.
Note
If multiple topics match against topic name, the trigger will be per topic, not aggregate. In the case where there are two topics that Begin with ‘topic’, and the trigger is set to Bytes in greater than 100, any topic will fire the trigger if they get > 100 Bytes In.
Warning
A message appears when there are greater than five topics that match the criteria. Narrow the criteria when you see this message.
- Metric
The value to check for the trigger alert. Possible values are:
- Bytes in
- Amount of bytes per second coming in to a topic.
- Bytes out
- Amount of bytes per second going out from a topic (does not account for internal replication traffic).
Note
Prior to Apache Kafka® 0.11.0.0, the
BytesOutPerSecaccounted for traffic from the consumer and internal replication. This has been changed to only account for consumer traffic for this topic. Please adjust alerts accordingly.- Out of sync replica count
- Total number of topic partition replicas in the cluster that are in sync with the leader; i.e., sum of each { topic partition * topic replication factor }.
- Production request count
- Amount of production requests per second to a topic in a cluster.
- Under replicated topic partitions
- Amount of under replicated topic partitions. A use case for this metric would be wanting to know if a Kafka broker crashed while holding a specific topic partition.
- Condition
- The trigger will fire when Condition is true for the difference between the value of the metric being monitored and the value of the Value field. Possibly Greater than, Less than, Equal to, or Not equal to.
- Value
- The value to which the topic Metric is compared.
Consumer Group Triggers
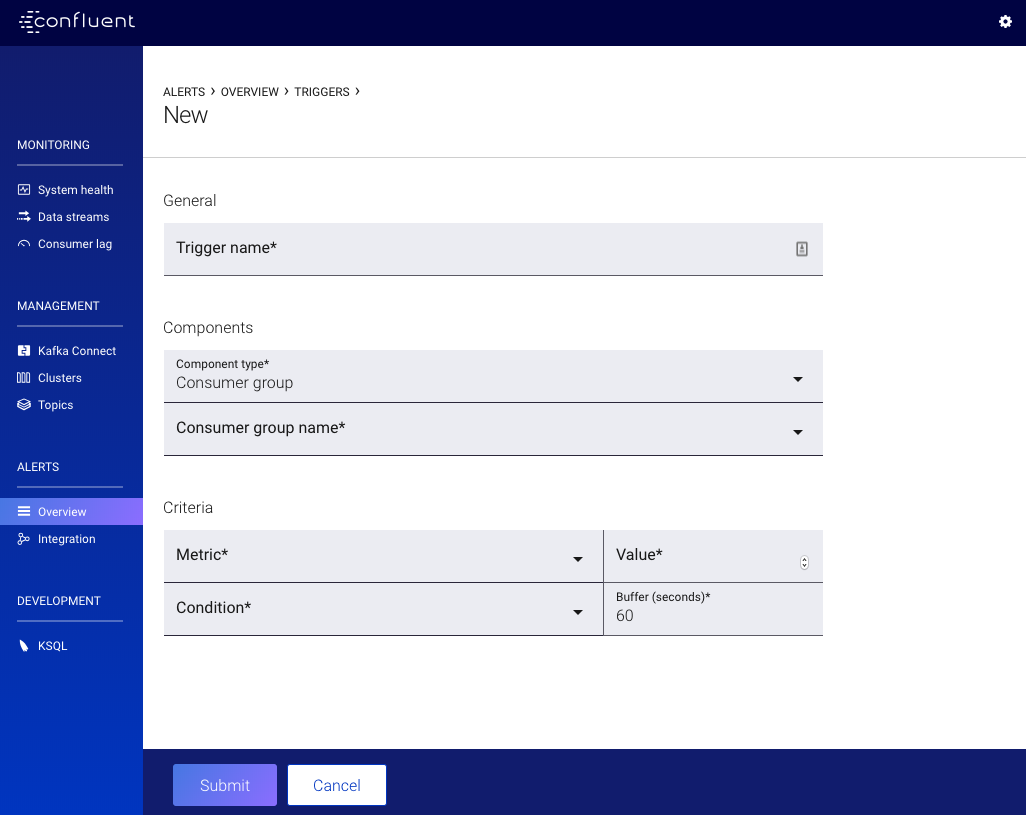
- Trigger name
- A unique name used to identify the trigger (for example: consumer group name under consumption). Uniqueness is not enforced but you should use different names to avoid confusion.
- Component type
- Should be selected as ‘Consumer group’. If this is not the case, see the other form trigger documentation.
- Consumer group name
- The name of the consumer group to monitor for anomalies.
- Metric
- The metric to monitor. One of maximum latency (ms), average latency (ms) or consumption difference.
- Condition
- The trigger will fire when Condition is true of the difference between the value of the metric being monitored and the value of the Value field. Possibly Greater than, Less than, Equal to, or Not equal to.
- Value
- The value to which the monitored consumer group Metric is compared.
- Buffer
- The delay behind real time to wait until a time window is considered for triggering (refer to Concepts for more information).
Cluster Triggers
- Trigger name
- A unique name that identifies the trigger (for example: Cluster zookeeper down). Uniqueness is not enforced but you should use different names to avoid confusion.
- Clusters
One or many clusters to trigger based on conditions.
Note
If multiple clusters are selected, the trigger will be per cluster, not aggregate, but not in all cases. See below for more details.
- Metric
Values in Metric are triggered on a cluster-wide basis.
Important
Any cluster that meets the Condition below triggers an associated action.
- Under replicated topic partitions
Total number of topic partitions in the cluster that are under-replicated; i.e., partition with number of in-sync replicas less than replication factor.
A trigger should be created for values
> 0.- Offline topic partitions
Total number of topic partitions in the cluster that are offline. This can happen if the brokers with replicas are down, or if unclean leader election is disabled and the replicas are not in sync and thus none can be elected leader (may be desirable to ensure no messages are lost).
A trigger should be created for values
> 0.- ZooKeeper status
- Are brokers able to connect to ZooKeeper? ‘Offline’ / ‘Online’ are possible values.
- ZooKeeper expiration rate
- Rate at which brokers are experiencing ZooKeeper session expirations (number of expirations per second).
- Active controller count
The number of brokers in the cluster reporting as the active controller in the last interval.
A trigger should be created for values
!= 1.- Leader election rate
- Number of partition leader elections.
- Unclean election count
The number of unclean partition leader elections in the cluster reported in the last interval.
When unclean leader election is held among out-of-sync replicas, there is a possibility of data loss if any messages were not synced prior to the loss of the former leader. So if the number of unclean elections is greater than 0, investigate broker logs to determine why leaders were re-elected, and look for WARN or ERROR messages. Consider setting the broker configuration parameter
unclean.leader.election.enabletofalseso that a replica outside of the set of in-sync replicas is never elected leader.A trigger should be created for values
!= 0.- Condition
- The trigger will fire when Condition is true of the difference between the value of the metric being monitored and the value of the Value field. Possibly Greater than, Less than, Equal to, Not equal to, Online, or Offline, depending on the Metric selected.
- Value
- The value to which the cluster Metric is compared.
Broker Triggers
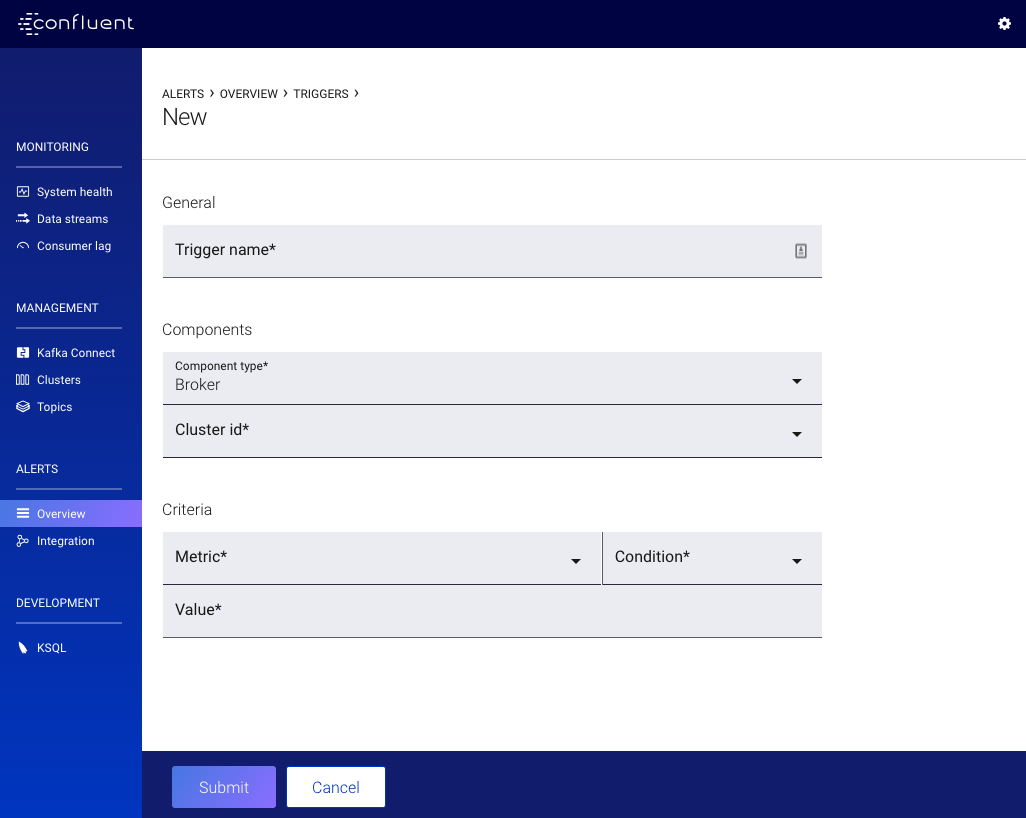
- Trigger name
- A unique name used to identify the trigger (for example: Broker fetch request latency). Uniqueness is not enforced but you should use different names to avoid confusion.
- Broker clusters
One or many clusters to trigger based on conditions of individual brokers.
Note
If multiple clusters are selected, the trigger will be per cluster, not aggregate, but not in all cases. See below for more details.
- Metric
Values in Metric are triggered on a per broker basis.
Important
Any broker that meets the Condition below will trigger discretely.
- Bytes in
- Number of bytes per second produced a broker.
- Bytes out
- Number of bytes per second fetched from a broker (does not account for internal replication traffic).
Note
Prior to Kafka 0.11.0.0, the
BytesOutPerSecaccounted for traffic from the consumer and internal replication. This has been changed to only account for consumer traffic for this broker. Please adjust alerts accordingly.- Production request latency
- Latency of produce requests to this broker at the median, 95th, 99th, or 99.9th percentile (in milliseconds).
- Production request count
- Total number of produce requests to a broker (requests per minute).
- Fetch request latency
- Latency of fetch requests to this broker at the median, 95th, 99th, or 99.9th percentile (in milliseconds).
- Condition
- The trigger will fire when Condition is true of the difference between the value of the metric being monitored and the value of the Value field. Possibly Greater than, Less than, Equal to, Not equal to, Online, or Offline, depending on the Metric selected.
- Value
- The value to which the broker Metric is compared.
Actions Management
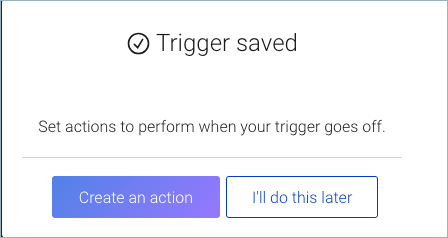
After creating a trigger, you are given the option to go to the action management page to associate it with one or more existing actions, or if none exist, create a new action.
Before being able to send email actions, you need to enable Email Settings and properly configure Control Center to communicate with your SMTP server.
At the very least, you need to set:
# this enables sending mail via c3
confluent.controlcenter.mail.enabled=true
# this is the host name of your mail server
confluent.controlcenter.mail.host.name=mymail.server
# this is the port your mail server is running on
confluent.controlcenter.mail.port=25
# Confluent also recommends setting rest.listeners explicitly as well because
# this will control the c3 link that is embedded in the
# body of any alert emails
confluent.controlcenter.rest.listeners=control-center.server
Clicking on the Actions tab shows a summary of all configured actions:
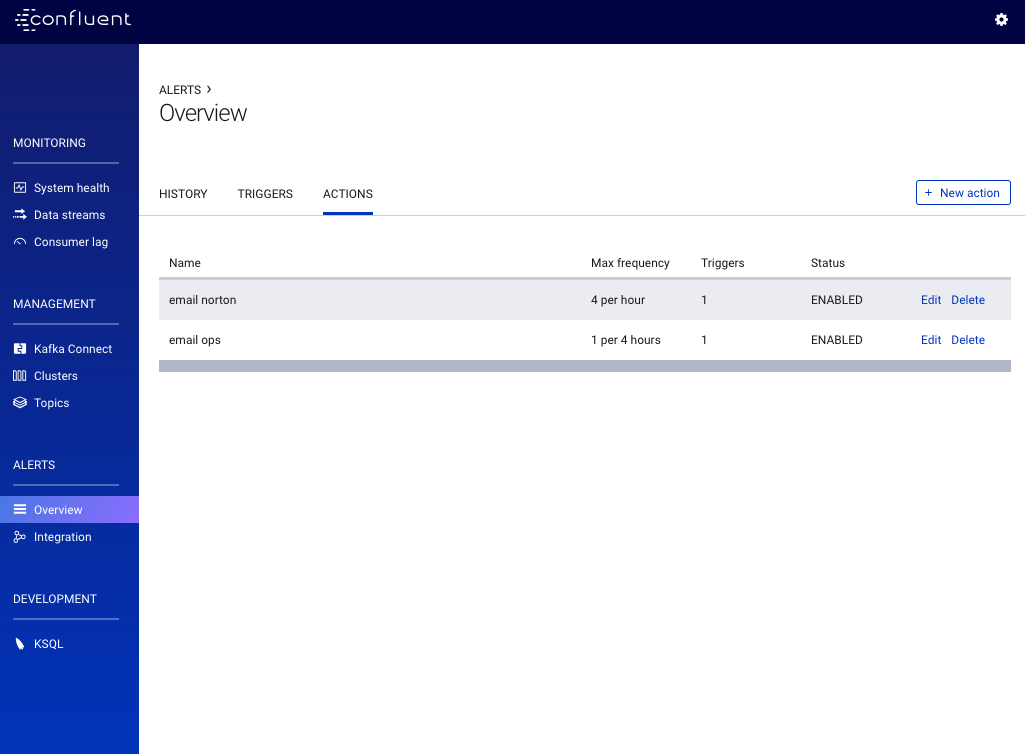
You can edit or delete an existing action using the edit or delete links, or create a new action using the + New action button.
New or Edit Action Form
Complete the Action form to specify the action to take when a defined trigger or triggers associated with the action is fired.
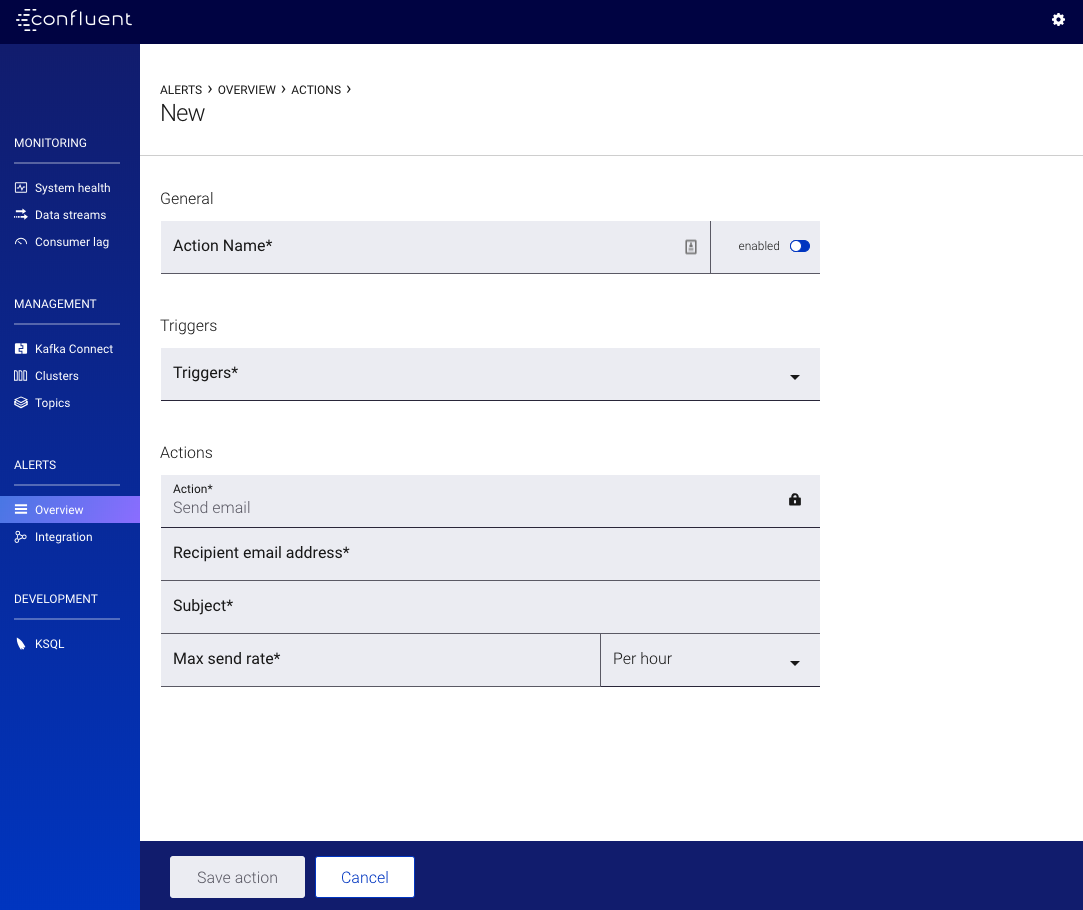
A description of each field follows (all fields are required):
- Action name
- A unique name for the action (for example: email DevOps on call). Uniqueness is not enforced, but you should use different names to avoid confusion.
- Enabled/Disabled
- You might need to temporarily disable actions. You can choose whether an action is currently enabled or disabled with this field.
- Triggers
- One or more triggers that will cause the action to execute. Refer to Concepts for more information.
- Action
- The type of action to perform. Currently, the only available action is Send email.
- Recipient email address
- The email address or addresses associated with this action. A message is sent to the specified email address each time the action is executed. Separate multiple email addresses with a comma.
- Subject
- The subject line of the email associated with the action.
- Max send rate
- The maximum rate at which the action should be executed. A value and frequency: Per hour (default), Per minute, Per 4 hours, Per 8 hours, Per day. For example, enter 1 and select Per day to send the alert once daily. Refer to Concepts for more information.
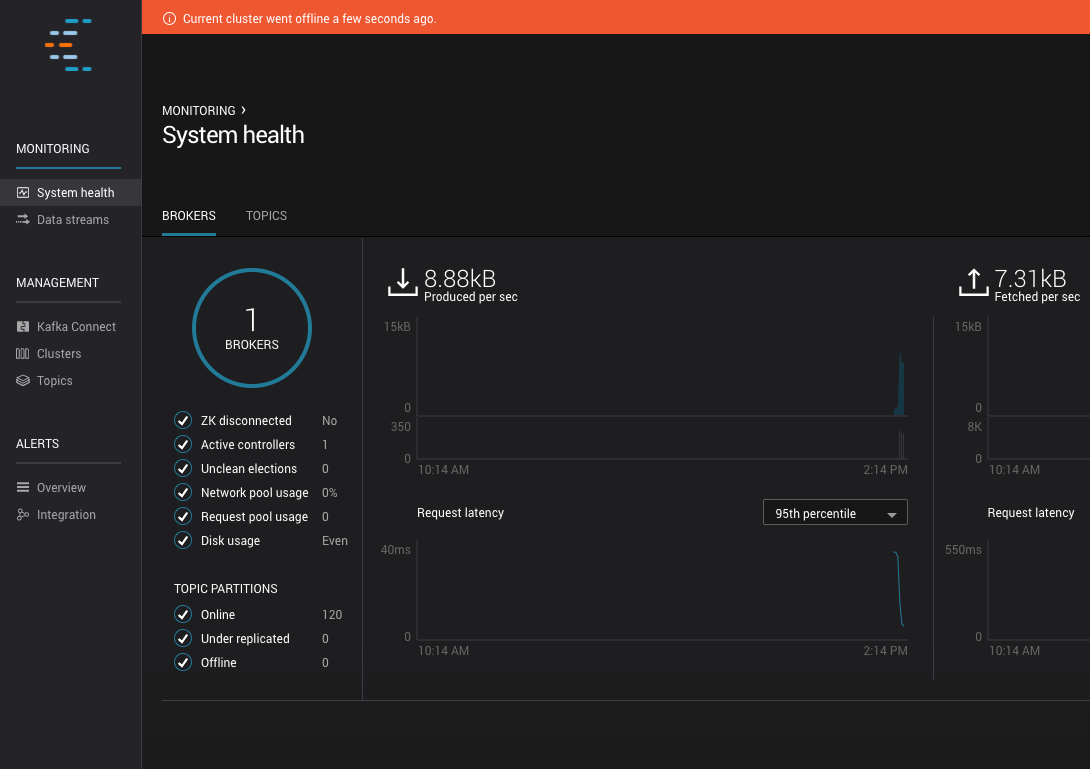
Control Center offline status
An red banner appears at the top of every page when Control Center goes offline. This happens when the Kafka cluster Control Center uses is offline or unreachable.
Create alerts for Control Center cluster offline status
If you want to send an email alert to recipients when the Control Center cluster goes offline, there are a few ways to create it:
Add the following lines to your properties file (
<path-to-confluent>/etc/confluent-control-center/control-center.properties).# Automatically create Control Center cluster down trigger and action pair during start up confluent.controlcenter.alert.cluster.down.autocreate=true confluent.controlcenter.alert.cluster.down.to.email=emailOnCall@example.com,emailDevOps@example.com confluent.controlcenter.alert.cluster.down.send.rate=12
Note
You can edit the auto-created trigger and actions in the Alerts UI.
Using the trigger UI and the action UI.
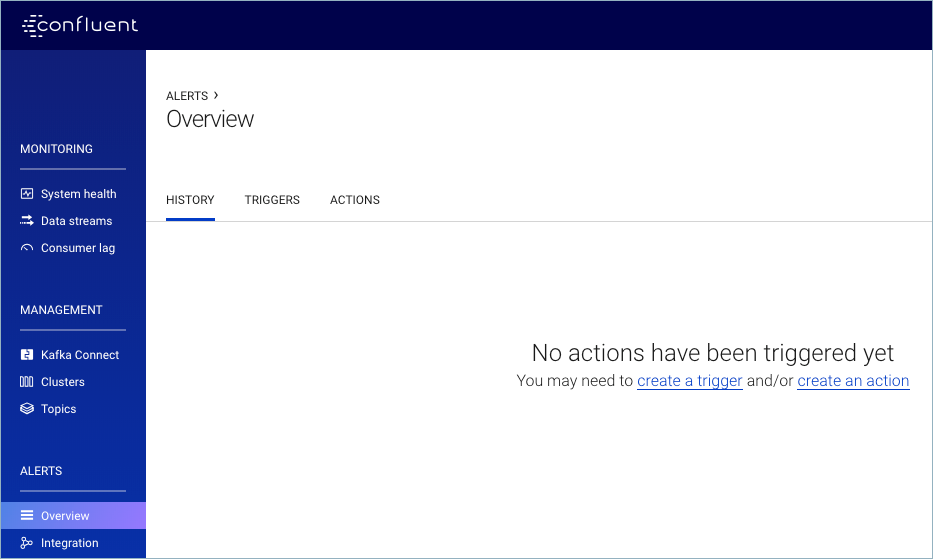
Alerts History
To access the Alerts Overview page, from the navigation menu, click Alerts -> Overview. The History page displays by default. Initially, the page is blank when there isn’t any trigger history yet:
After actions have been triggered, the History page shows a summary of triggers that caused an action to be executed. The alert history does not list every triggered event:
- Any alerts triggered by consumer lag, cluster status, or broker status events do not populate history. Alert emails sent do not contain an email link to alerts history.
- Only alerts triggered by topic status events (streams topology) populate history. Alert
emails are sent that contain an email link to alerts history, as
configured in
confluent.controlcenter.rest.listeners.
Integration (REST API) page
To access the Alerts Integration page, from the navigation menu, click Alerts -> Integration.
The REST API page provides details of the alerts REST endpoint that can be used to programmatically obtain historical alert information.
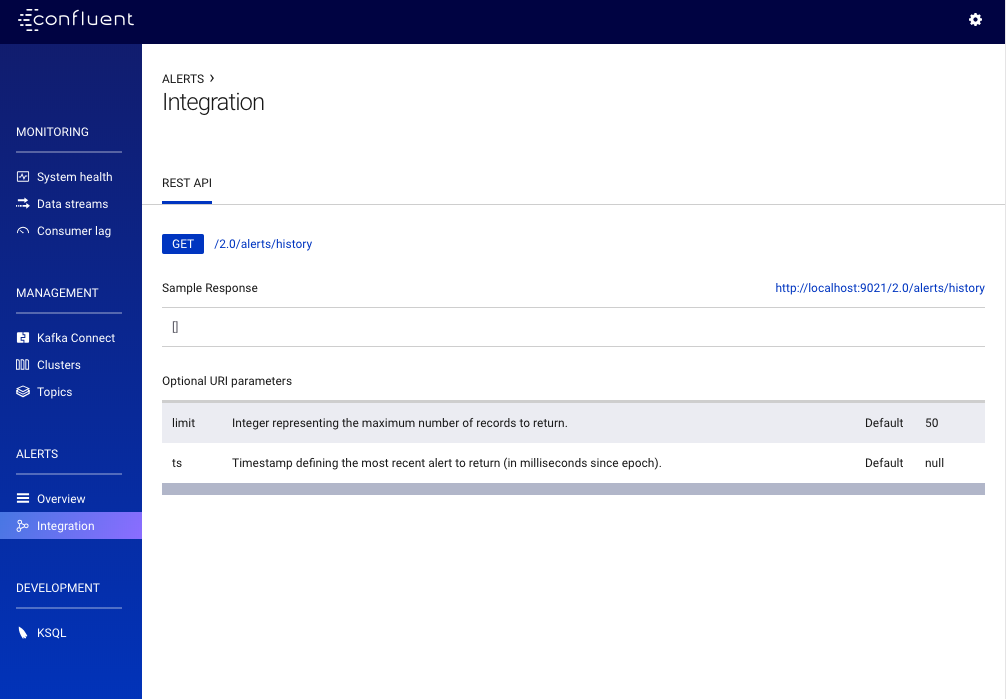
See REST API.
REST API
-
GET/2.0/alerts/history¶ Get the most recent alerts.
Query Parameters: - limit (int) – The maximum number of records to return
- ts (long) – The most recent alert to return (in milliseconds since epoch)
Response JSON Object: - guid (string) – The unique ID of this alert
Response JSON Array of Objects: - timestamp (string) – Milliseconds since the epoch when this alert was issued
- monitoringTrigger (map) – Trigger definition that caused this alert to be issued
- monitoringTrigger.guid (string) – The unique ID of this trigger
- monitoringTrigger.name (string) – The name of this trigger
- triggers (array) – The trigger cause associated with monitoringTrigger
- triggers[i].window (string) – Milliseconds since the epoch associated with the underlying data that caused this trigger was issued
- actions (array) – Actions taken due to the firing of monitoringTrigger
- actions[i].guid (string) – The unique ID of the action taken
- actions[i].name (string) – The name of the action taken
- actions[i].email (map) – The email address that the alert was sent to
Example request:
GET /2.0/alerts/history HTTP/1.1
Accept: application/json
Example response:
HTTP/1.1 200 OK
Content-Type: application/json

[
  {
    "guid": "50c0e74a-6368-43bf-bff7-fa51beff9ad9",
    "timestamp": "1516207447488",
    "monitoringTrigger": {
      "guid": "c8d72271-9f57-44b5-a6a4-97c97f0d1668",
      "name": "rock-cg-0 consumption"
    },
    "triggers": [
      {
        "window": "1516207320000",
        "hasError": false,
        "component": {
          "componentId": "rock-cg-0"
        },
        "longValue": "0"
      }
    ],
    "actions": [
      {
        "guid": "f593d79d-1bb7-4179-8997-6a7c8045dd8e",
        "name": "1212",
        "email": {
          "address": "sdfsdf@lskdjf.com",
          "subject": "skldfjlsdkfj"
        }
      }
    ]
  }
]