Important
You are viewing documentation for an older version of Confluent Platform. For the latest, click here.
System Health
System Health provides insight into the well-being of the Apache Kafka® cluster from both a broker and topic-centric perspective. The two sections share many common features with each other, which will be outlined below.
Navigation
You can access system health by selecting the item labeled System health from the lefthand navigation.
Navigate between broker and topic views.

Click on the usage metrics on the lefthand navigation to see more detailed information.
Click on the ellipsis (
...) and select View details from each row of the topics table.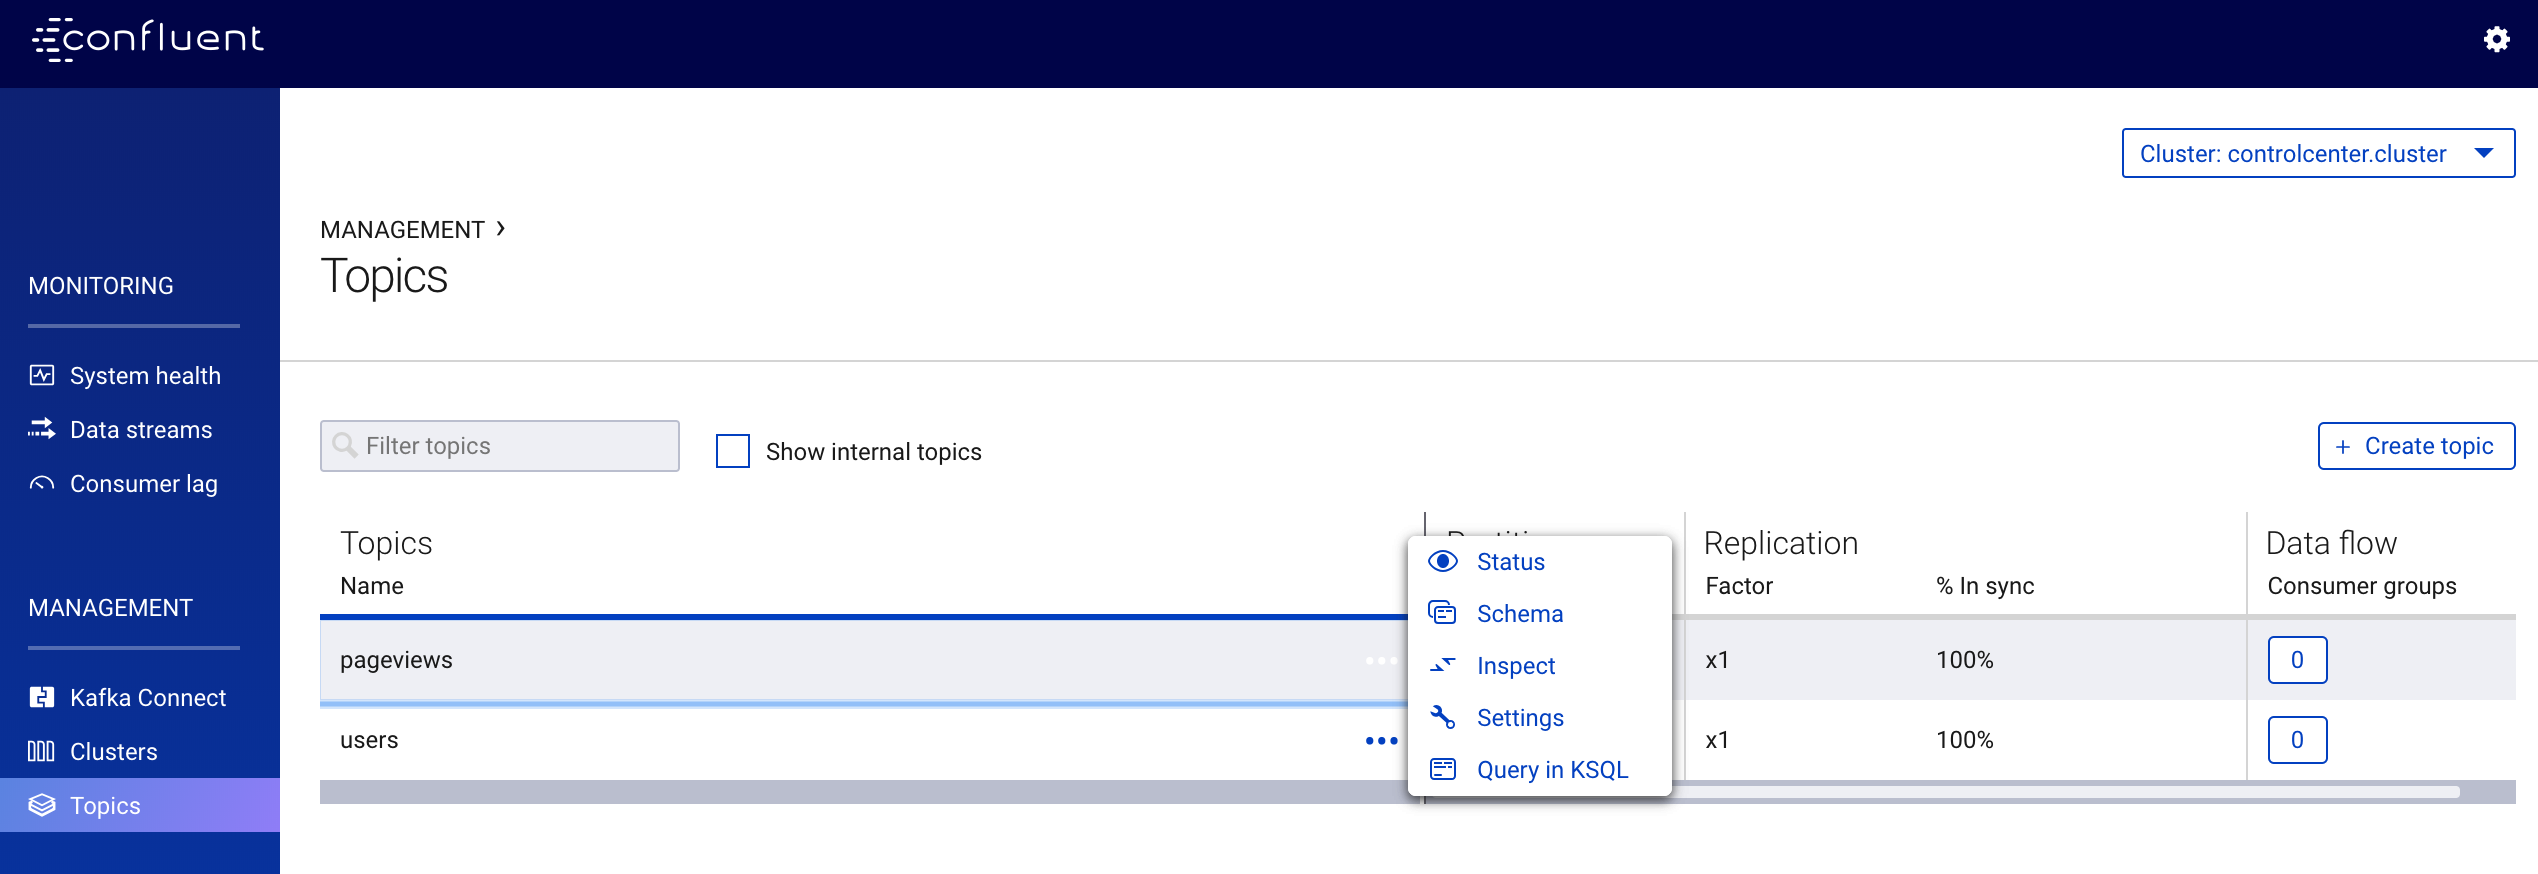
From the Broker view tab, you can select a percentile from the request latency percentile dropdown.
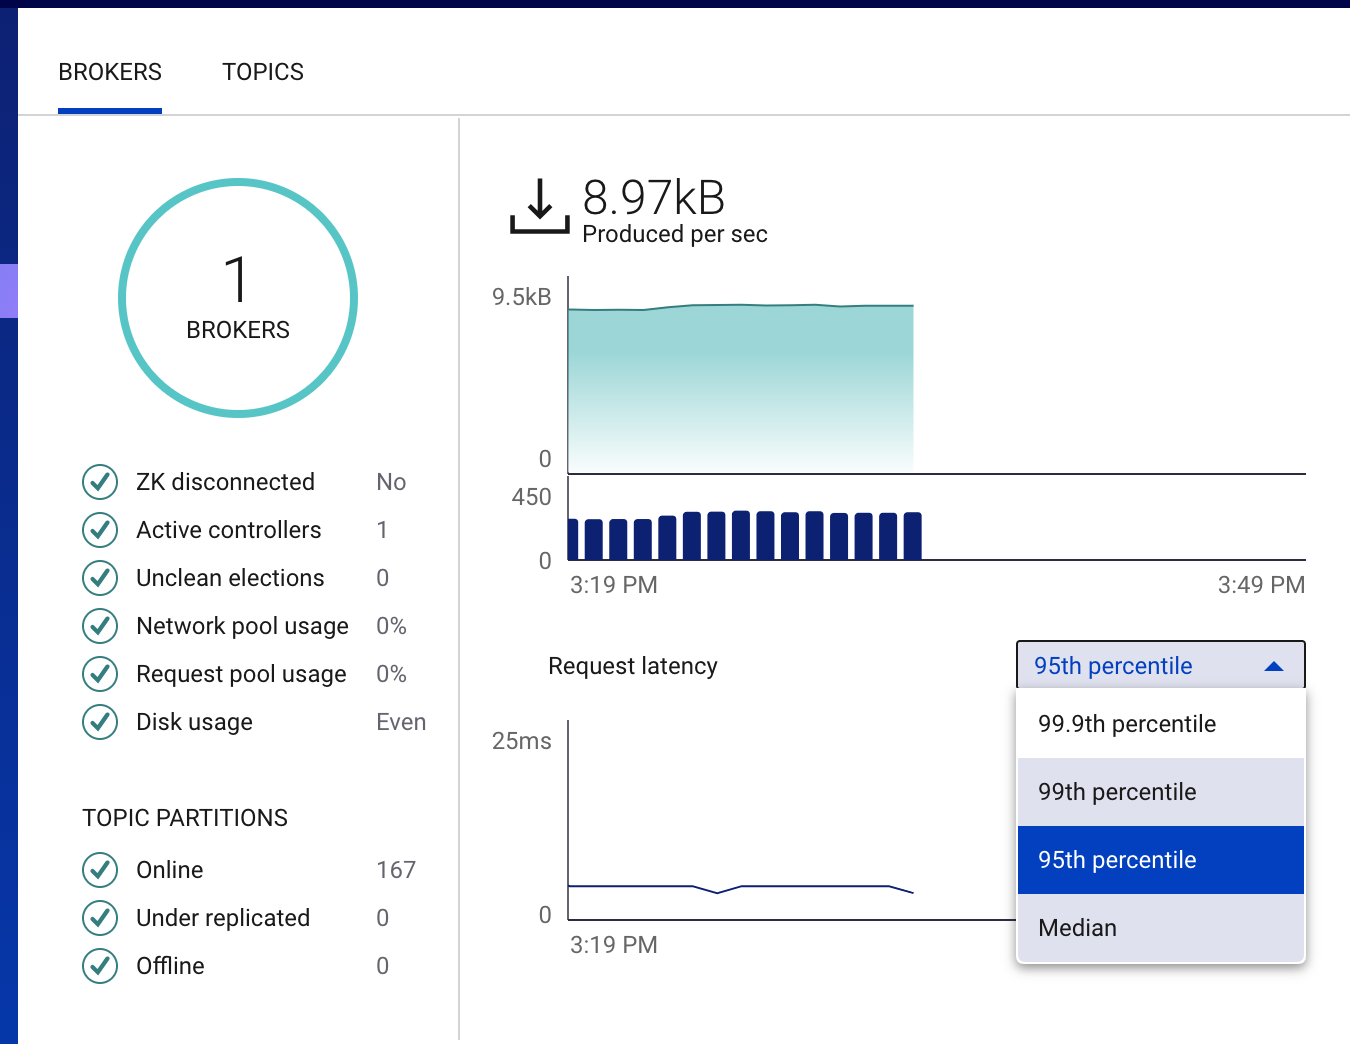
Tip
Request latency percentiles are only available in the Brokers tab.
UI Commonalities
- Chart Tooltips
- Each chart displays a similarly styled tooltip when hovering. These tooltips can display multiple metrics at the same time which are each paired with an icon. The icon will either be a (good) check mark or a (bad) X symbol at each point.
- Table Metric Validations
- Selected table metrics will visually change to indicate potential issues via a red underline. Hovering the mouse over text with a red underline displays an explanatory tooltip.
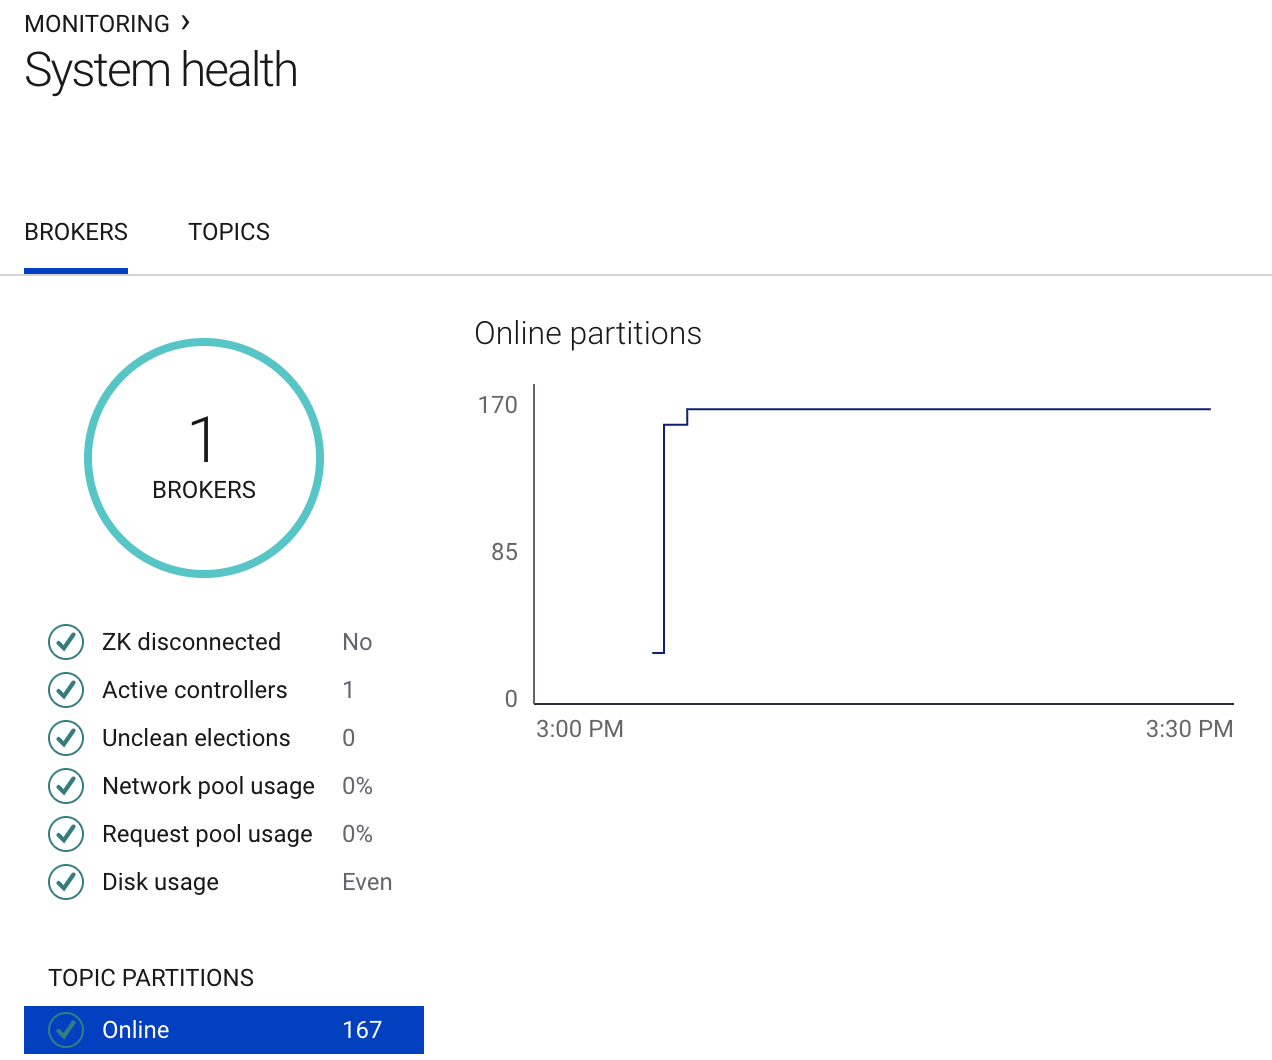
Broker Aggregate Metrics
- Broker count
- Total number of brokers in the cluster currently online and with Confluent Metrics Reporter enabled. If the broker count is less than the number of brokers in your cluster and you have under replicated topic partitions, then investigate the brokers that are missing from the broker table. Review the broker logs for WARN or ERROR messages.
- ZooKeeper disconnected
- At least one broker has disconnected from ZooKeeper in the last interval. If this is Yes, check network connectivity and latency between brokers and ZooKeeper, and verify ZooKeeper is running. Adjust the broker configuration parameter
zookeeper.session.timeout.msif needed. - Active controller
The number of brokers in the cluster reporting as the active controller in the last interval.
During steady state there should be only one active controller per cluster. If this is greater than 1 for only one minute, then it probably means the active controller switched from one broker to another. If this persists for more than one minute, troubleshoot the cluster for “split brain”.
- Unclean elections
The number of unclean partition leader elections in the cluster reported in the last interval.
When unclean leader election is held among out-of-sync replicas, there is a possibility of data loss if any messages were not synced prior to the loss of the former leader. So if the number of unclean elections is greater than 0, investigate broker logs to determine why leaders were re-elected, and look for WARN or ERROR messages. Consider setting the broker configuration parameter
unclean.leader.election.enabletofalseso that a replica outside of the set of in-sync replicas is never elected leader.- Network pool usage
- Average network pool capacity usage across all brokers, i.e. the fraction of time the network processor threads are not idle.
If network pool usage is above 70%, investigate the production request latency and fetch request latency metrics to isolate where brokers are spending the most time. Consider increasing the broker configuration parameter
num.network.threads. - Request pool usage
- Average request handler capacity usage across all brokers, i.e. the fraction of time the request handler threads are not idle.
If request pool usage is above 70%, investigate the production request latency and fetch request latency metrics to isolate where brokers are spending the most time. Consider increasing the broker configuration parameter
num.io.threads. - Disk usage
- Disk usage distribution across all brokers in a cluster. Disk usage is determined to be skewed if the relative mean absolute difference of all broker sizes exceeds 10% and the difference between any two brokers is at least 1GB. If disk usage is skewed, consider rebalancing the cluster using the ref:Confluent Auto Data Balancer <rebalancer>.
- Online topic partitions
- Total number of topic partitions in the cluster that are online, i.e. on running brokers. If the number of topic partitions online is less than the number of topic partitions in your cluster, investigate topic metrics shown in the Topics tab.
- Under replicated topic partitions
Total number of topic partitions in the cluster that are under-replicated; i.e., partition with number of in-sync replicas less than replication factor.
If the number of under replicated topic partitions is greater than 0, investigate topic metrics shown in the Topics tab and investigate the broker that is missing topic partitions. Review the broker logs for WARN or ERROR messages.
- Offline topic partitions
Total number of topic partitions in the cluster that are offline. This can happen if the brokers with replicas are down, or if unclean leader election is disabled and the replicas are not in sync and thus none can be elected leader (may be desirable to ensure no messages are lost).
If the number of offline topic partitions is greater than 0, investigate topic metrics shown in the Topics tab and investigate the broker that is missing topic partitions. Review the broker logs for WARN or ERROR messages.
Produce and Fetch Charts
When clients write data to Kafka, they send produce requests to leader brokers which handle the produce requests and send responses back to the client. When clients read data from Kafka, they send fetch requests to leader brokers which handle the fetch requests and send responses back to the client. It is important to monitor the throughput and latency of these produce and fetch requests to ensure your cluster is performing optimally.
On each of the broker and topic tabs of the System Health view, you will see a summary of the produce and fetch requests, as shown below.
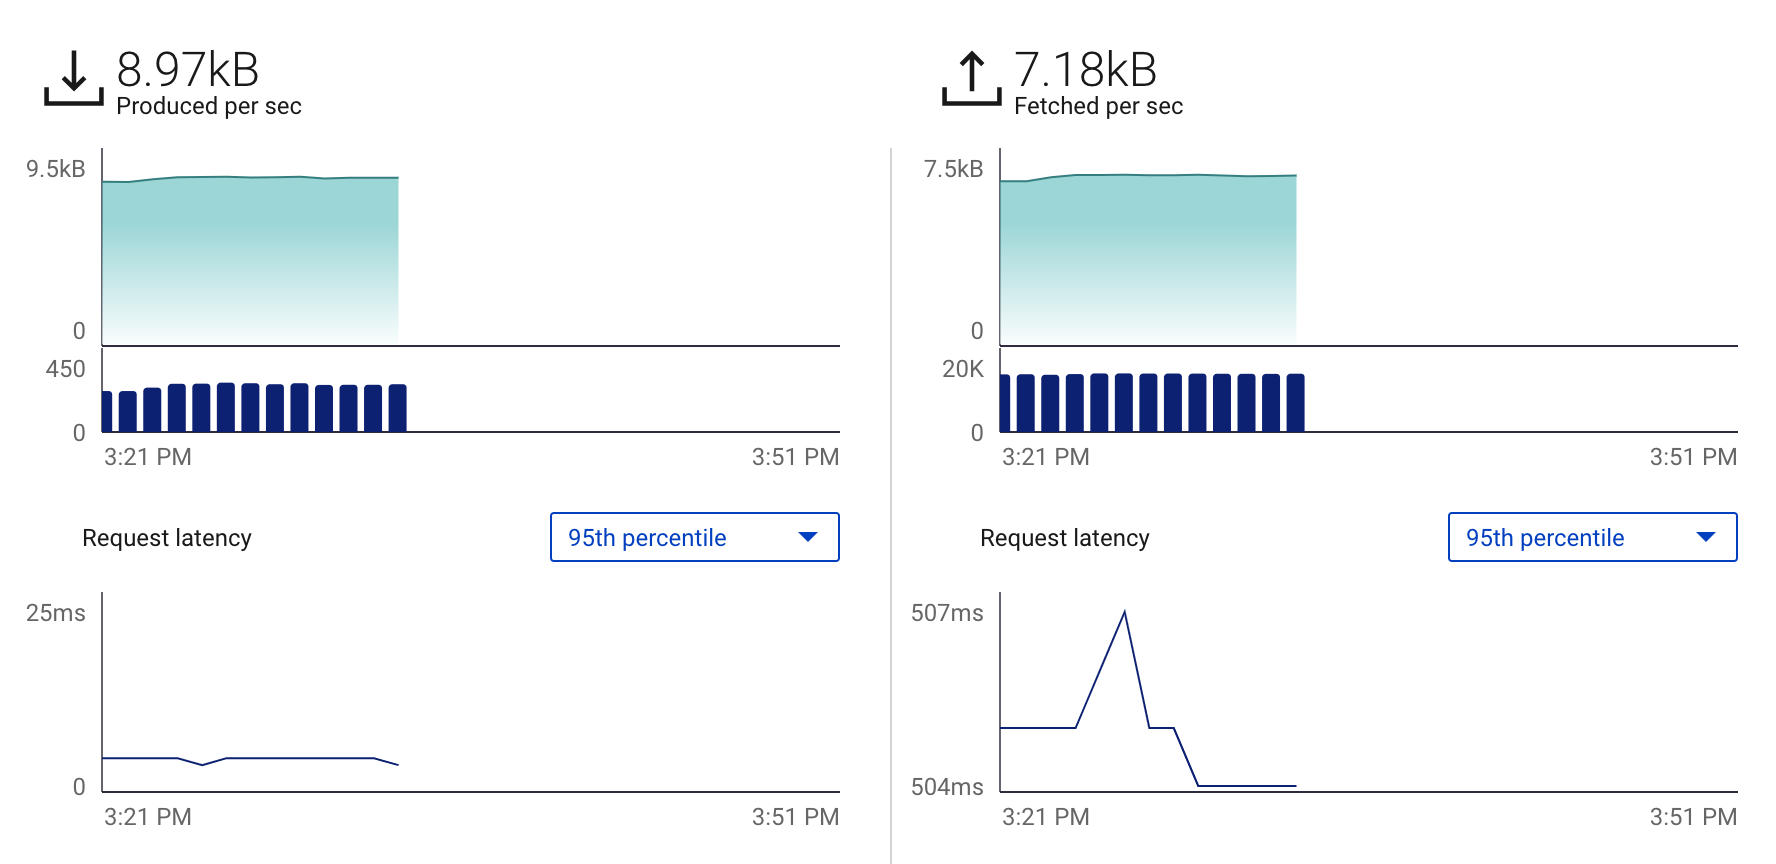
The left side shows the produced metrics, and the right side shows the fetched metrics.
In either the Brokers and Topics tab, you can hover the mouse cursor over an individual row of the broker or topic table to overlay the request statistics for that individual broker or topic in the chart.
Hover over the top chart to see the request throughput for any given interval
- Bytes produced/fetched per sec
Total number of bytes per second of data produced to or fetched from this cluster.
- Successful requests
Total number of successful requests produced to or fetched from the cluster in a one minute interval.
- Failed requests
Total number of failed requests produced to or fetched from the cluster in a one minute interval.
Click on the line graph in the “Request latency” chart to see a breakdown of produce and fetch latencies through the entire request lifecycle. The request latency values can be shown at the median, 95th, 99th, or 99.9th percentile.
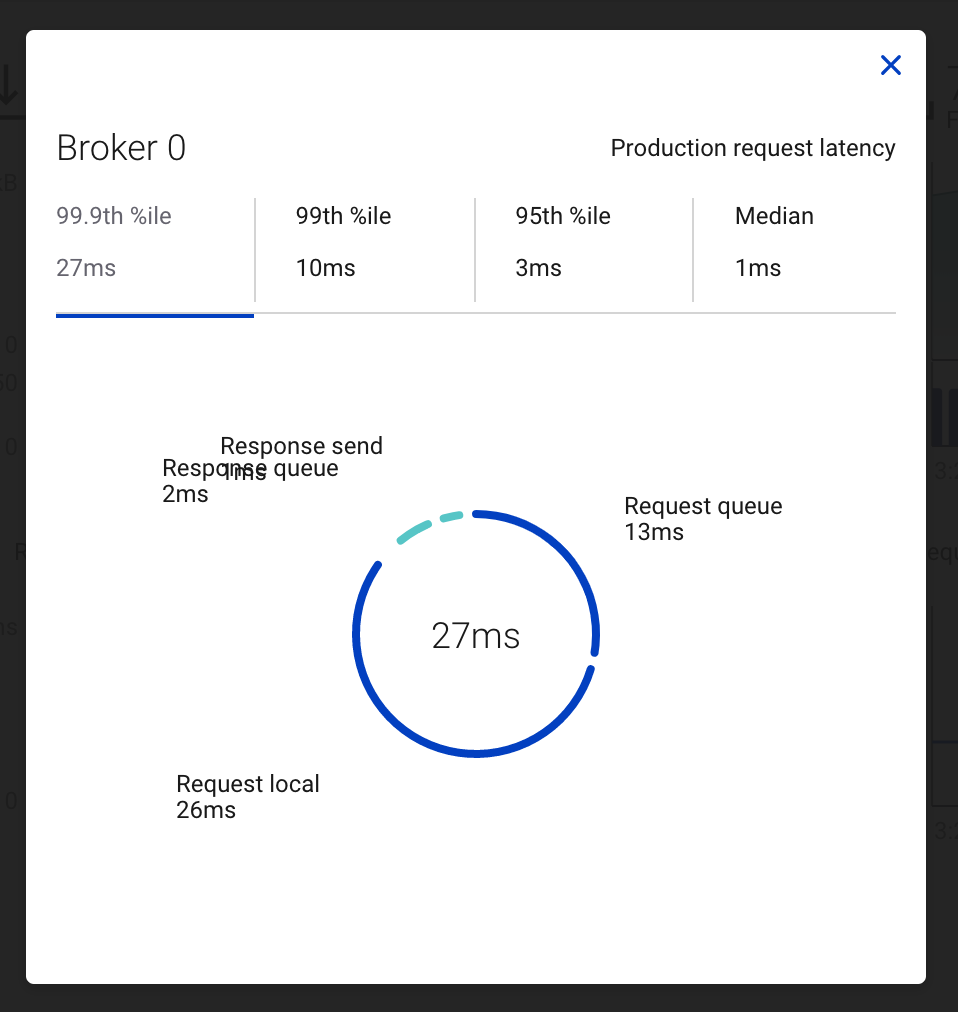
- Total request latency (center)
Total time of an entire request lifecycle, from the broker point of view. If total request latency starts high or steadily increases over time, drill down into the other the request latency metrics to isolate where brokers are spending the most time.
- Request queue
The time the request is in the request queue waiting for an IO thread. A high value can indicate several things. There may not be not enough IO threads so consider increasing the broker configuration parameter
num.io.threads. The CPU is a bottleneck so monitor broker CPU.- Request local
The time the request is being processed locally by the leader. A high value can imply slow disk so monitor broker disk IO.
- Response remote
The time the request is waiting on other brokers. A high value can imply a slow network connection so monitor network connectivity. A high value can also imply there is not enough data to give in a fetch response. This can happen under normal scenarios when the consumer is caught up to the end of the log and there is no new incoming data, in which case the response remote time will be close to
fetch.max.wait.ms.- Response queue
The time the request is in the response queue waiting for a network thread. A high value can imply there are not enough network threads so consider increasing the broker configuration parameter
num.network.threads.- Response send
The time the request is being sent back to the consumer. A high value can imply the CPU or network is a bottleneck so monitor CPU and network utilization.
Broker Metrics Table
- Id
- Id for this broker
- Throughput
Bytes in - Number of bytes per second produced to this broker
Bytes out – Number of bytes per second fetched from this broker (does not account for internal replication traffic)
- Latency (produce)
- Latency of produce requests to this broker at the median, 95th, 99th, or 99.9th percentile (in milliseconds).
- Latency (fetched)
- Latency of fetch requests to this broker at the median, 95th, 99th, or 99.9th percentile (in milliseconds).
- Partition replicas
- Total number of partition replicas served by this broker
- Segment
- Total size in bytes of the log segments served by this broker (excluding index size)
- Rack
- Rack Id for this broker
Topic Aggregate Metrics
- Topic count
- Total number of topics in the cluster. If the number of topics is less than expected, verify that clients are producing to or consuming from the topics that are missing.
- In sync replicas
Total number of topic partition replicas in the cluster that are in sync with the leader; i.e., sum of each { topic partition * topic replication factor }.
If the number of in sync replicas is less than the number of replicas in your cluster, identify the topic with out of sync replicas from the topic table and view details of the topic to determine which brokers are out of sync. Investigate the broker logs to determine cause.
- Out of sync replicas
- Total number of topic partition replicas in the cluster that are out of sync with the leader. If the number of out of sync replicas is greater than 0, identify the topic with out of sync replicas from the topic table and view details to determine which brokers are out of sync. Investigate the broker logs to determine cause.
Topic Metrics Table
- Name
- Topic name.
- Throughput
Bytes in - Number of bytes per second produced to this topic.
Bytes out – Number of bytes per second fetched from this topic (does not account for internal replication traffic).
- Partition replicas
Total – Total number of partition replicas for this topic.
In sync – Total number of partition replicas that are in sync.
Out of sync – Total number of partition replicas that are out of sync.
- Partitions
Total – Number of partitions for this topic.
Under replicated – Number of partitions that are under replicated (i.e. partitions with in-sync replicas < replication factor).
- Segment
Count – Number of log segments for this topic across all partition leaders.
Size – Size in bytes of the log for this topic (does not include replicas).
- Offset
Start – Minimum offset across all partitions for this topic.
End – Maximum offset across all partitions for this topic.