Example: Replicate Data in an Active-Active Multi-DataCenter Deployment on Confluent Platform
This example uses pre-built Docker images to show how to deploy an active-active multi-datacenter design, with two instances of Confluent Replicator that copy data bidirectionally between the datacenters.
This Docker environment is for demo purposes only, not for production.
Setup
- Prerequisites:
Docker
Docker version 1.11 or later is installed and running.
Docker Compose is installed. Docker Compose is installed by default with Docker for Mac.
Docker memory is allocated minimally at 6 GB. When using Docker Desktop for Mac, the default Docker memory allocation is 2 GB. You can change the default allocation to 6 GB in Docker. Navigate to Preferences > Resources > Advanced.
Internet connectivity
Operating System currently supported by Confluent Platform
Networking and Kafka on Docker
Configure your hosts and ports to allow both internal and external components to the Docker network to communicate.
Design
This is an active-active multi-datacenter design, with two instances of Confluent Replicator that copy data bidirectionally between datacenters dc1 and dc2.
Confluent Control Center is running to manage and monitor the cluster.
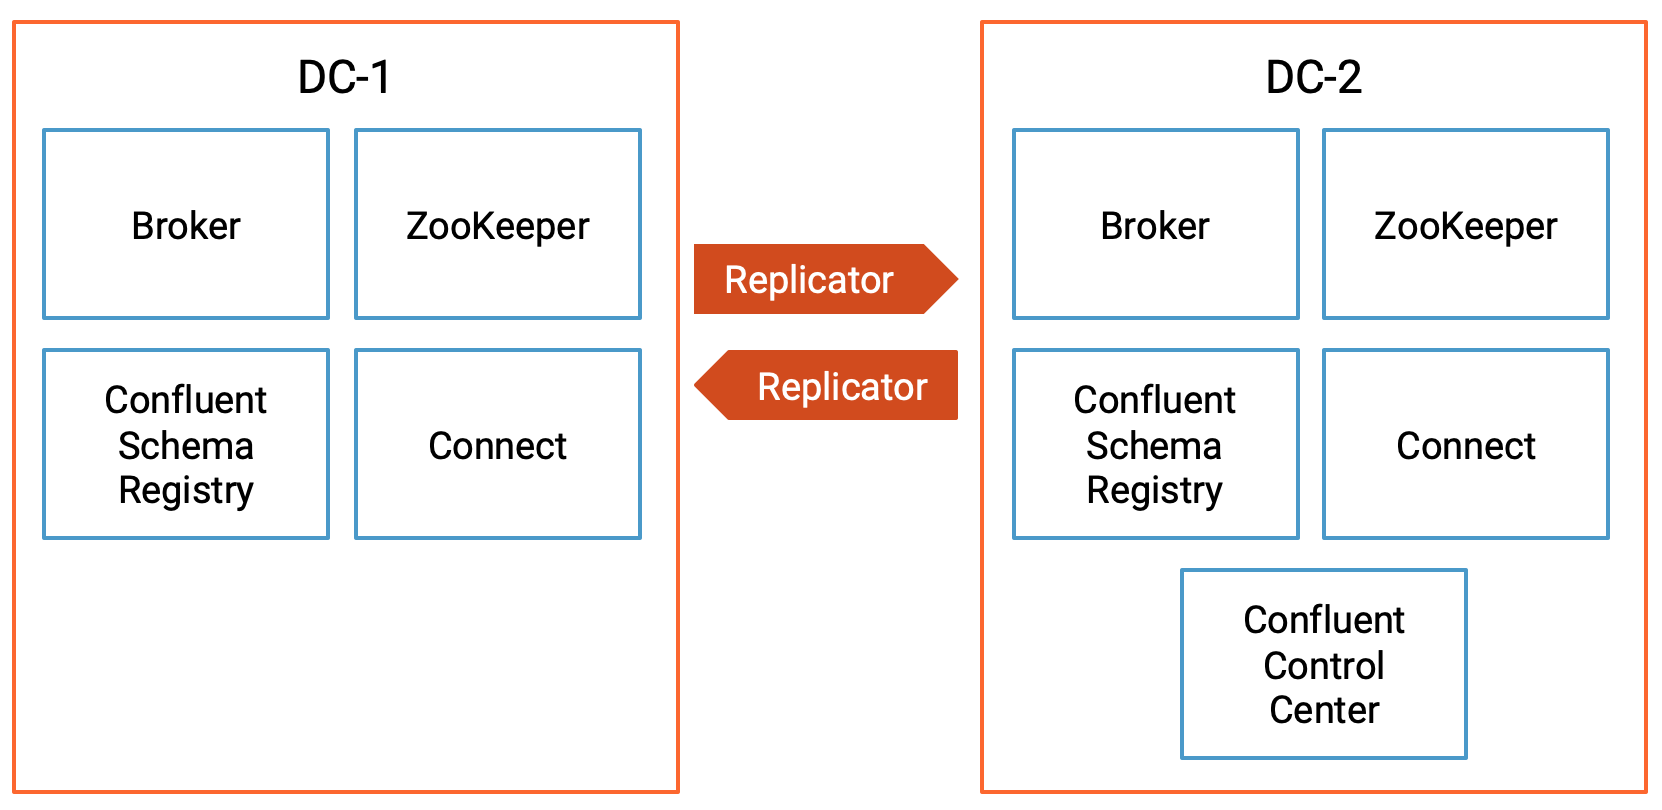
Confluent Platform Component ports
dc1 | dc2 | |
|---|---|---|
Broker | 9091 | 9092 |
ZooKeeper | 2181 | 2182 |
Schema Registry | 8081 (primary) | 8082 (secondary) |
Connect | 8381 (copying dc2->dc1) | 8382 (copying dc1->dc2) |
Control Center | 9021 |
Data generation and topic names
Datagen Docker container | Origin DC | Origin topics | Replicator instance | Destination DC | Destination topics |
|---|---|---|---|---|---|
datagen-dc1- topic1 | dc1 | topic1, _schemas | replicator-dc1 -to-dc2-topic1 | dc2 | topic1, _schemas |
datagen-dc1- topic2 | dc1 | topic2 | replicator-dc1 -to-dc2-topic2 | dc2 | topic2.replica |
datagen-dc2- topic1 | dc2 | topic1 | replicator-dc2 -to-dc1-topic1 | dc1 | topic1 |
Confluent Replicator (version 5.0.1 and higher) prevents cyclic repetition of data between the dc1 topic1 and dc2 topic1 by using provenance information in the message headers.
Run the demo
Environment
This demo has been validated with:
Docker version 17.06.1-ce
Docker Compose version 1.14.0 with Docker Compose file format 2.1
Start the services
Clone the confluentinc/examples GitHub repository and check out the
8.1.1-postbranch.git clone https://github.com/confluentinc/examples cd examples git checkout 8.1.1-post
Navigate to
multi-datacenterexamples directory.cd multi-datacenter/
Start all services and sample messages from topics in each datacenter:
./start.sh
View the full configurations for the Kafka brokers, Schema Registry, and connect workers in the docker-compose.yml file.
cat docker-compose.yml
Verify multi-datacenter setup
Replicator
In this multi-datacenter environment, there are two Apache Kafka® clusters, dc1 and dc2. Confluent Control Center manages both of these clusters. Confluent Replicator is that copy data bidirectionally between dc1 and dc2, but for simplicity in explaining how it works, the following sections consider replication only from dc1 to dc2.
After starting the demo (see previous section), navigate your Chrome browser to the Control Center UI at http://localhost:9021 and verify that there are two Kafka clusters
dc1anddc2: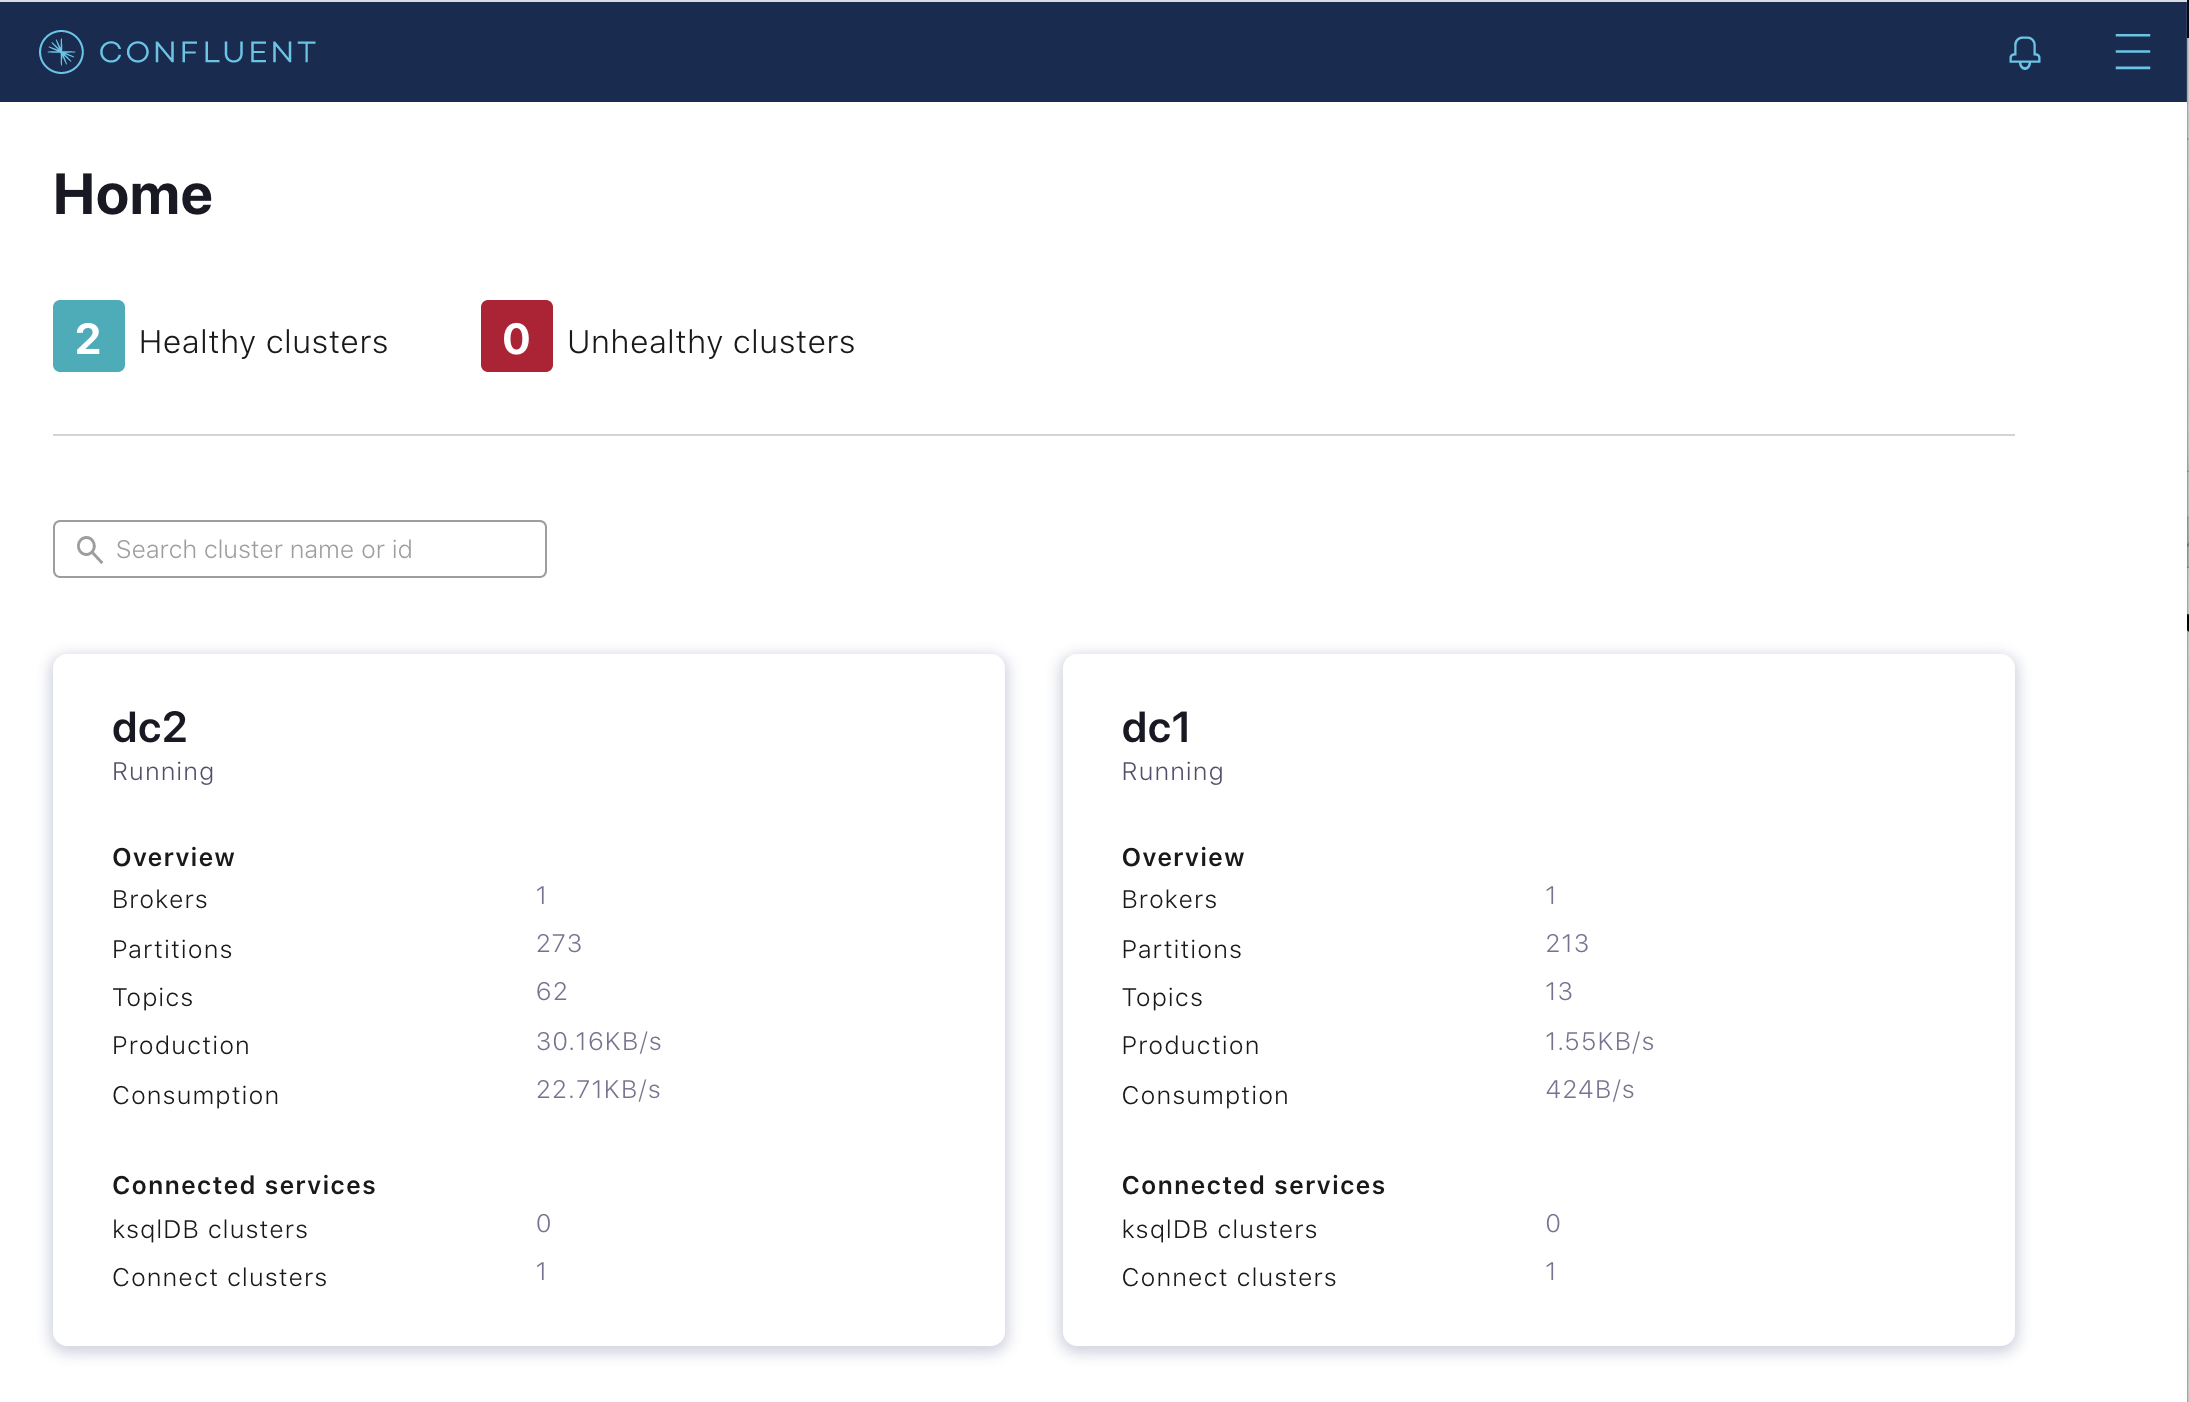
This demo has two Kafka Connect clusters,
connect-dc1andconnect-dc2. Recall that Replicator is a source connector that typically runs on the connect cluster at the destination, soconnect-dc1runs Replicator copying fromdc2todc1, andconnect-dc2runs Replicator copying fromdc1todc2. Since version 5.2, Control Center can manage multiple Kafka Connect clusters, but in this demo we focus only on those Replicator instances running inconnect-dc2copying fromdc1todc2.For Replicator copying from
dc1todc2: navigate to the Connect menu to verify that Kafka Connect (configured toconnect-dc2) is running two instances of Replicator: replicator-dc1-to-dc2-topic1 and replicator-dc1-to-dc2-topic2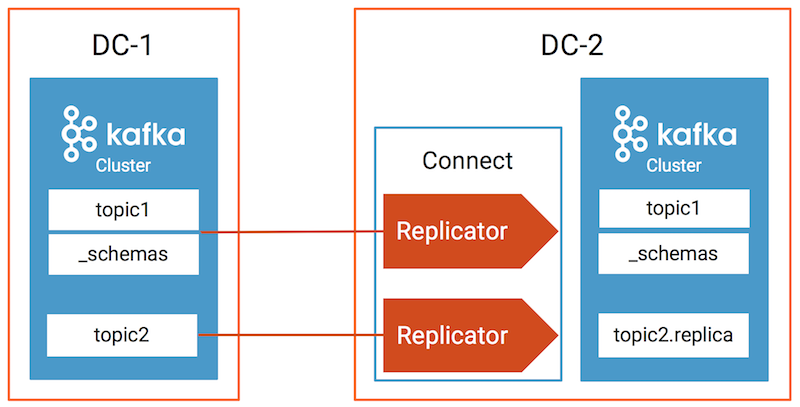
Inspect topics
For each datacenter, inspect the data in various topics, provenance information, timestamp information, and cluster ID.
./read-topics.sh
Verify the output resembles:
-----dc1-----

list topics:
__consumer_offsets
__consumer_timestamps
_confluent-command
_confluent-license
_confluent-telemetry-metrics
_confluent_balancer_api_state
_schemas
connect-configs-dc1
connect-offsets-dc1
connect-status-dc1
topic1
topic2

topic1:
{"userid":{"string":"User_7"},"dc":{"string":"dc1"}}
{"userid":{"string":"User_7"},"dc":{"string":"dc2"}}
{"userid":{"string":"User_9"},"dc":{"string":"dc2"}}
{"userid":{"string":"User_2"},"dc":{"string":"dc1"}}
{"userid":{"string":"User_5"},"dc":{"string":"dc2"}}
{"userid":{"string":"User_1"},"dc":{"string":"dc1"}}
{"userid":{"string":"User_3"},"dc":{"string":"dc2"}}
{"userid":{"string":"User_7"},"dc":{"string":"dc1"}}
{"userid":{"string":"User_1"},"dc":{"string":"dc2"}}
{"userid":{"string":"User_8"},"dc":{"string":"dc1"}}
Processed a total of 10 messages

topic2:
{"registertime":{"long":1513471082347},"userid":{"string":"User_2"},"regionid":{"string":"Region_7"},"gender":{"string":"OTHER"}}
{"registertime":{"long":1496006007512},"userid":{"string":"User_5"},"regionid":{"string":"Region_6"},"gender":{"string":"OTHER"}}
{"registertime":{"long":1494319368203},"userid":{"string":"User_7"},"regionid":{"string":"Region_2"},"gender":{"string":"FEMALE"}}
{"registertime":{"long":1493150028737},"userid":{"string":"User_1"},"regionid":{"string":"Region_5"},"gender":{"string":"FEMALE"}}
{"registertime":{"long":1517151907191},"userid":{"string":"User_5"},"regionid":{"string":"Region_3"},"gender":{"string":"OTHER"}}
{"registertime":{"long":1489672305692},"userid":{"string":"User_2"},"regionid":{"string":"Region_6"},"gender":{"string":"OTHER"}}
{"registertime":{"long":1511471447951},"userid":{"string":"User_2"},"regionid":{"string":"Region_5"},"gender":{"string":"MALE"}}
{"registertime":{"long":1488018372941},"userid":{"string":"User_7"},"regionid":{"string":"Region_2"},"gender":{"string":"OTHER"}}
{"registertime":{"long":1500952152251},"userid":{"string":"User_2"},"regionid":{"string":"Region_1"},"gender":{"string":"MALE"}}
{"registertime":{"long":1493556444692},"userid":{"string":"User_1"},"regionid":{"string":"Region_8"},"gender":{"string":"FEMALE"}}
Processed a total of 10 messages

_schemas:
null
null
null
{"subject":"topic1-value","version":1,"id":1,"schema":"{\"type\":\"record\",\"name\":\"KsqlDataSourceSchema\",\"namespace\":\"io.confluent.ksql.avro_schemas\",\"fields\":[{\"name\":\"userid\",\"type\":[\"null\",\"string\"],\"default\":null},{\"name\":\"dc\",\"type\":[\"null\",\"string\"],\"default\":null}]}","deleted":false}
{"subject":"topic2-value","version":1,"id":2,"schema":"{\"type\":\"record\",\"name\":\"KsqlDataSourceSchema\",\"namespace\":\"io.confluent.ksql.avro_schemas\",\"fields\":[{\"name\":\"registertime\",\"type\":[\"null\",\"long\"],\"default\":null},{\"name\":\"userid\",\"type\":[\"null\",\"string\"],\"default\":null},{\"name\":\"regionid\",\"type\":[\"null\",\"string\"],\"default\":null},{\"name\":\"gender\",\"type\":[\"null\",\"string\"],\"default\":null}]}","deleted":false}
{"subject":"topic2.replica-value","version":1,"id":2,"schema":"{\"type\":\"record\",\"name\":\"KsqlDataSourceSchema\",\"namespace\":\"io.confluent.ksql.avro_schemas\",\"fields\":[{\"name\":\"registertime\",\"type\":[\"null\",\"long\"],\"default\":null},{\"name\":\"userid\",\"type\":[\"null\",\"string\"],\"default\":null},{\"name\":\"regionid\",\"type\":[\"null\",\"string\"],\"default\":null},{\"name\":\"gender\",\"type\":[\"null\",\"string\"],\"default\":null}]}","deleted":false}
[2021-01-04 19:16:09,579] ERROR Error processing message, terminating consumer process:  (kafka.tools.ConsoleConsumer$)
org.apache.kafka.common.errors.TimeoutException
Processed a total of 6 messages

provenance info (cluster, topic, timestamp):
2qHo2TsdTIaTjvkCyf3qdw,topic1,1609787778125
2qHo2TsdTIaTjvkCyf3qdw,topic1,1609787779123
2qHo2TsdTIaTjvkCyf3qdw,topic1,1609787780125
2qHo2TsdTIaTjvkCyf3qdw,topic1,1609787781246
2qHo2TsdTIaTjvkCyf3qdw,topic1,1609787782125
Processed a total of 10 messages

timestamp info (group: topic-partition):
replicator-dc1-to-dc2-topic2: topic2-0    1609787797164
replicator-dc1-to-dc2-topic1: topic1-0    1609787797117
Processed a total of 2 messages

cluster id:
ZagAAEfORQG-lxwq6OsV5Q

-----dc2-----

list topics:
__consumer_offsets
__consumer_timestamps
_confluent-command
_confluent-controlcenter-6-1-0-1-AlertHistoryStore-changelog
_confluent-controlcenter-6-1-0-1-AlertHistoryStore-repartition
_confluent-controlcenter-6-1-0-1-Group-ONE_MINUTE-changelog
_confluent-controlcenter-6-1-0-1-Group-ONE_MINUTE-repartition
_confluent-controlcenter-6-1-0-1-Group-THREE_HOURS-changelog
_confluent-controlcenter-6-1-0-1-Group-THREE_HOURS-repartition
_confluent-controlcenter-6-1-0-1-KSTREAM-OUTEROTHER-0000000106-store-changelog
_confluent-controlcenter-6-1-0-1-KSTREAM-OUTEROTHER-0000000106-store-repartition
_confluent-controlcenter-6-1-0-1-KSTREAM-OUTERTHIS-0000000105-store-changelog
_confluent-controlcenter-6-1-0-1-KSTREAM-OUTERTHIS-0000000105-store-repartition
_confluent-controlcenter-6-1-0-1-MetricsAggregateStore-changelog
_confluent-controlcenter-6-1-0-1-MetricsAggregateStore-repartition
_confluent-controlcenter-6-1-0-1-MonitoringMessageAggregatorWindows-ONE_MINUTE-changelog
_confluent-controlcenter-6-1-0-1-MonitoringMessageAggregatorWindows-ONE_MINUTE-repartition
_confluent-controlcenter-6-1-0-1-MonitoringMessageAggregatorWindows-THREE_HOURS-changelog
_confluent-controlcenter-6-1-0-1-MonitoringMessageAggregatorWindows-THREE_HOURS-repartition
_confluent-controlcenter-6-1-0-1-MonitoringStream-ONE_MINUTE-changelog
_confluent-controlcenter-6-1-0-1-MonitoringStream-ONE_MINUTE-repartition
_confluent-controlcenter-6-1-0-1-MonitoringStream-THREE_HOURS-changelog
_confluent-controlcenter-6-1-0-1-MonitoringStream-THREE_HOURS-repartition
_confluent-controlcenter-6-1-0-1-MonitoringTriggerStore-changelog
_confluent-controlcenter-6-1-0-1-MonitoringTriggerStore-repartition
_confluent-controlcenter-6-1-0-1-MonitoringVerifierStore-changelog
_confluent-controlcenter-6-1-0-1-MonitoringVerifierStore-repartition
_confluent-controlcenter-6-1-0-1-TriggerActionsStore-changelog
_confluent-controlcenter-6-1-0-1-TriggerActionsStore-repartition
_confluent-controlcenter-6-1-0-1-TriggerEventsStore-changelog
_confluent-controlcenter-6-1-0-1-TriggerEventsStore-repartition
_confluent-controlcenter-6-1-0-1-actual-group-consumption-rekey
_confluent-controlcenter-6-1-0-1-aggregate-topic-partition-store-changelog
_confluent-controlcenter-6-1-0-1-aggregate-topic-partition-store-repartition
_confluent-controlcenter-6-1-0-1-aggregatedTopicPartitionTableWindows-ONE_MINUTE-changelog
_confluent-controlcenter-6-1-0-1-aggregatedTopicPartitionTableWindows-ONE_MINUTE-repartition
_confluent-controlcenter-6-1-0-1-aggregatedTopicPartitionTableWindows-THREE_HOURS-changelog
_confluent-controlcenter-6-1-0-1-aggregatedTopicPartitionTableWindows-THREE_HOURS-repartition
_confluent-controlcenter-6-1-0-1-cluster-rekey
_confluent-controlcenter-6-1-0-1-expected-group-consumption-rekey
_confluent-controlcenter-6-1-0-1-group-aggregate-store-ONE_MINUTE-changelog
_confluent-controlcenter-6-1-0-1-group-aggregate-store-ONE_MINUTE-repartition
_confluent-controlcenter-6-1-0-1-group-aggregate-store-THREE_HOURS-changelog
_confluent-controlcenter-6-1-0-1-group-aggregate-store-THREE_HOURS-repartition
_confluent-controlcenter-6-1-0-1-group-stream-extension-rekey
_confluent-controlcenter-6-1-0-1-metrics-trigger-measurement-rekey
_confluent-controlcenter-6-1-0-1-monitoring-aggregate-rekey-store-changelog
_confluent-controlcenter-6-1-0-1-monitoring-aggregate-rekey-store-repartition
_confluent-controlcenter-6-1-0-1-monitoring-message-rekey-store
_confluent-controlcenter-6-1-0-1-monitoring-trigger-event-rekey
_confluent-license
_confluent-metrics
_confluent-monitoring
_confluent-telemetry-metrics
_confluent_balancer_api_state
_schemas
connect-configs-dc2
connect-offsets-dc2
connect-status-dc2
topic1
topic2.replica

topic1:
{"userid":{"string":"User_2"},"dc":{"string":"dc2"}}
{"userid":{"string":"User_1"},"dc":{"string":"dc1"}}
{"userid":{"string":"User_6"},"dc":{"string":"dc2"}}
{"userid":{"string":"User_9"},"dc":{"string":"dc1"}}
{"userid":{"string":"User_9"},"dc":{"string":"dc2"}}
{"userid":{"string":"User_9"},"dc":{"string":"dc1"}}
{"userid":{"string":"User_9"},"dc":{"string":"dc2"}}
{"userid":{"string":"User_9"},"dc":{"string":"dc1"}}
{"userid":{"string":"User_9"},"dc":{"string":"dc2"}}
{"userid":{"string":"User_9"},"dc":{"string":"dc1"}}
Processed a total of 10 messages

topic2.replica:
{"registertime":{"long":1488571887136},"userid":{"string":"User_2"},"regionid":{"string":"Region_4"},"gender":{"string":"FEMALE"}}
{"registertime":{"long":1496554479008},"userid":{"string":"User_3"},"regionid":{"string":"Region_9"},"gender":{"string":"OTHER"}}
{"registertime":{"long":1515819037639},"userid":{"string":"User_1"},"regionid":{"string":"Region_7"},"gender":{"string":"FEMALE"}}
{"registertime":{"long":1498630829454},"userid":{"string":"User_9"},"regionid":{"string":"Region_5"},"gender":{"string":"FEMALE"}}
{"registertime":{"long":1491954362758},"userid":{"string":"User_6"},"regionid":{"string":"Region_6"},"gender":{"string":"FEMALE"}}
{"registertime":{"long":1498308706008},"userid":{"string":"User_2"},"regionid":{"string":"Region_2"},"gender":{"string":"OTHER"}}
{"registertime":{"long":1509409463384},"userid":{"string":"User_5"},"regionid":{"string":"Region_8"},"gender":{"string":"OTHER"}}
{"registertime":{"long":1494736574275},"userid":{"string":"User_4"},"regionid":{"string":"Region_4"},"gender":{"string":"OTHER"}}
{"registertime":{"long":1513254638109},"userid":{"string":"User_3"},"regionid":{"string":"Region_5"},"gender":{"string":"FEMALE"}}
{"registertime":{"long":1499607488391},"userid":{"string":"User_4"},"regionid":{"string":"Region_2"},"gender":{"string":"OTHER"}}
Processed a total of 10 messages

_schemas:
null
null
null
{"subject":"topic1-value","version":1,"id":1,"schema":"{\"type\":\"record\",\"name\":\"KsqlDataSourceSchema\",\"namespace\":\"io.confluent.ksql.avro_schemas\",\"fields\":[{\"name\":\"userid\",\"type\":[\"null\",\"string\"],\"default\":null},{\"name\":\"dc\",\"type\":[\"null\",\"string\"],\"default\":null}]}","deleted":false}
{"subject":"topic2-value","version":1,"id":2,"schema":"{\"type\":\"record\",\"name\":\"KsqlDataSourceSchema\",\"namespace\":\"io.confluent.ksql.avro_schemas\",\"fields\":[{\"name\":\"registertime\",\"type\":[\"null\",\"long\"],\"default\":null},{\"name\":\"userid\",\"type\":[\"null\",\"string\"],\"default\":null},{\"name\":\"regionid\",\"type\":[\"null\",\"string\"],\"default\":null},{\"name\":\"gender\",\"type\":[\"null\",\"string\"],\"default\":null}]}","deleted":false}
{"subject":"topic2.replica-value","version":1,"id":2,"schema":"{\"type\":\"record\",\"name\":\"KsqlDataSourceSchema\",\"namespace\":\"io.confluent.ksql.avro_schemas\",\"fields\":[{\"name\":\"registertime\",\"type\":[\"null\",\"long\"],\"default\":null},{\"name\":\"userid\",\"type\":[\"null\",\"string\"],\"default\":null},{\"name\":\"regionid\",\"type\":[\"null\",\"string\"],\"default\":null},{\"name\":\"gender\",\"type\":[\"null\",\"string\"],\"default\":null}]}","deleted":false}
[2021-01-04 19:17:26,336] ERROR Error processing message, terminating consumer process:  (kafka.tools.ConsoleConsumer$)
org.apache.kafka.common.errors.TimeoutException
Processed a total of 6 messages

provenance info (cluster, topic, timestamp):
ZagAAEfORQG-lxwq6OsV5Q,topic1,1609787854055
ZagAAEfORQG-lxwq6OsV5Q,topic1,1609787854057
ZagAAEfORQG-lxwq6OsV5Q,topic1,1609787856052
ZagAAEfORQG-lxwq6OsV5Q,topic1,1609787857052
ZagAAEfORQG-lxwq6OsV5Q,topic1,1609787857054
Processed a total of 10 messages

timestamp info (group: topic-partition):
replicator-dc2-to-dc1-topic1: topic1-0    1609787867007
replicator-dc2-to-dc1-topic1: topic1-0    1609787877008
Processed a total of 2 messages

cluster id:
2qHo2TsdTIaTjvkCyf3qdw
Note
The _confluent-command internal topic is available as the preferred alternative to the _confluent-license topic, and is the default for new clusters. Both will be supported going forward. To learn more, see Configure component licenses.
Monitor Replicator performance
Monitoring Replicator is important to:
Gauge how synchronized is the data between multiple datacenters
Optimize performance of the network and Confluent Platform
Replicator monitoring
Control Center’s provides detailed monitoring for Replicator from the Replicators menu. Selecting this shows an overview of the Replicator instances currently running on the clusters. Important metrics are shown for each Replicator:
Source Cluster - the cluster that Replicator is replicating from.
Source Topics - the number of topics being replicated.
Messages Replicated in/s - the number of messages replicated per second.
Message Lag - the number of messages present on the source cluster that have not yet been replicated to the destination.
Latency - the difference between the time the message was present on the destination and present on the source.
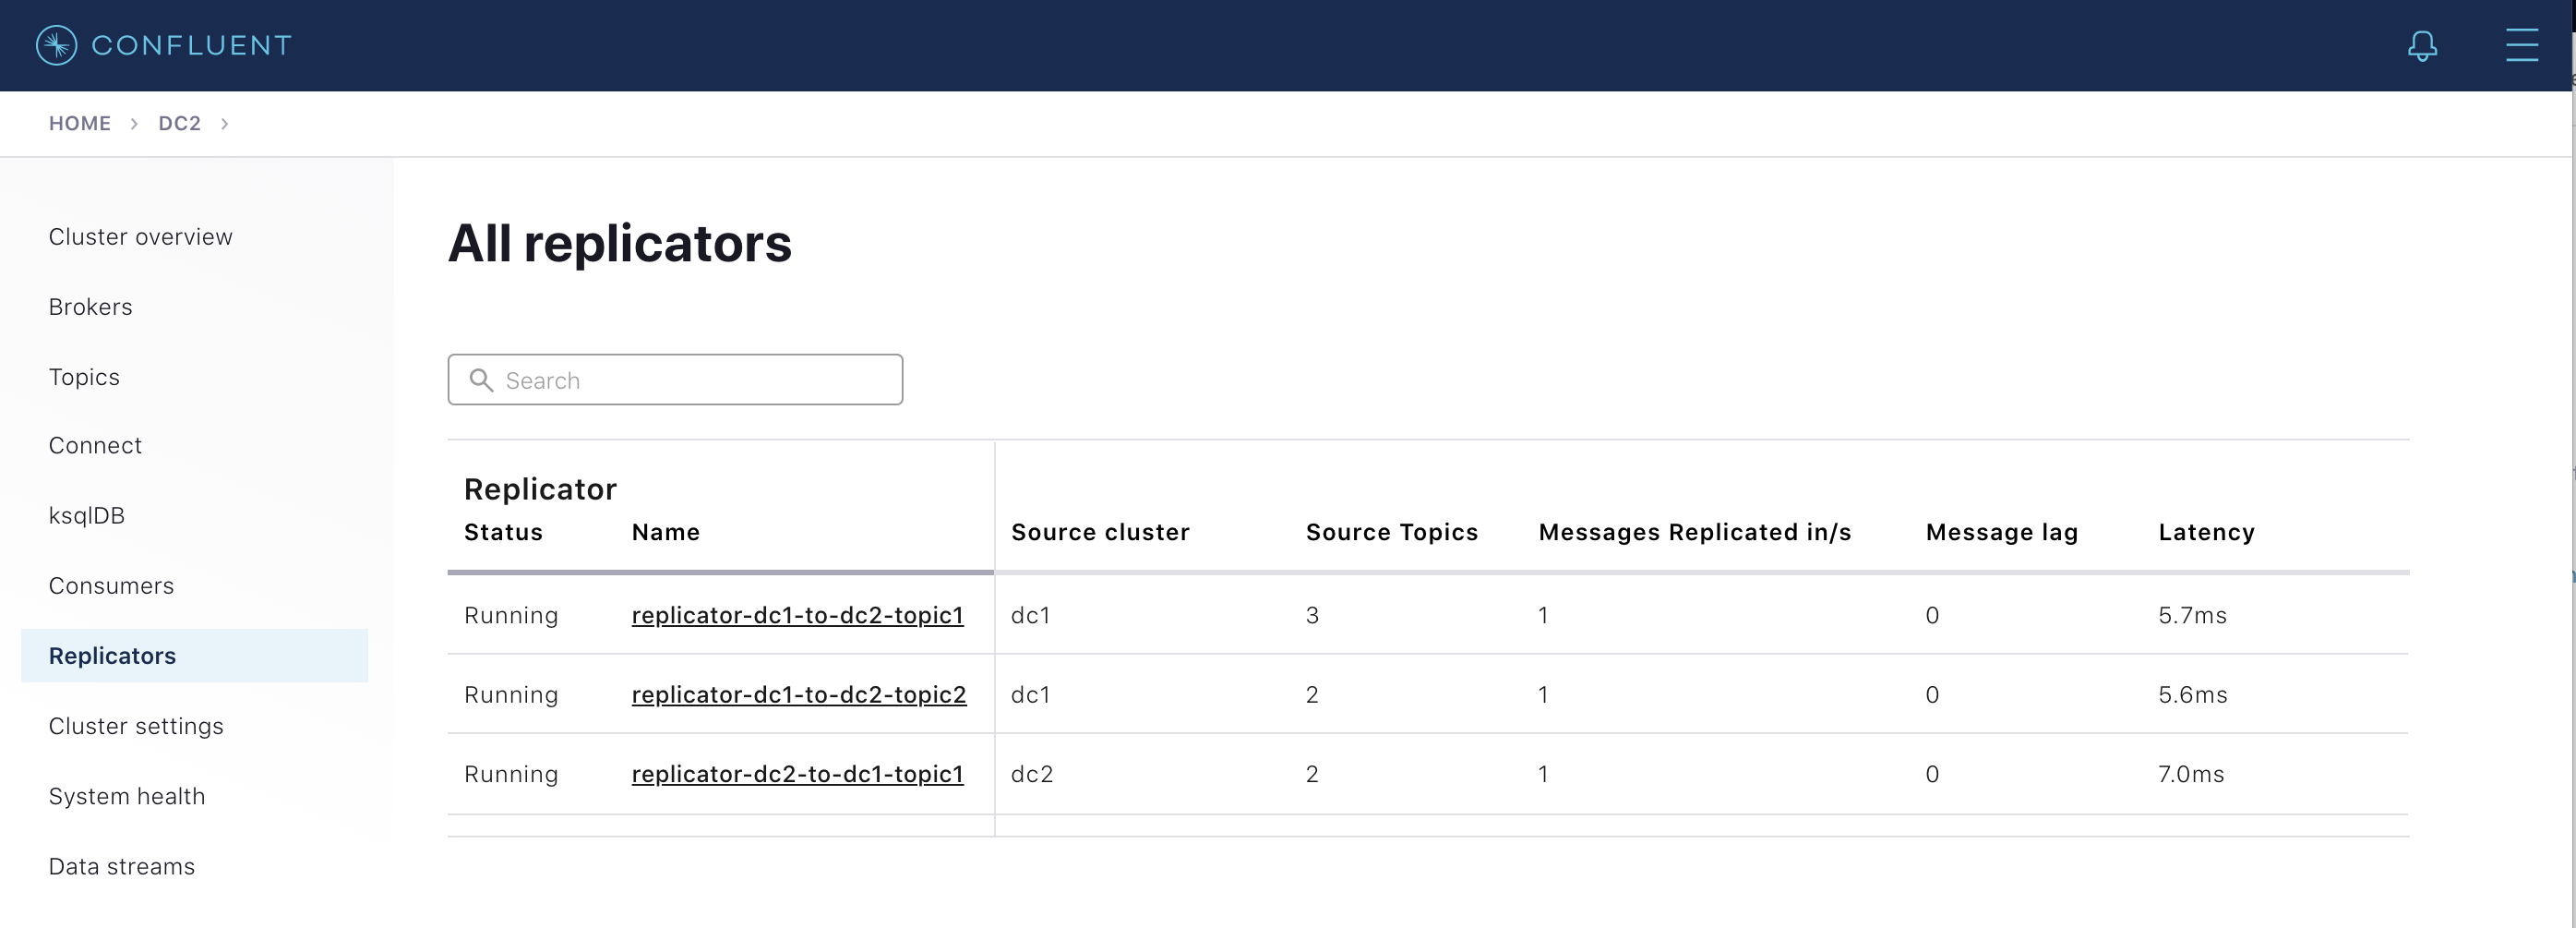
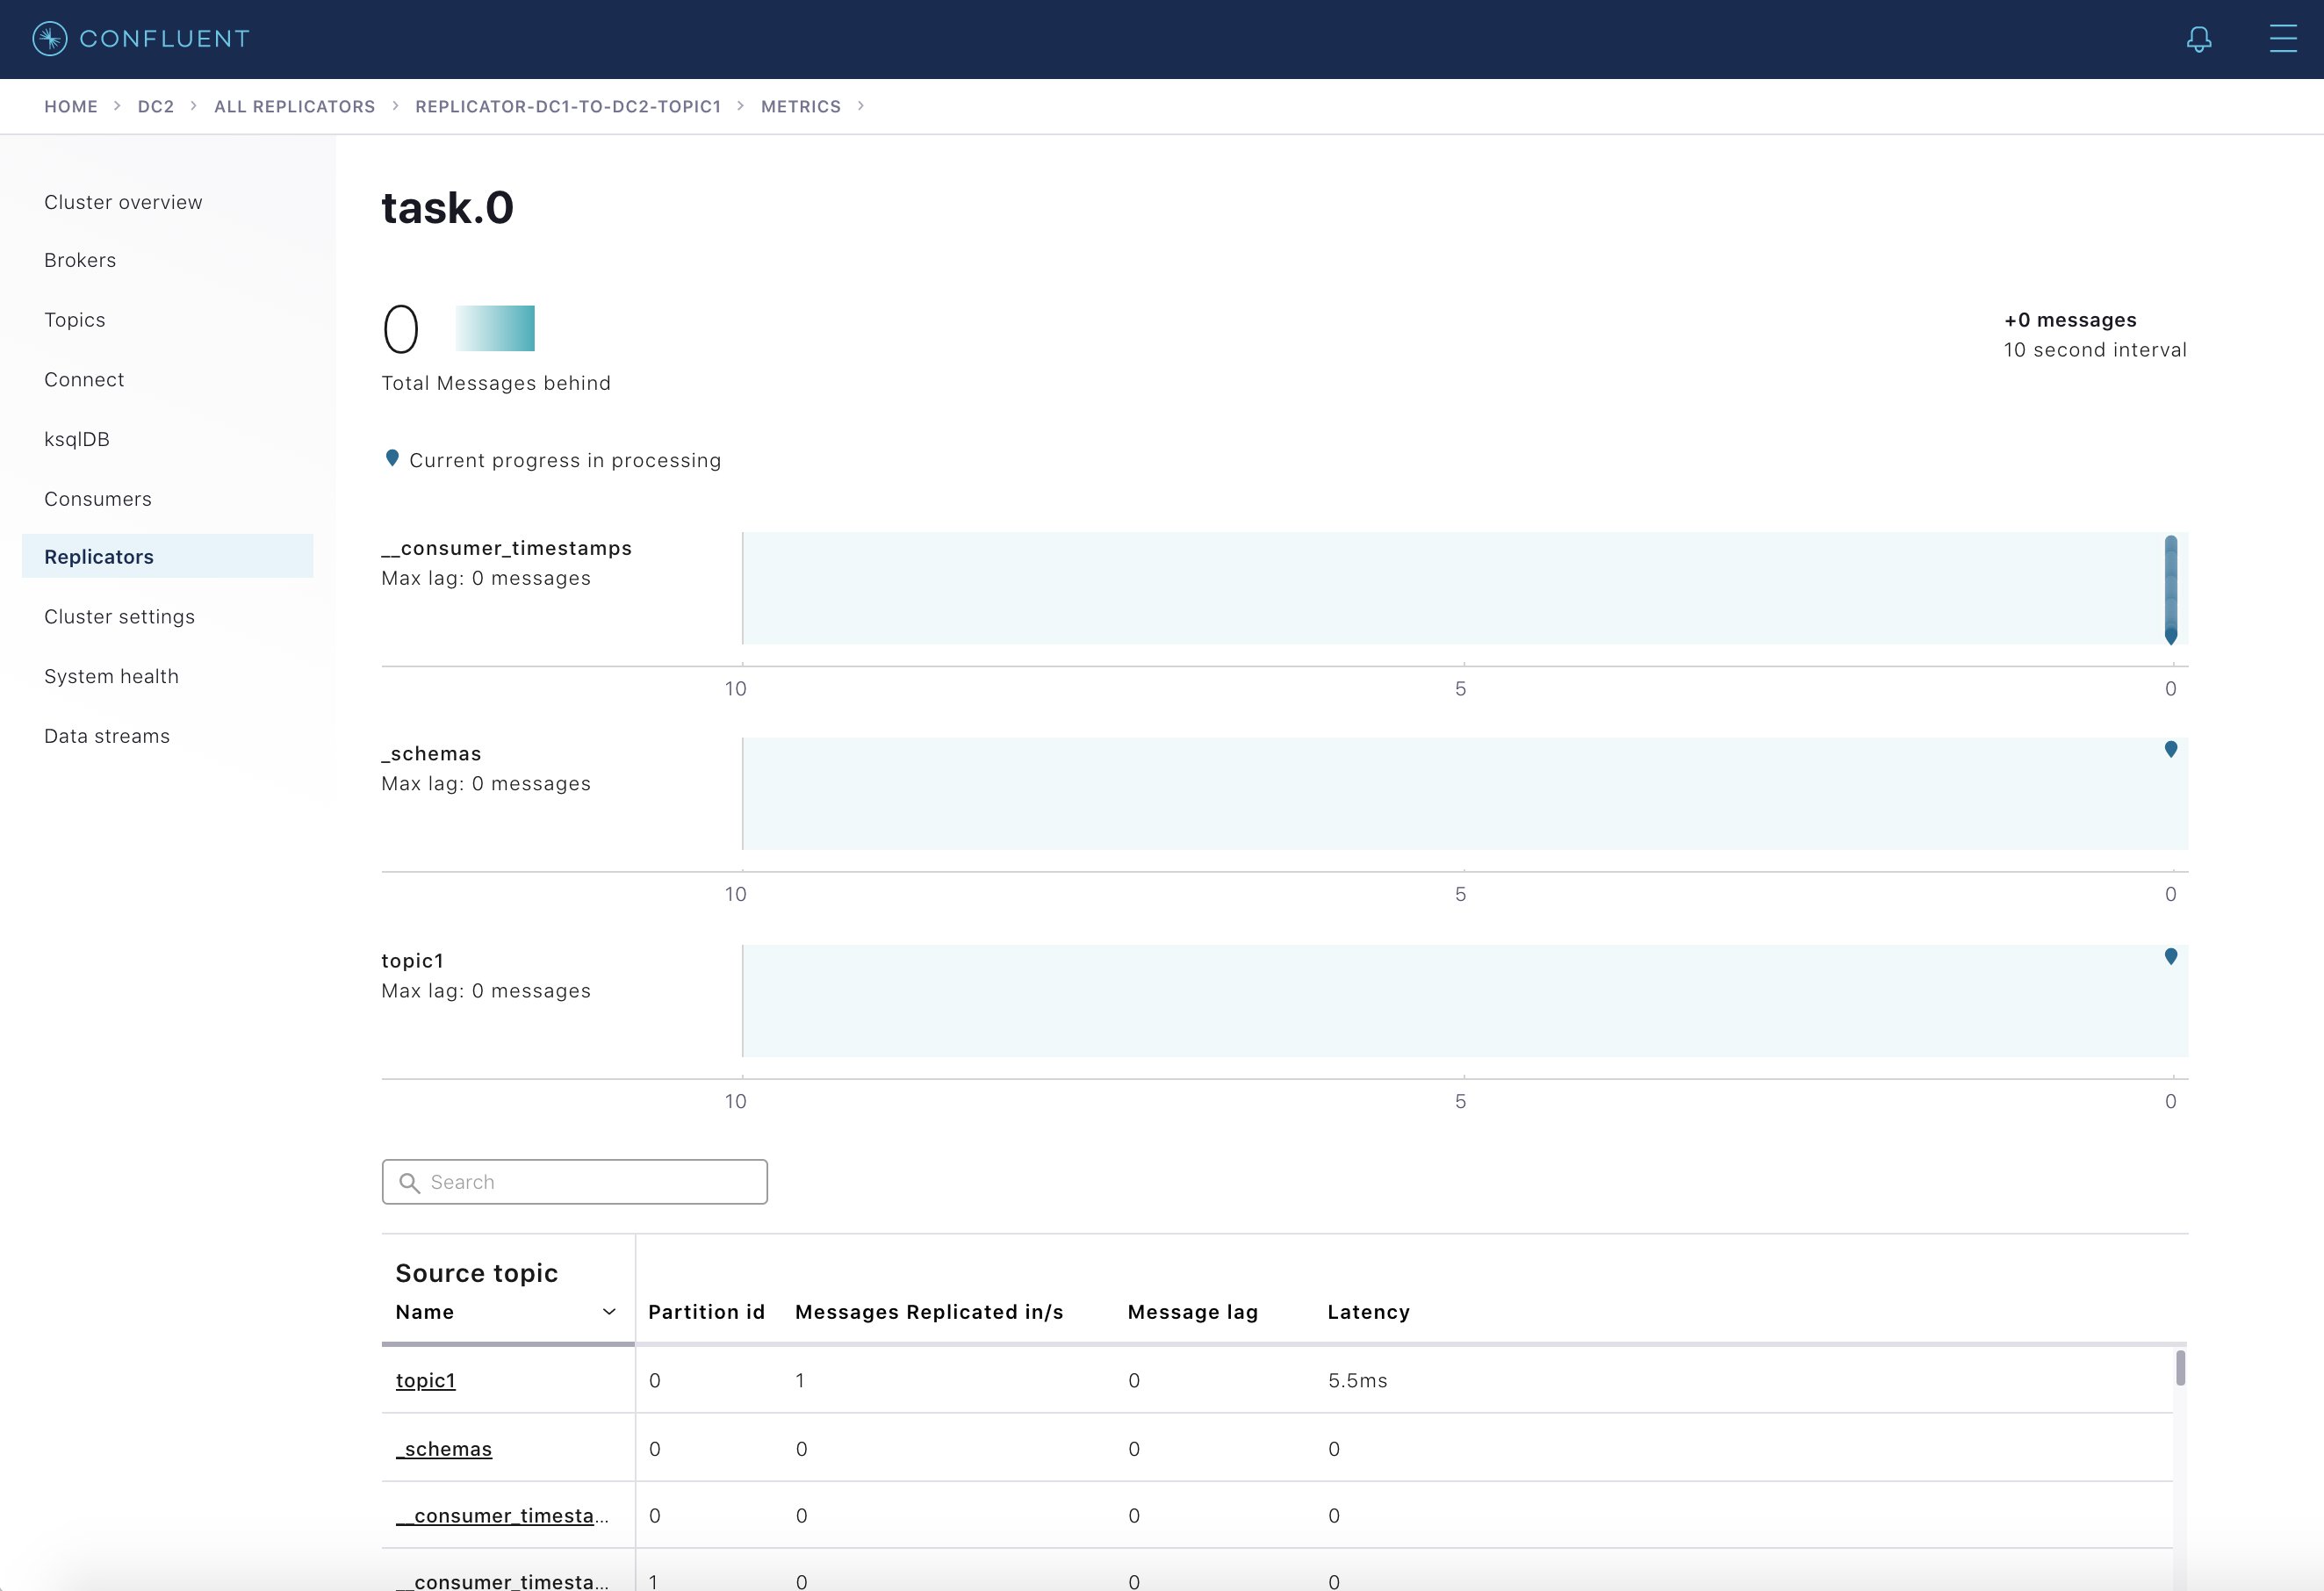
Selecting any of the Replicator instances displayed here will show more detail for a particular instance. Under the Status tab you will see the metrics above broken down by Connect task and on the Source Topics tab you will see them broken down by topic.
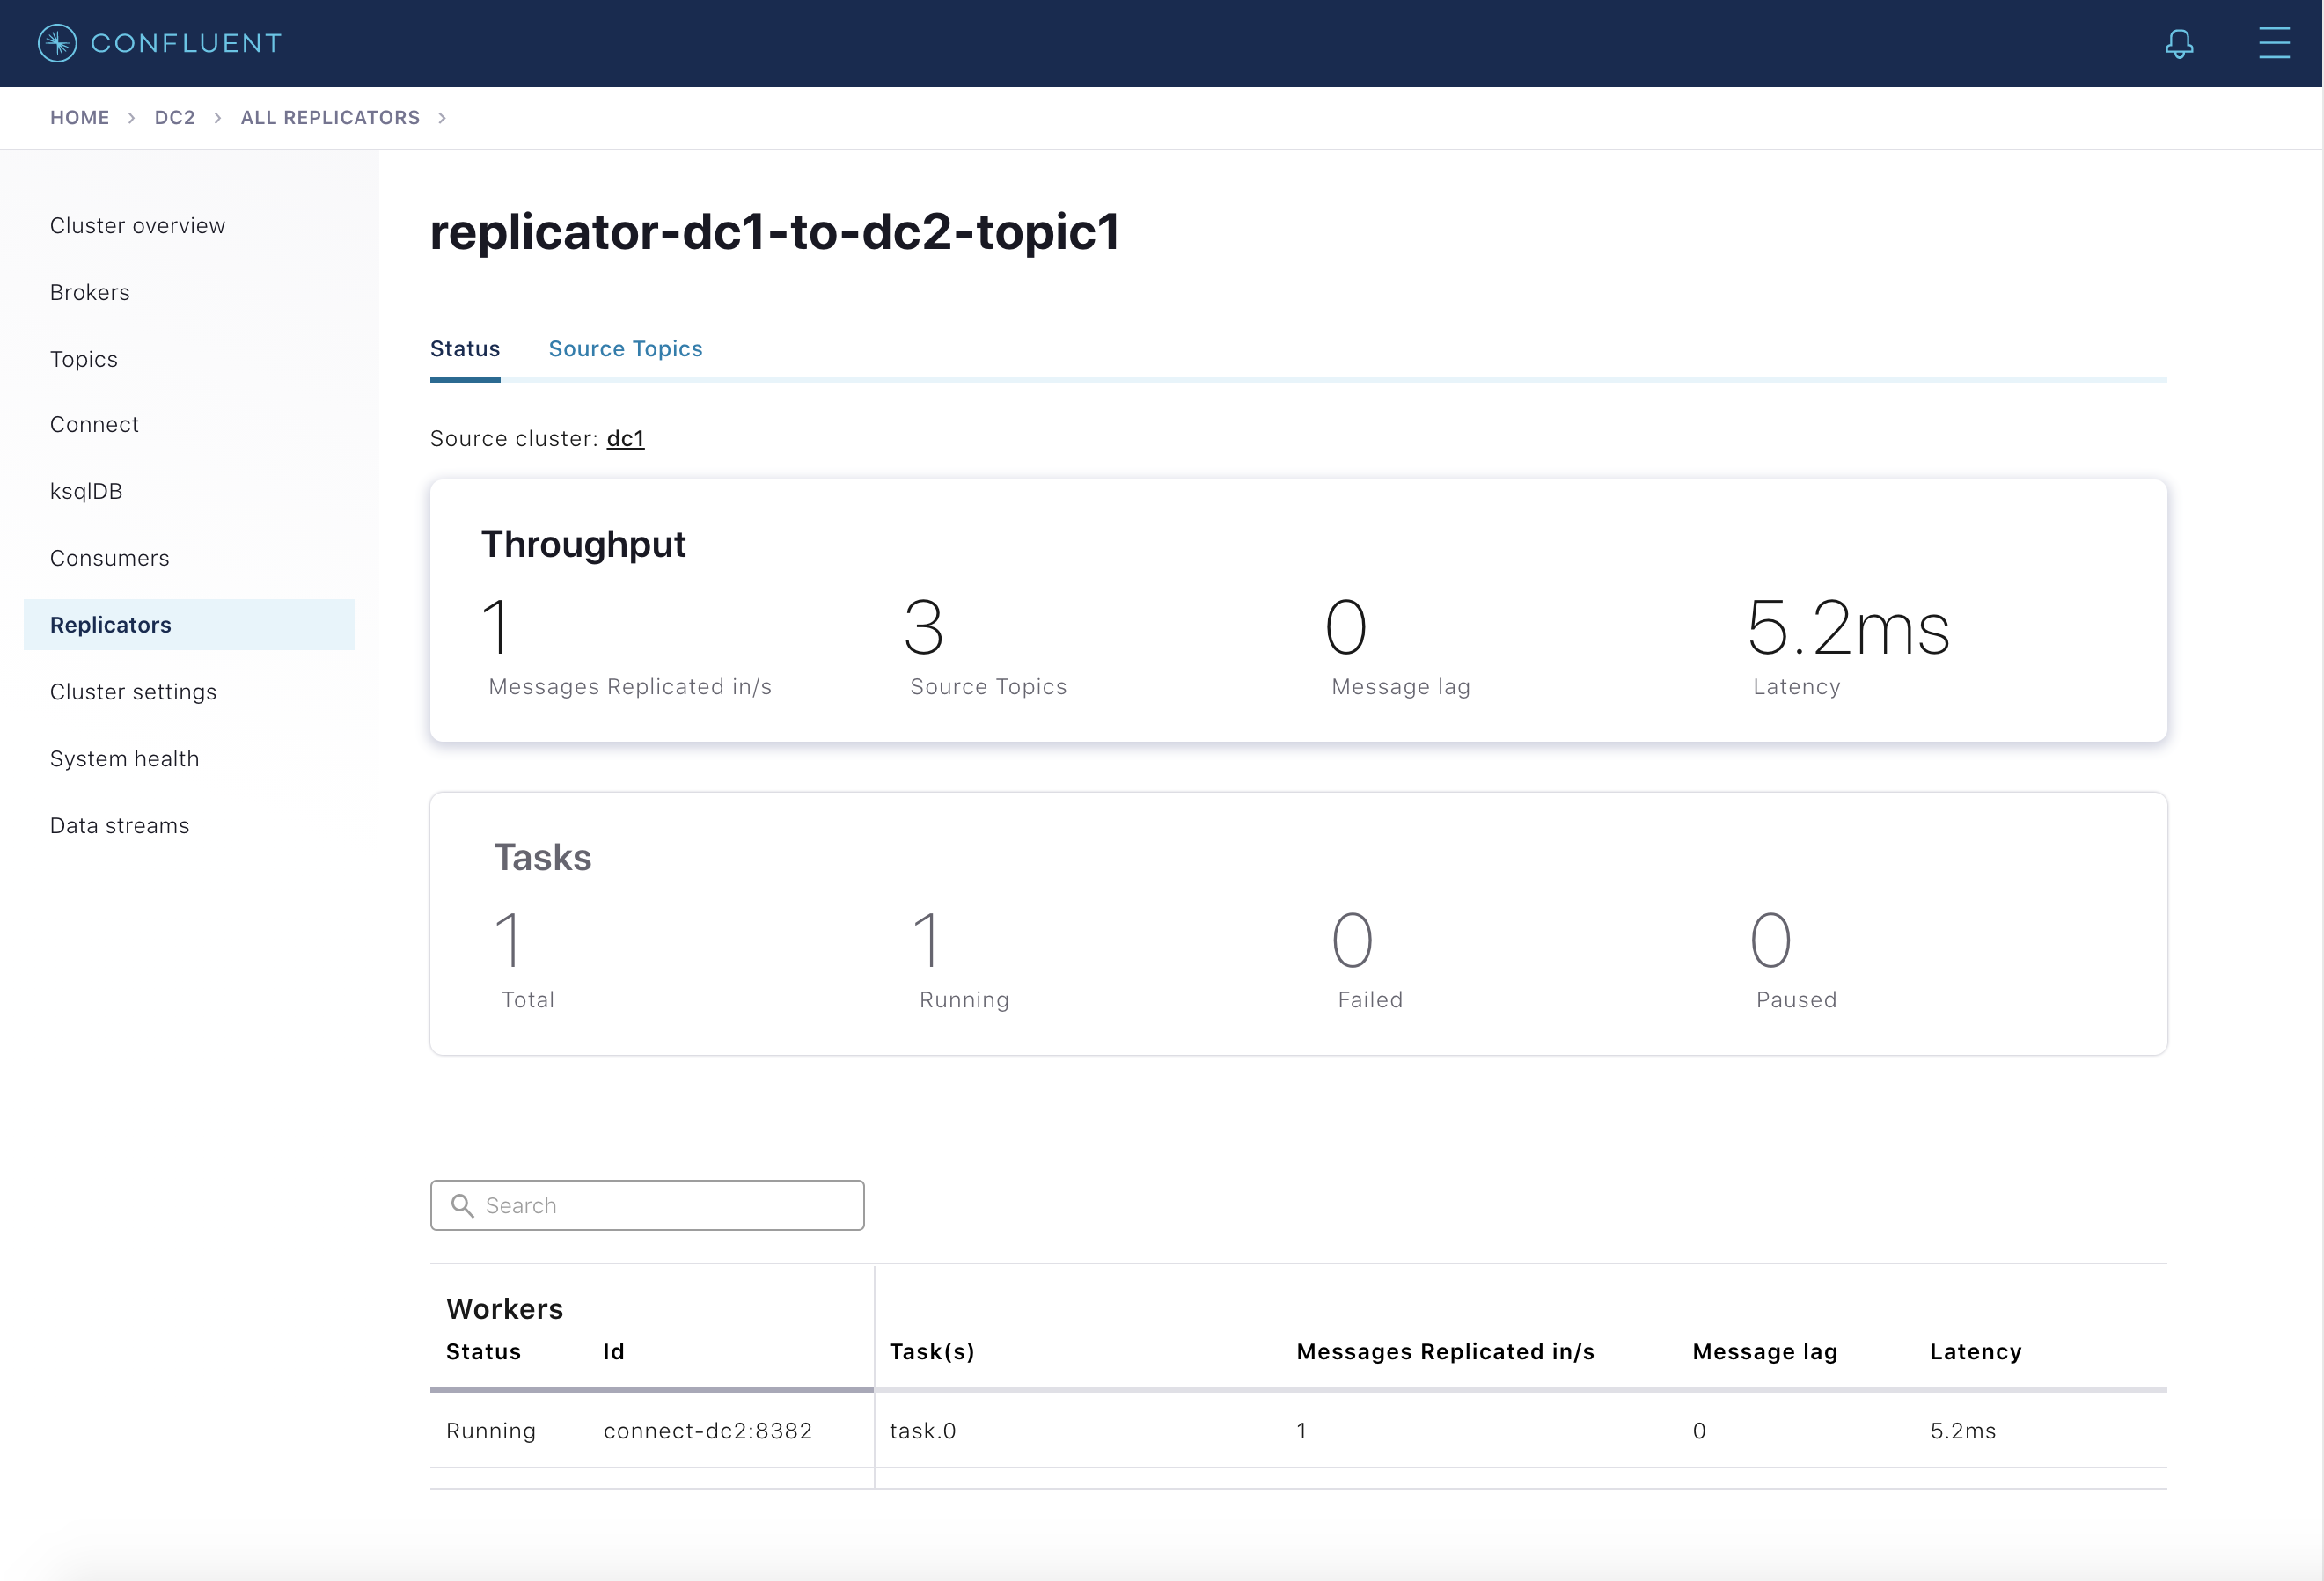
Further selecting the Throughput card shows detailed message lag broken down by Connect tasks and selecting any of the listed tasks shows metrics for the partitions that task is replicating.
Streams monitoring
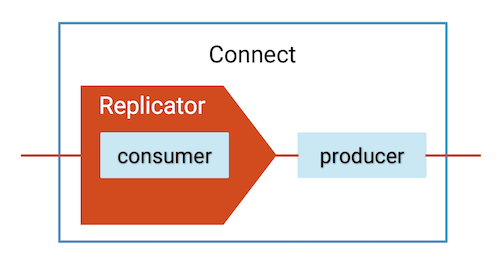
Control Center’s monitoring capabilities include monitoring stream performance: verifying that all data is consumed and at what throughput and latency. Monitoring can be displayed on a per-consumer group or per-topic basis. Confluent Replicator has an embedded consumer that reads data from the origin cluster, so you can monitor its performance in Control Center.
Select the
dc1Kafka cluster from the menu on the left and then select Data Streams. Verify that there are two consumer groups, one for reach Replicator instance running fromdc1todc2, calledreplicator-dc1-to-dc2-topic1andreplicator-dc1-to-dc2-topic2: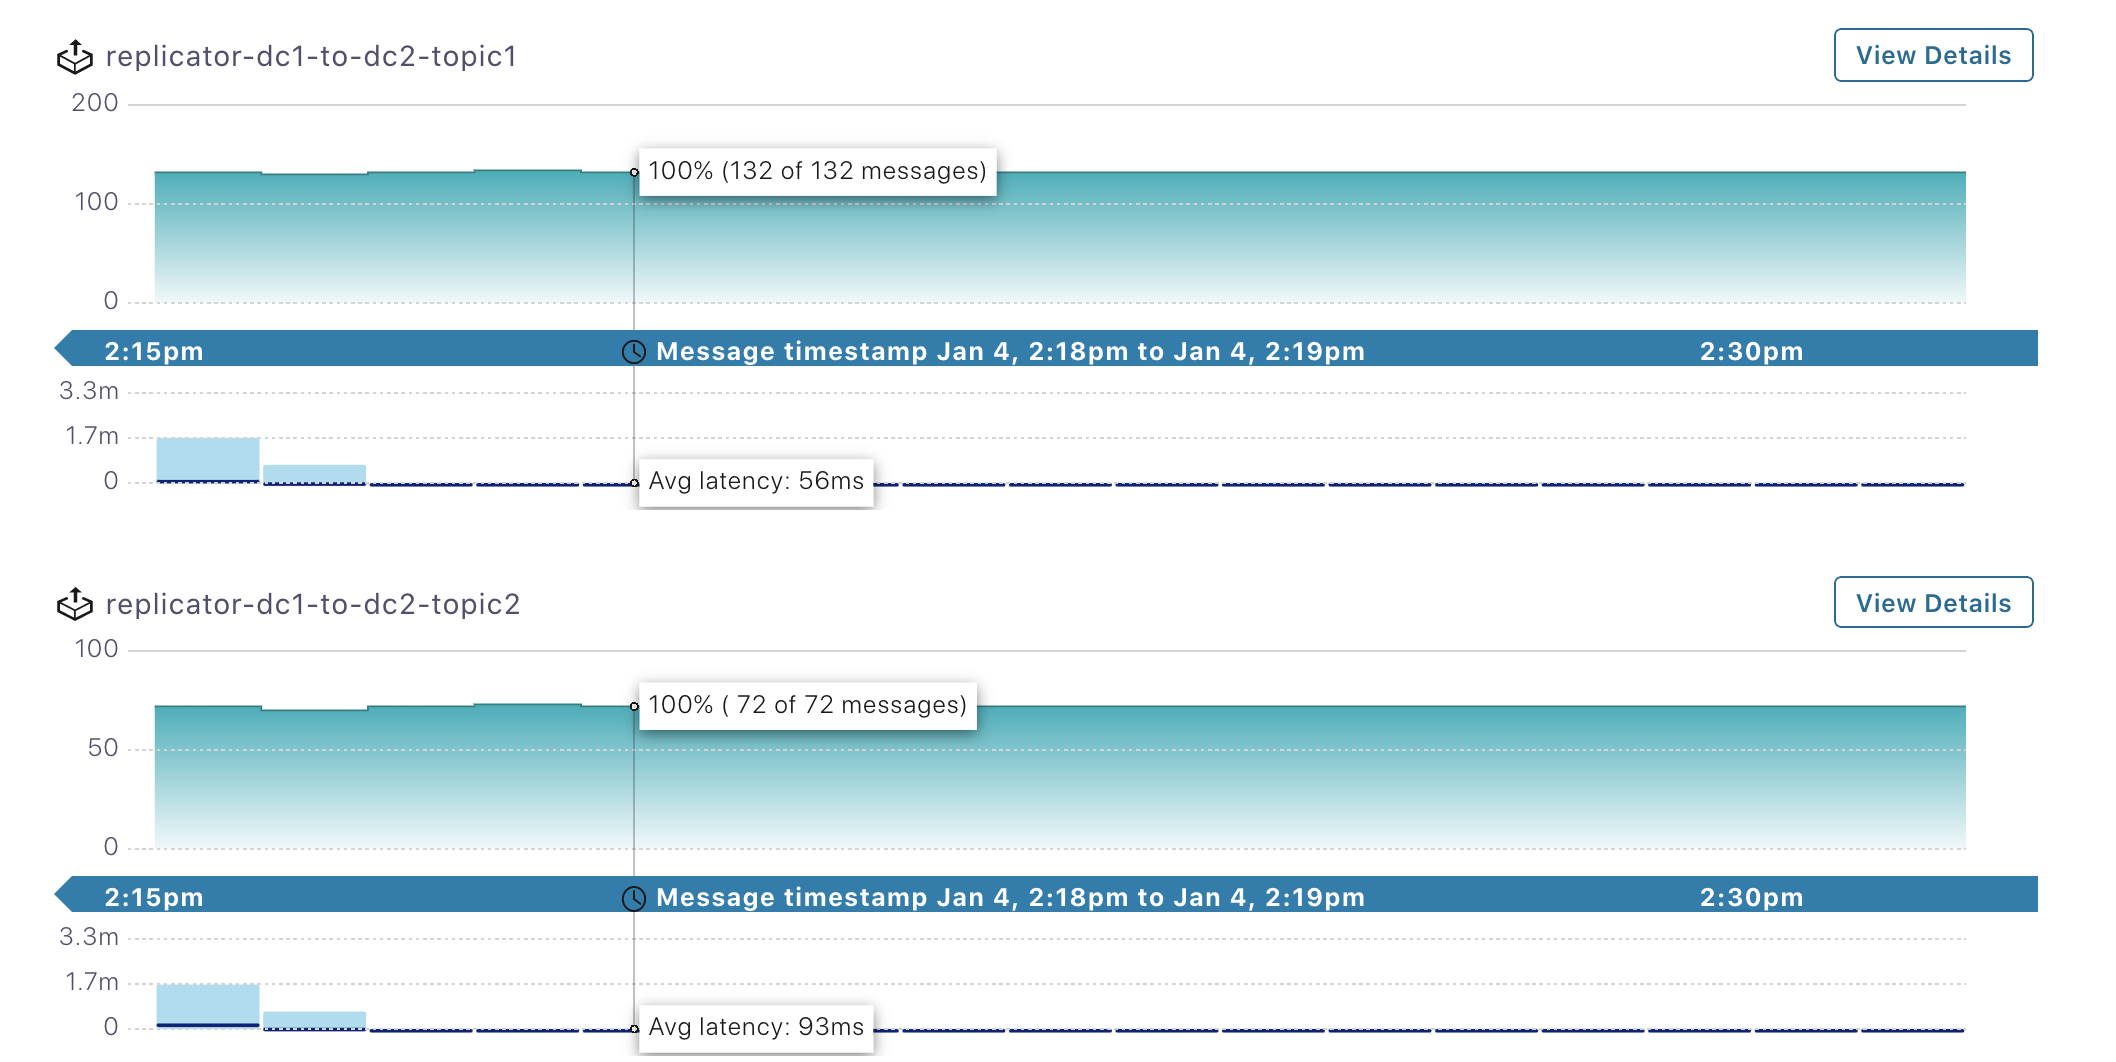
Select the
dc2Kafka cluster from the menu on the left and then select Data Streams. Verify that there is one consumer group running fromdc2todc1calledreplicator-dc2-to-dc1-topic1: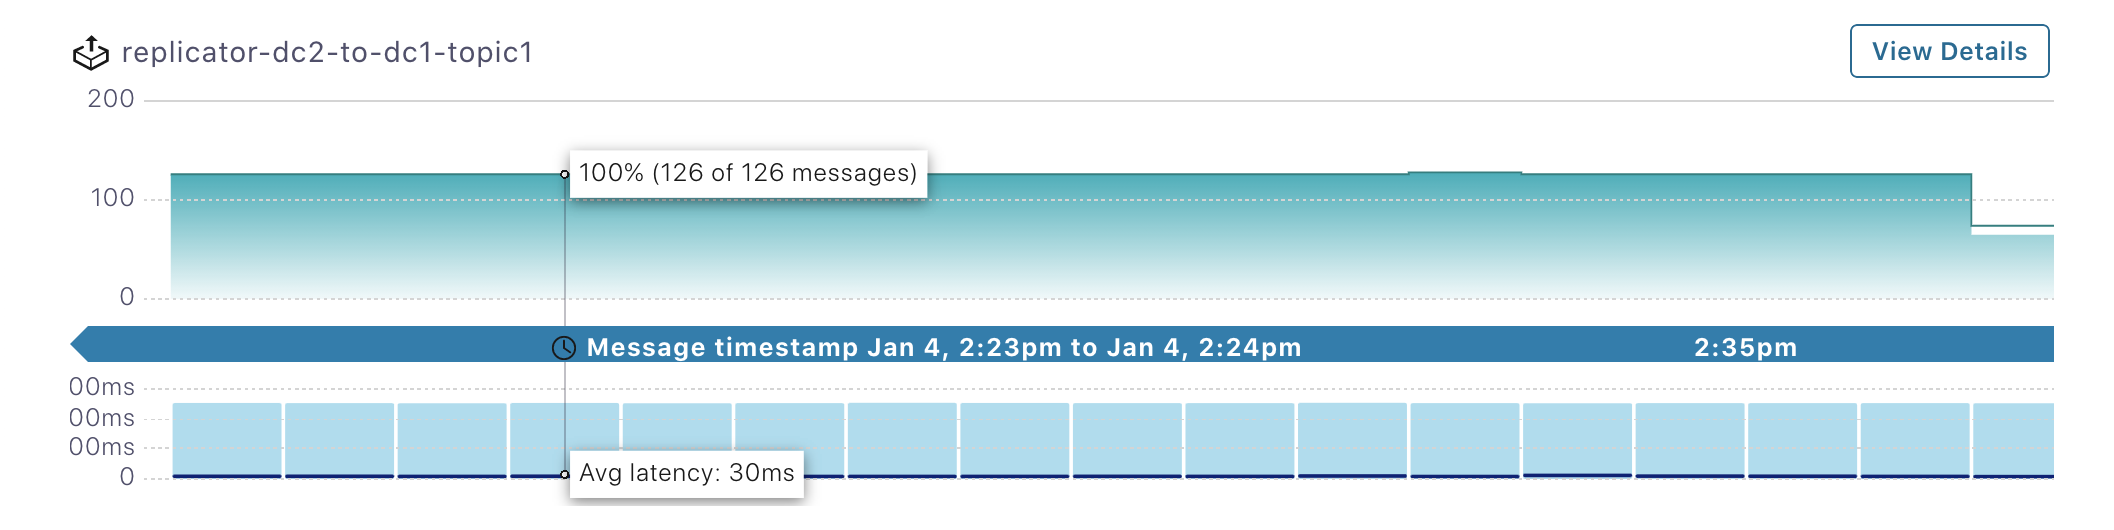
Consumer lag
Replicator has an embedded consumer that reads data from the origin cluster, and it commits its offsets only after the connect worker’s producer has committed the data to the destination cluster (configure the frequency of commits with the parameter offset.flush.interval.ms). You can monitor the consumer lag of Replicator’s embedded consumer in the origin cluster (for Replicator instances that copy data from dc1 to dc2, the origin cluster is dc1). The ability to monitor Replicator’s consumer lag is enabled when it is configured with offset.topic.commit=true (true by default), which allows Replicator to commit its own consumer offsets to the origin cluster dc1 after the messages have been written to the destination cluster.
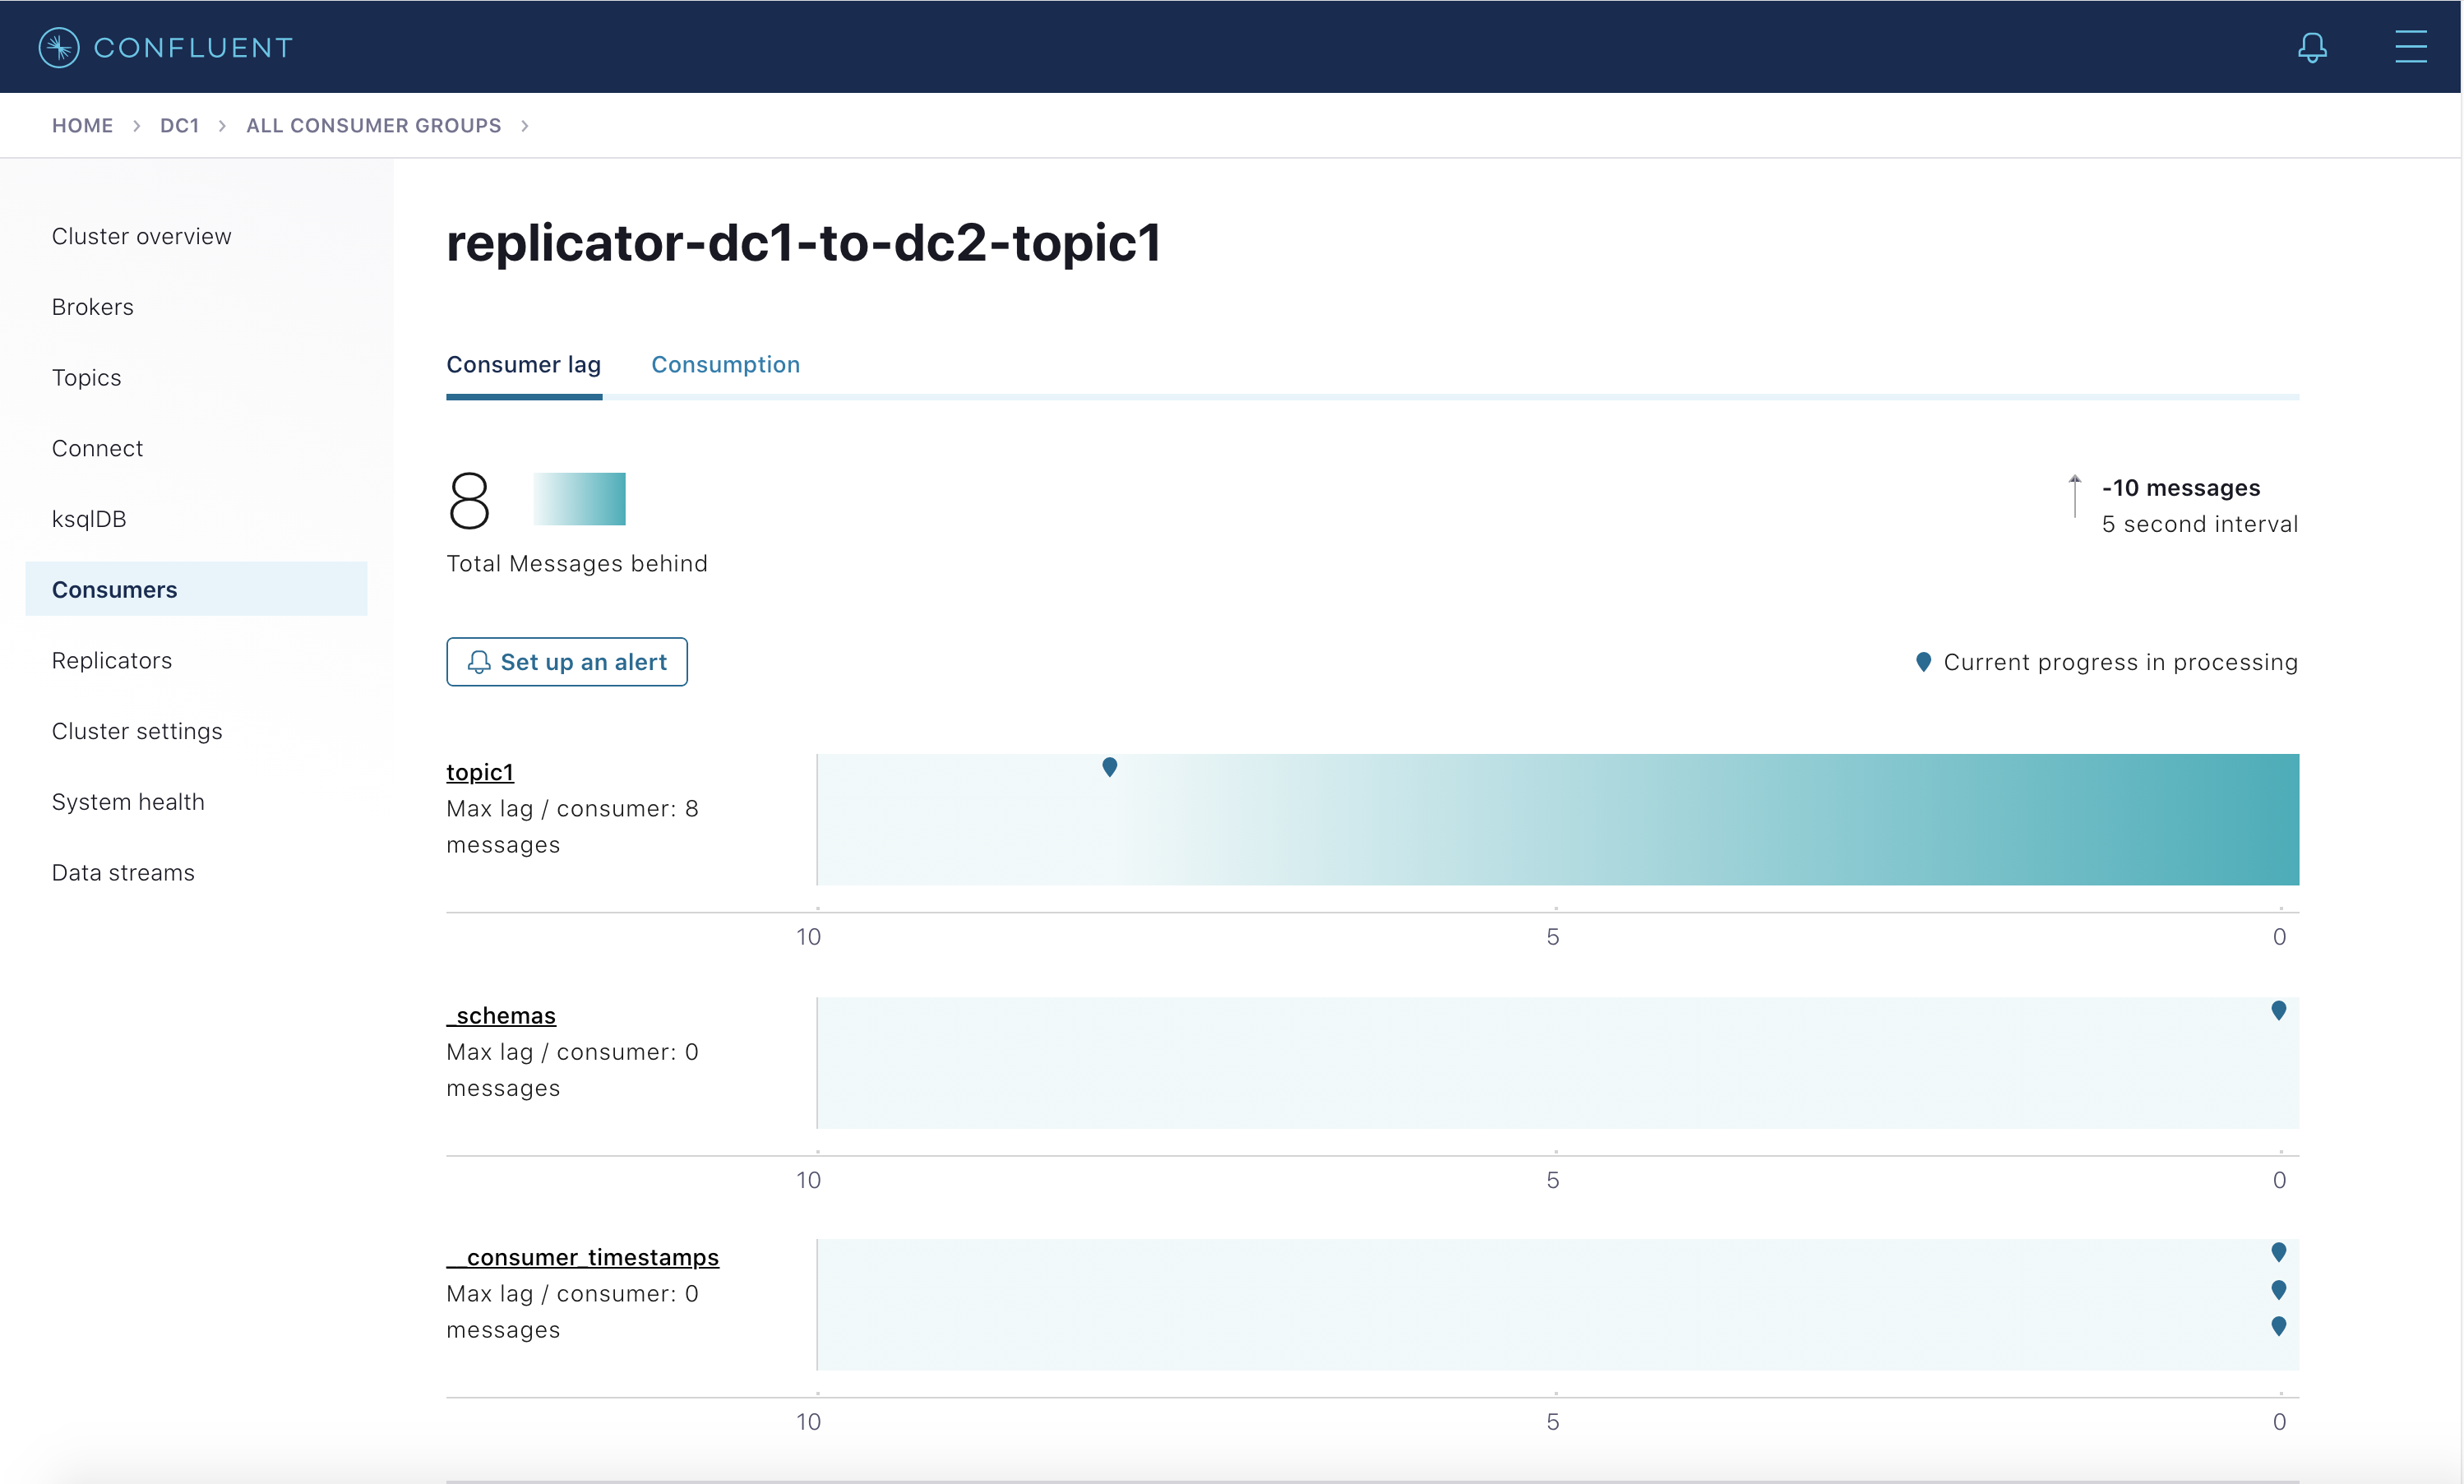
For Replicator copying from
dc1todc2: Selectdc1(origin cluster) from the menu on the left and then select Consumers. Verify that there are two consumer groups, one for reach Replicator instance running fromdc1todc2:replicator-dc1-to-dc2-topic1andreplicator-dc1-to-dc2-topic2. Replicator’s consumer lag information is available in Control Center andkafka-consumer-groups, but it is not available via JMX.Click on
replicator-dc1-to-dc2-topic1to view Replicator’s consumer lag in readingtopic1and_schemas. This view is equivalent to:docker-compose exec broker-dc1 kafka-consumer-groups --bootstrap-server broker-dc1:29091 --describe --group replicator-dc1-to-dc2-topic1
Click on
replicator-dc1-to-dc2-topic2to view Replicator’s consumer lag in readingtopic2(equivalent todocker-compose exec broker-dc1 kafka-consumer-groups --bootstrap-server broker-dc1:29091 --describe --group replicator-dc1-to-dc2-topic2)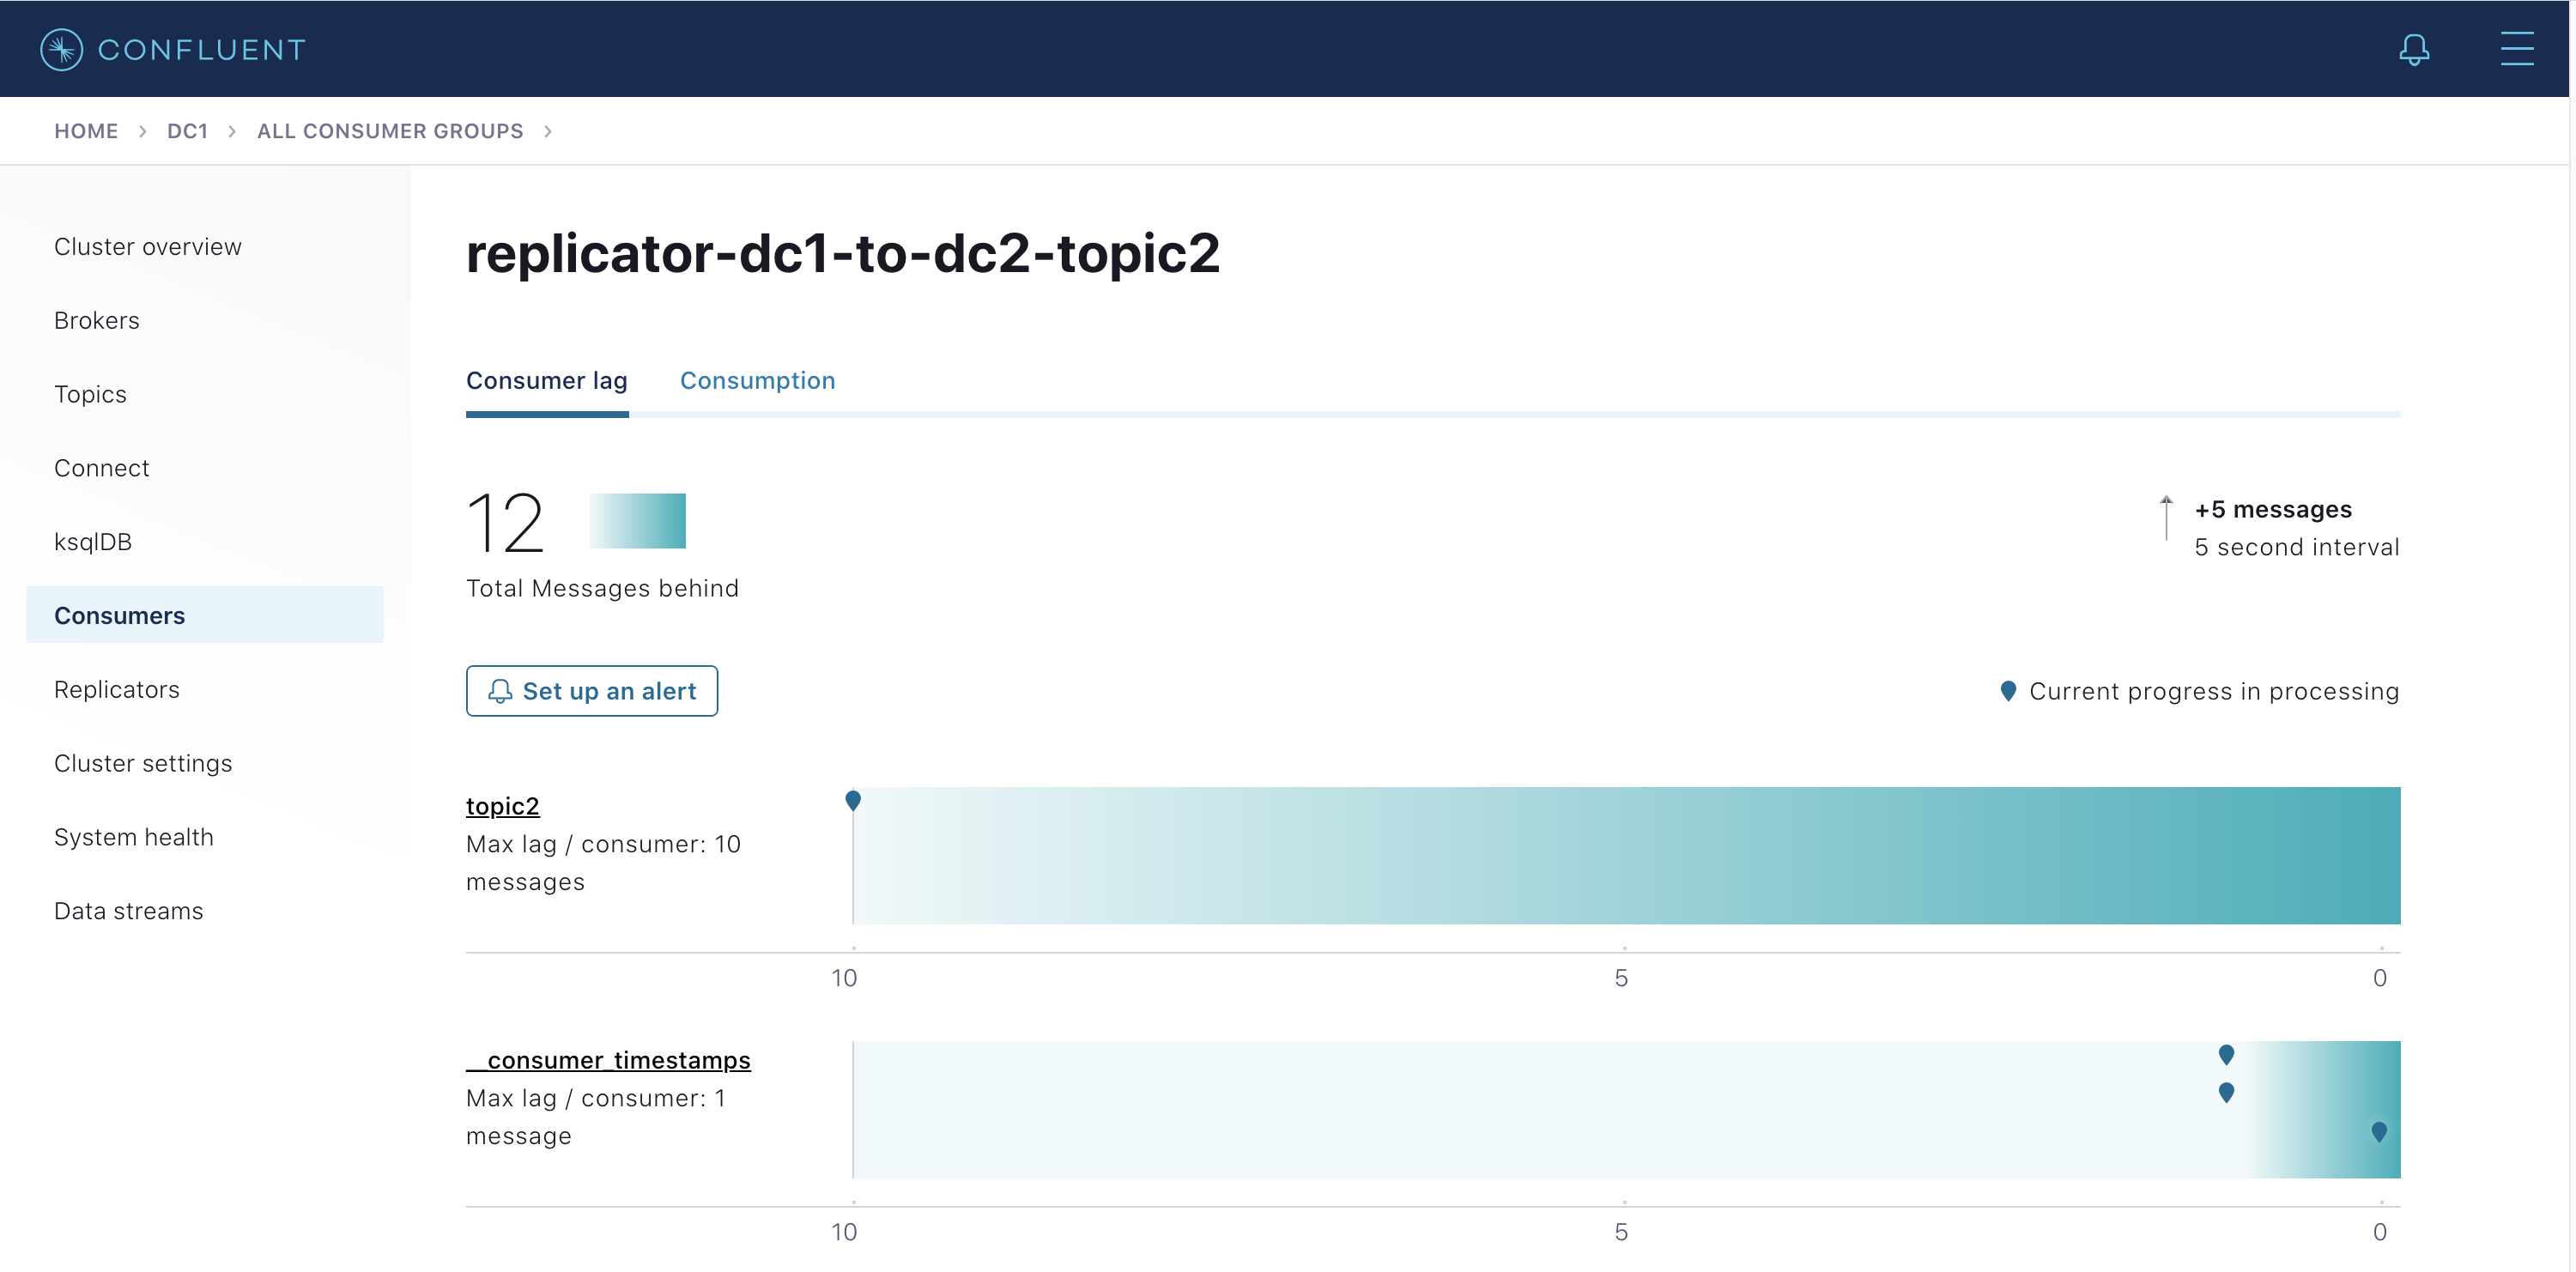
For Replicator copying from
dc1todc2: do not mistakenly try to monitor Replicator consumer lag in the destination clusterdc2. Control Center also shows the Replicator consumer lag for topics indc2(i.e.,topic1,_schemas,topic2.replica) but this does not mean that Replicator is consuming from them. The reason you see this consumer lag indc2is because by default Replicator is configured withoffset.timestamps.commit=truefor which Replicator commits its own offset timestamps of its consumer group in the__consumer_offsetstopic in the destination clusterdc2. In case of disaster recovery, this enables Replicator to resume where it left off when switching to the secondary cluster.Do not confuse consumer lag with an MBean attribute called
records-lagassociated with Replicator’s embedded consumer. That attribute reflects whether Replicator’s embedded consumer can keep up with the original data production rate, but it does not take into account replication lag producing the messages to the destination cluster.records-lagis real time, and it is normal for this value to be0.0.docker-compose exec connect-dc2 \ kafka-run-class kafka.tools.JmxTool \ --object-name "kafka.consumer:type=consumer-fetch-manager-metrics,partition=0,topic=topic1,client-id=replicator-dc1-to-dc2-topic1-0" \ --attributes "records-lag" \ --jmx-url service:jmx:rmi:///jndi/rmi://connect-dc2:9892/jmxrmi
Resume applications after failover
After a disaster event occurs, switch your Java consumer application to a different datacenter, and then it can automatically restart consuming data in the destination cluster where it left off in the origin cluster.
To use this capability, configure Java consumer applications with the Consumer Timestamps Interceptor, which is shown in this sample code.
After starting the demo (see previous section), run the consumer to connect to the
dc1Kafka cluster. It automatically configures the consumer group ID asjava-consumer-topic1and uses the Consumer Timestamps Interceptor.mvn clean package mvn exec:java -Dexec.mainClass=io.confluent.examples.clients.ConsumerMultiDatacenterExample -Dexec.args="topic1 localhost:9091 http://localhost:8081 localhost:9092"
Verify in the consumer output that it is reading data originating from both dc1 and dc2:
...
key = User_1, value = {"userid": "User_1", "dc": "dc1"}
key = User_9, value = {"userid": "User_9", "dc": "dc2"}
key = User_6, value = {"userid": "User_6", "dc": "dc2"}
...
Even though the consumer is consuming from dc1, there are dc2 consumer offsets committed for the consumer group
java-consumer-topic1. Run the following command to read from the__consumer_offsetstopic in dc2.docker-compose exec broker-dc2 \ kafka-console-consumer \ --topic __consumer_offsets \ --bootstrap-server localhost:9092 \ --formatter "kafka.coordinator.group.GroupMetadataManager\$OffsetsMessageFormatter" | grep java-consumer
Verify that there are committed offsets:
...
[java-consumer-topic1,topic1,0]::OffsetAndMetadata(offset=1142, leaderEpoch=Optional.empty, metadata=, commitTimestamp=1547146285084, expireTimestamp=None)
[java-consumer-topic1,topic1,0]::OffsetAndMetadata(offset=1146, leaderEpoch=Optional.empty, metadata=, commitTimestamp=1547146286082, expireTimestamp=None)
[java-consumer-topic1,topic1,0]::OffsetAndMetadata(offset=1150, leaderEpoch=Optional.empty, metadata=, commitTimestamp=1547146287084, expireTimestamp=None)
...
Kafka clients include any application that uses the Apache Kafka client API to connect to Kafka brokers, such as custom client code or any service that has embedded producers or consumers, such as Kafka Connect, ksqlDB, or a Kafka Streams application. Control Center uses that topic to ensure that all messages are delivered and to provide statistics on throughput and latency performance. From that same topic, you can also derive which producers are writing to which topics and which consumers are reading from which topics, and an example script is provided with the repo.
./map_topics_clients.py
Note
This script is for demo purposes only. It is not suitable for production.
In steady state with the Java consumer running, you should see:
Reading topic _confluent-monitoring for 60 seconds...please wait

__consumer_timestamps
  producers
    consumer-1
    producer-10
    producer-11
    producer-6
    producer-8
  consumers
    replicator-dc1-to-dc2-topic1
    replicator-dc1-to-dc2-topic2
    replicator-dc2-to-dc1-topic1

_schemas
  producers
    connect-worker-producer-dc2
  consumers
    replicator-dc1-to-dc2-topic1

topic1
  producers
    connect-worker-producer-dc1
    connect-worker-producer-dc2
    datagen-dc1-topic1
    datagen-dc2-topic1
  consumers
    java-consumer-topic1
    replicator-dc1-to-dc2-topic1
    replicator-dc2-to-dc1-topic1

topic2
  producers
    datagen-dc1-topic2
  consumers
    replicator-dc1-to-dc2-topic2

topic2.replica
  producers
    connect-worker-producer-dc2
Shut down
dc1:docker-compose stop connect-dc1 schema-registry-dc1 broker-dc1 zookeeper-dc1
Stop and restart the consumer to connect to the
dc2Kafka cluster. It will still use the same consumer group IDjava-consumer-topic1so it can resume where it left off:mvn exec:java -Dexec.mainClass=io.confluent.examples.clients.ConsumerMultiDatacenterExample -Dexec.args="topic1 localhost:9092 http://localhost:8082 localhost:9092"
Verify that see data sourced only from
dc2:... key = User_8, value = {"userid": "User_8", "dc": "dc2"} key = User_9, value = {"userid": "User_9", "dc": "dc2"} key = User_5, value = {"userid": "User_5", "dc": "dc2"} ...
Stop the demo
When you are done with the demo, stop it and remove Docker containers and images.
Run this script to stop all services, and remove the Docker containers and images:
./stop.sh
Run the following command to verify that no containers are running:
docker container ls