Quick Start for Confluent Platform
Confluent Platform is a data-streaming platform that completes Kafka with advanced capabilities designed to help accelerate application development and connectivity for enterprise use cases.
This quick start will help you get up and running locally with Confluent Platform and its main components using either Docker containers or ZIP/TAR archives. For production installation methods, see Install Confluent Platform On-Premises. In this quick start, you create Apache Kafka® topics, use Kafka Connect to generate mock data to those topics, and use Confluent Control Center to view your data.
Prefer a fully managed option?
Skip the local setup and start streaming in minutes with Confluent Cloud — no Docker, no manual installs. Sign up for Confluent Cloud with your cloud marketplace account and unlock $1000 in free credits: AWS Marketplace, Google Cloud Marketplace, or Microsoft Azure Marketplace.
Prerequisites
Prerequisites vary based on your installation method. Choose your preferred method below.
To run this quick start using Docker, you need Git, Docker, and Docker Compose installed on a computer with a supported Operating System. Make sure Docker is running.
Detailed prerequisites
A connection to the internet.
Operating System currently supported by Confluent Platform.
Note
You can run the Confluent Platform Quick Start on Windows if you are running Docker Desktop for Windows on WSL 2. For more information, see How to Run Confluent on Windows in Minutes.
Docker version 1.11 or later is installed and running.
On Mac: Docker memory is allocated minimally at 6 GB (Mac). When using Docker Desktop for Mac, the default Docker memory allocation is 2 GB. Change the default allocation to 6 GB in the Docker Desktop app by navigating to Preferences > Resources > Advanced.
To run this quick start using ZIP/TAR archives, you need the following:
A connection to the internet.
Operating System currently supported by Confluent Platform.
Java 21 or Java 17 installed.
Note
The confluent local commands are intended for single-node development environments and are not suitable for production. For production deployments, see Install and Upgrade Confluent Platform.
Step 1: Download and start Confluent Platform
Choose your preferred installation method using the tabs below.
In this step, you start by cloning a GitHub repository. This repository contains a Docker compose file and some required configuration files. The docker-compose.yml file sets ports and Docker environment variables such as the replication factor and listener properties for Confluent Platform and its components. To learn more about the settings in this file, see Docker Image Configuration Reference for Confluent Platform.
Clone the Confluent Platform all-in-one example repository, for example:
git clone https://github.com/confluentinc/cp-all-in-one.git
Change to the cloned repository’s root directory:
cd cp-all-in-one
The default branch may not be the latest. Check out the branch for the version you want to run, for example, 8.2.0-post:
git checkout 8.2.0-post
The
docker-compose.ymlfile is located in a nested directory. Navigate into the following directory:cd cp-all-in-one
Start the Confluent Platform stack with the
-doption to run in detached mode:docker compose up -d
Note
If you are using Docker Compose V1, you need to use a dash in the
docker composecommands. For example:docker-compose up -d
To learn more, see Migrate to Compose V2.
Each Confluent Platform component starts in a separate container. Your output should resemble the following. Your output may vary slightly from these examples depending on your operating system.
✔ Network cp-all-in-one_default  Created       0.0s
✔ Container prometheus           Started       0.7s
✔ Container broker               Started       0.7s
✔ Container flink-jobmanager     Started       0.7s
✔ Container flink-sql-client     Started       0.7s
✔ Container flink-taskmanager    Started       0.7s
✔ Container alertmanager         Started       0.7s
✔ Container schema-registry      Started       0.7s
✔ Container connect              Started       0.7s
✔ Container rest-proxy           Started       0.7s
✔ Container ksqldb-server        Started       0.7s
✔ Container control-center       Started       0.8s
Verify that the services are up and running:
docker compose ps
Your output should resemble:
NAME                IMAGE                                                       COMMAND                  SERVICE             CREATED         STATUS         PORTS
alertmanager        confluentinc/cp-enterprise-alertmanager:2.2.1               "alertmanager-start"     alertmanager        3 minutes ago   Up 3 minutes   0.0.0.0:9093->9093/tcp, [::]:9093->9093/tcp
broker              confluentinc/cp-server:8.2.0                                "/etc/confluent/dock…"   broker              3 minutes ago   Up 3 minutes   0.0.0.0:9092->9092/tcp, [::]:9092->9092/tcp, 0.0.0.0:9101->9101/tcp, [::]:9101->9101/tcp
connect             cnfldemos/cp-server-connect-datagen:0.6.4-7.6.0             "/etc/confluent/dock…"   connect             3 minutes ago   Up 3 minutes   0.0.0.0:8083->8083/tcp, [::]:8083->8083/tcp
control-center      confluentinc/cp-enterprise-control-center-next-gen:2.2.1    "/etc/confluent/dock…"   control-center      3 minutes ago   Up 3 minutes   0.0.0.0:9021->9021/tcp, [::]:9021->9021/tcp
flink-jobmanager    cnfldemos/flink-kafka:1.19.1-scala_2.12-java17              "/docker-entrypoint.…"   flink-jobmanager    3 minutes ago   Up 3 minutes   0.0.0.0:9081->9081/tcp, [::]:9081->9081/tcp
flink-sql-client    cnfldemos/flink-sql-client-kafka:1.19.1-scala_2.12-java17   "/docker-entrypoint.…"   flink-sql-client    3 minutes ago   Up 3 minutes   6123/tcp, 8081/tcp
flink-taskmanager   cnfldemos/flink-kafka:1.19.1-scala_2.12-java17              "/docker-entrypoint.…"   flink-taskmanager   3 minutes ago   Up 3 minutes   6123/tcp, 8081/tcp
ksqldb-server       confluentinc/cp-ksqldb-server:8.2.0                         "/etc/confluent/dock…"   ksqldb-server       3 minutes ago   Up 3 minutes   0.0.0.0:8088->8088/tcp, [::]:8088->8088/tcp
prometheus          confluentinc/cp-enterprise-prometheus:2.2.1                 "prometheus-start"       prometheus          3 minutes ago   Up 3 minutes   0.0.0.0:9090->9090/tcp, [::]:9090->9090/tcp
rest-proxy          confluentinc/cp-kafka-rest:8.2.0                            "/etc/confluent/dock…"   rest-proxy          3 minutes ago   Up 3 minutes   0.0.0.0:8082->8082/tcp, [::]:8082->8082/tcp
schema-registry     confluentinc/cp-schema-registry:8.2.0                       "/etc/confluent/dock…"   schema-registry     3 minutes ago   Up 3 minutes   0.0.0.0:8081->8081/tcp, [::]:8081->8081/tcp
After a few minutes, if the state of any component isn’t Up, run the
docker compose up -dcommand again, or trydocker compose restart <image-name>, for example:docker compose restart control-center
In the next few steps, you download and extract Confluent Platform, then use the Confluent CLI to start Confluent Platform services locally in KRaft mode. This method starts the core Confluent Platform components including a KRaft controller, broker, Schema Registry, REST Proxy, Connect, and ksqlDB. You download and start Control Center separately.
Important
The Confluent CLI confluent local commands are intended for a single-node development environment and are not suitable for a production environment. The data that are produced are transient and are intended to be temporary. For production-ready workflows, see Install and Upgrade Confluent Platform.
Download the Confluent Platform TAR archive and extract it:
curl -O https://packages.confluent.io/archive/8.2/confluent-8.2.0.tar.gz
tar -xvf confluent-8.2.0.tar.gz
cd confluent-8.2.0
export CONFLUENT_HOME=`pwd`
Add the Confluent Platform
bindirectory to your PATH:export PATH=$PATH:$CONFLUENT_HOME/bin
Install the Connect Datagen source connector using the Confluent Marketplace client. This connector generates mock data for demonstration purposes and is not suitable for production. For more connectors, see Confluent Hub.
confluent-hub install --no-prompt confluentinc/kafka-connect-datagen:latest
Start all Confluent Platform services:
confluent local services start
Every service starts in order, printing a message with its status:
Starting KRaft Controller
KRaft Controller is [UP]
Starting Kafka
Kafka is [UP]
Starting Schema Registry
Schema Registry is [UP]
Starting Kafka REST
Kafka REST is [UP]
Starting Connect
Connect is [UP]
Starting ksqlDB Server
ksqlDB Server is [UP]
Verify that the services are running:
confluent local services status
Now, install and configure Control Center to work with your local Confluent Platform installation. As of Confluent Platform 8.0, Confluent Control Center is installed and runs separately from Confluent Platform. Follow these steps to install and configure Control Center to work with your local Confluent Platform installation. Installing Control Center requires three additional terminal windows for Prometheus, Alert Manager, and Control Center.
Start a new terminal window, then download and extract Control Center.
curl -O https://packages.confluent.io/confluent-control-center-next-gen/archive/confluent-control-center-next-gen-2.3.1.tar.gz
tar -xvf confluent-control-center-next-gen-2.3.1.tar.gz
cd confluent-control-center-next-gen-2.3.1
Set the
CONTROL_CENTER_HOMEenvironment variable:export CONTROL_CENTER_HOME=`pwd`
Configure Prometheus to connect to Alert Manager on a non-default port.
By default, Alert Manager and the KRaft controller (started in step 3) both use port 9093. To avoid a conflict, you must configure Alert Manager to use port 9098.
Edit
etc/confluent-control-center/prometheus-generated.yml, locate thealertmanagerssection, and change the target port from 9093 to 9098.alerting: alertmanagers: - static_configs: - targets: - localhost:9098
In the same terminal window or a new one, start Prometheus. If Prometheus starts successfully, you will not see any output.
On Linux or Windows:
bin/prometheus-start
On macOS:
bash bin/prometheus-start
In a new terminal window, navigate to the Control Center directory and start Alert Manager. If Alert Manager starts successfully, you will not see any output.
Navigate to the directory and set the home variable:
cd confluent-control-center-next-gen-2.3.1
export CONTROL_CENTER_HOME=`pwd`
Start Alert Manager using the
ALERTMANAGER_PORTenvironment variable to avoid the port conflict:On Linux or Windows:
export ALERTMANAGER_PORT=9098
bin/alertmanager-start
On macOS:
export ALERTMANAGER_PORT=9098
bash bin/alertmanager-start
In another new terminal window, start Control Center:
Navigate to the Control Center directory:
cd confluent-control-center-next-gen-2.3.1
Set the home variable:
export CONTROL_CENTER_HOME=`pwd`
Configure Control Center to connect to Alert Manager on the new port. Edit
$CONTROL_CENTER_HOME/etc/confluent-control-center/control-center-dev.propertiesand uncomment or add the following line:confluent.controlcenter.alertmanager.url=http://localhost:9098
Run the start script with your updated properties file:
./bin/control-center-start $CONTROL_CENTER_HOME/etc/confluent-control-center/control-center-dev.properties
Open Control Center in your browser at http://localhost:9021. It may take a few minutes for Control Center to start and load.
For more details on Control Center installation, see Control Center Installation.
Step 2: Create Kafka topics for storing your data
In Confluent Platform, real-time streaming events are stored in a topic, which is an append-only log, and the fundamental unit of organization for Kafka. To learn more about Kafka basics, see Kafka Introduction.
In this step, you create two topics by using Control Center for Confluent Platform. Control Center provides the features for building and monitoring production data pipelines and event streaming applications.
The topics are named pageviews and users. In later steps, you create connectors that produce data to these topics.
Create the pageviews topic
Confluent Control Center enables creating topics in the UI with a few clicks.
Navigate to Control Center at http://localhost:9021. It takes a few minutes for Control Center to start and load. If needed, refresh your browser until it loads.
Click the controlcenter.cluster tile.
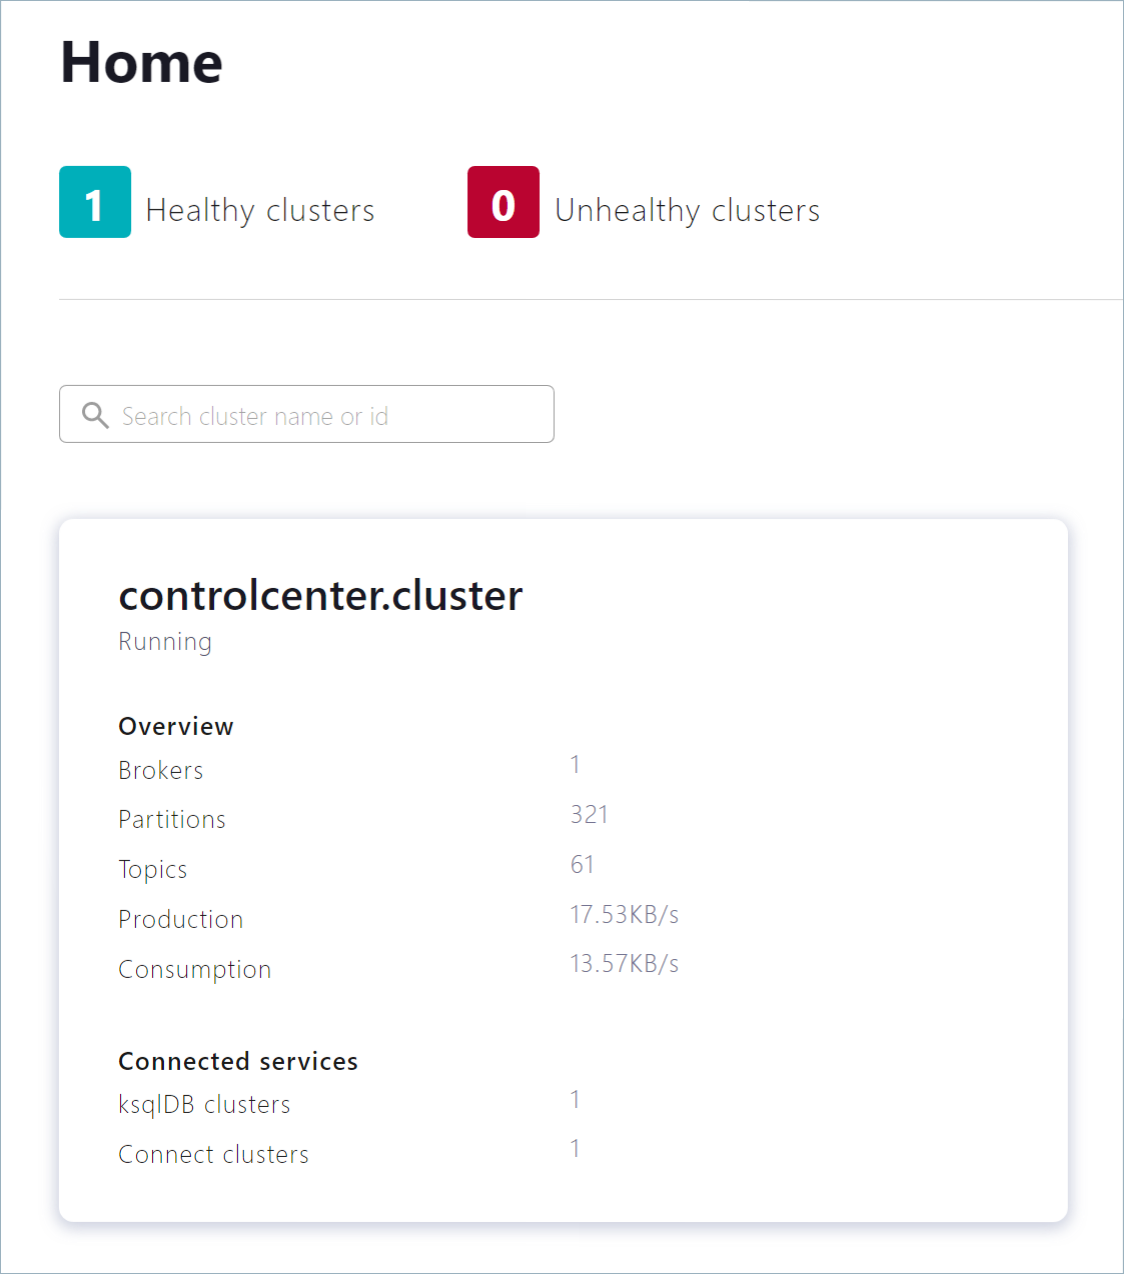
In the navigation menu, click Topics to open the topics list. Click + Add topic to start creating the
pageviewstopic.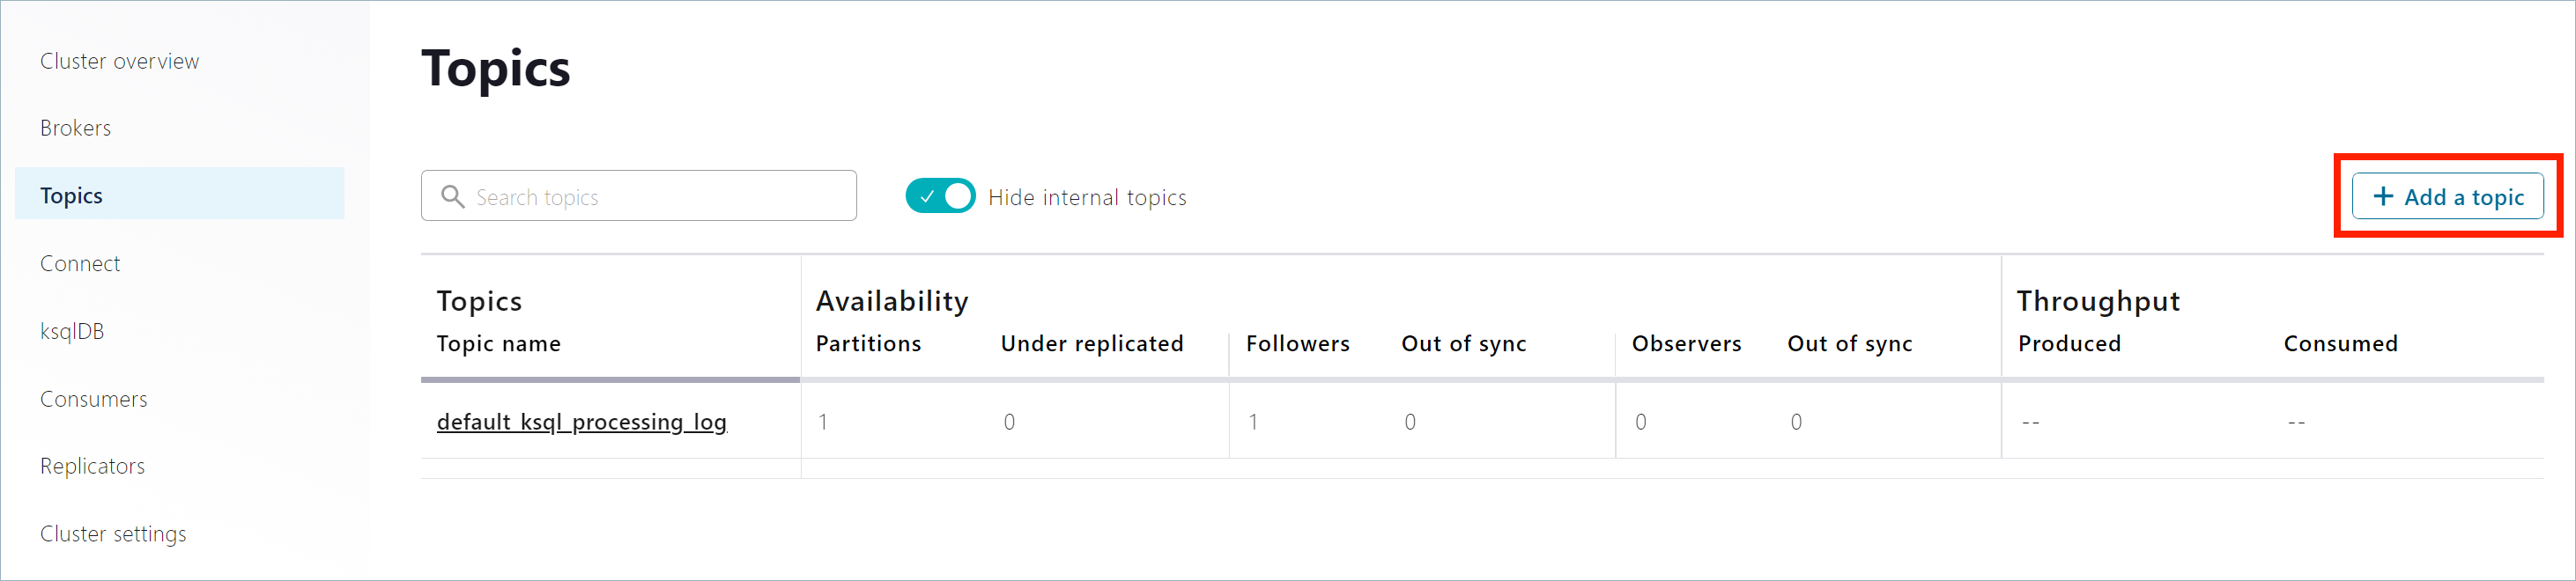
In the Topic name field, enter
pageviewsand click Create with defaults. Topic names are case-sensitive.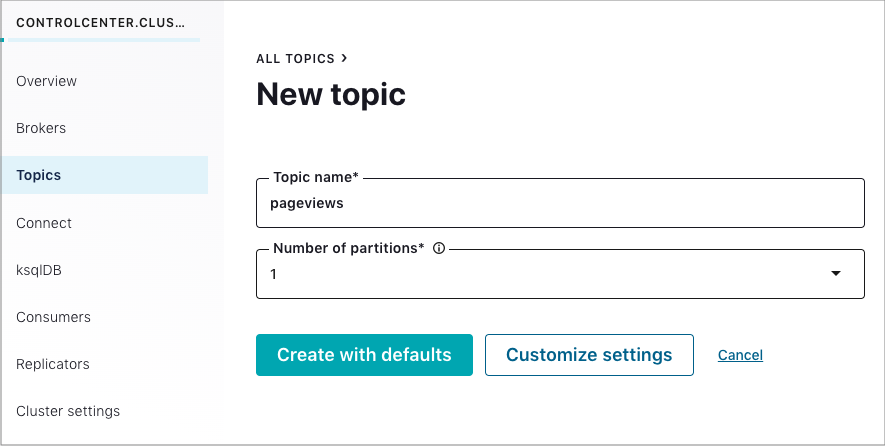
Create the users topic
Repeat the previous steps to create the users topic.
In the navigation menu, click Topics to open the topics list. Click + Add topic to start creating the
userstopic.In the Topic name field, enter
usersand click Create with defaults.You can optionally inspect a topic. On the users page, click Configuration to see details about the
userstopic.
Step 3: Generate mock data
In Confluent Platform, you get events from an external source by using Kafka Connect. Connectors enable you to stream large volumes of data to and from your Kafka cluster. Confluent publishes many connectors for integrating with external systems, like MongoDB and Elasticsearch. For more information, see the Kafka Connect Overview page.
In this step, you run the Datagen Source Connector to generate mock data. The mock data is stored in the pageviews and users topics that you created previously. To learn more about installing connectors, see Install Self-Managed Connectors for Confluent Platform.
In the navigation menu, click Connect.
Click the
connect-defaultcluster in the Connect clusters list.Click Add connector to start creating a connector for pageviews data.
Select the
DatagenConnectortile.Tip
To see source connectors only, click Filter by category and select Sources.
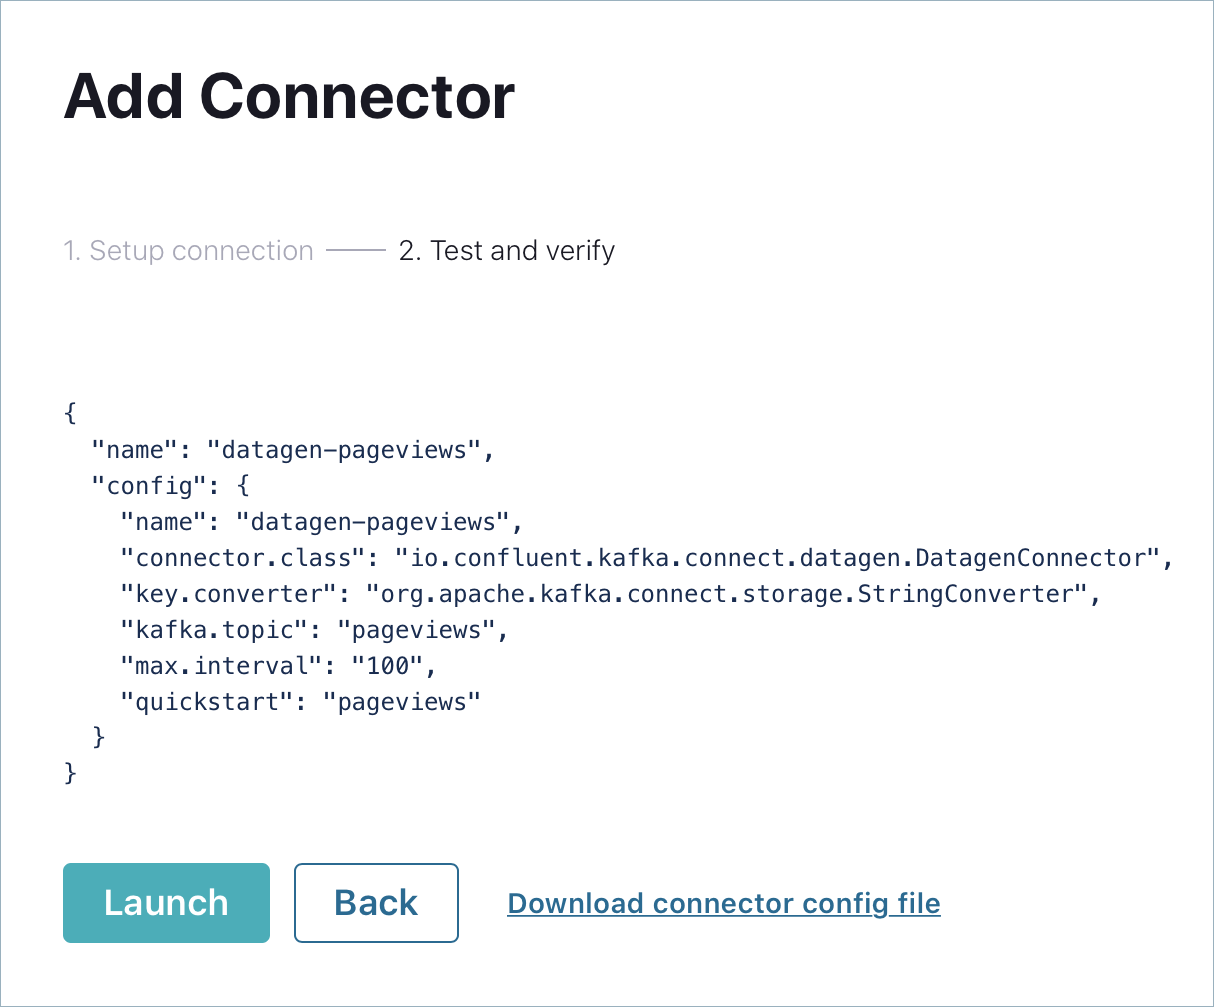
In the Name field, enter
datagen-pageviewsas the name of the connector.Enter the following configuration values in the following sections:
Common section:
Key converter class:
org.apache.kafka.connect.storage.StringConverter
General section:
kafka.topic: Choose
pageviewsfrom the dropdown menumax.interval:
100quickstart:
pageviews
Click Next to review the connector configuration. When you’re satisfied with the settings, click Launch.
Run a second instance of the Datagen Source connector connector to produce mock data to the users topic.
In the navigation menu, click Connect.
In the Connect clusters list, click
connect-default.Click Add connector.
Select the
DatagenConnectortile.In the Name field, enter
datagen-usersas the name of the connector.Enter the following configuration values:
Common section:
Key converter class:
org.apache.kafka.connect.storage.StringConverter
General section:
kafka.topic: Choose
usersfrom the dropdown menumax.interval:
1000quickstart:
users
Click Next to review the connector configuration. When you’re satisfied with the settings, click Launch.
In the navigation menu, click Topics and in the list, click users.
Click Messages to confirm that the
datagen-usersconnector is producing data to theuserstopic.
Inspect the schema of a topic
By default, the Datagen Source Connector produces data in Avro format, which defines the schemas of pageviews and users messages.
Schema Registry ensures that messages sent to your cluster have the correct schema. For more information, see Schema Registry Documentation.
In the navigation menu, click Topics, and in the topic list, click pageviews.
Click Schema to inspect the Avro schema that applies to
pageviewsmessage values.Your output should resemble:

Step 4: Uninstall and clean up
When you’re done working with Confluent Platform, clean up using the method that matches your installation.
Stop and remove the Docker containers and images.
Run the following command to stop the Docker containers for Confluent:
docker compose stop
After stopping the Docker containers, run the following commands to prune the Docker system. Running these commands deletes containers, networks, volumes, and images, freeing up disk space:
docker system prune -a --volumes --filter "label=io.confluent.docker"
For more information, refer to the official Docker documentation.
Stop all services and clean up the temporary data.
If you installed Control Center, stop it first by pressing
Ctrl+Cin the terminal windows running Control Center, Alert Manager, and Prometheus.In the terminal window running Confluent services, stop all Confluent Platform services and delete the temporary data:
confluent local services stop
Your output should resemble:
Stopping ksqlDB Server
ksqlDB Server is [DOWN]
Stopping Connect
Connect is [DOWN]
Stopping Kafka REST
Kafka REST is [DOWN]
Stopping Schema Registry
Schema Registry is [DOWN]
Stopping Kafka
Kafka is [DOWN]
Stopping KRaft Controller
KRaft Controller is [DOWN]
To stop all services and delete all temporary data created during this quick start:
confluent local destroy
This removes all data stored in the temporary directory used by
confluent local.