Configure Telemetry Reporter for Confluent Platform
Important
Confluent Health+ is in the End-of-Life (EOL) process.
Health+ is deprecated and users should plan to migrate to Unified Stream Manager (USM). While Health+ remains operational for existing users, it is scheduled to be retired, or to sunset, on December 31, 2026. Starting with Confluent Platform version 8.1, Health+ is discontinued for new deployments and Unified Stream Manager is the recommended alternative for all users.
To begin your migration planning, see Unified Stream Manager in Confluent Platform.
The Confluent Telemetry Reporter is a plugin that runs inside each Confluent Platform service to push metadata about the service to Confluent. Telemetry Reporter enables product features based on the metadata, like Health+. Data is sent over HTTP using an encrypted connection.
For a list of available metrics, see Telemetry Reporter Metrics Reference for Confluent Platform.
Important
If Self-Balancing is enabled on the cluster, Telemetry Reporter is enabled and runs by default as a requirement of Self-Balancing Clusters. The Self-Balancing algorithm consumes from the Telemetry Reporter internal topic _confluent-telemetry-metrics.
If Self-Balancing is not enabled on the cluster, the Telemetry Reporter can be fully disabled using the
confluent.reporters.telemetry.auto.enable=falseproperty setting in the server configuration file at$CONFLUENT_HOME/etc/kafka/server.properties.No data is sent to Confluent Cloud if you set
confluent.telemetry.enabledtofalse.
Installation
Confluent Telemetry Reporter is installed as part of the full Confluent Platform installation. If you choose to install packages individually, ensure that Telemetry Reporter is installed by using yum install confluent-telemetry or the equivalent package manager command for your environment.
Enable telemetry reporting to Confluent Cloud
- Prerequisites
Internet connectivity either directly or through a proxy
Confluent Platform 6.0 or higher
Create a Cloud API key and secret
The following steps show how to create an API key and secret to authenticate with Confluent Cloud.
Cloud API keys are distinct from Kafka cluster API keys. For Telemetry Reporter, you must use a Cloud API Key, not a Kafka cluster API key. Using a cluster key causes an authentication error.
Log in to Confluent Cloud by using the
confluent logincommand.Use the confluent iam service-account create command to create a service account for your telemetry data.
confluent iam service-account create <telemetry-sa-name> --description "<telemetry-sa-description>"
Your output should resemble:
+-------------+---------------------------+
| ID          | sa-abc123                 |
| Name        | telemetry-sa              |
| Description | telemetry service account |
+-------------+---------------------------+
Note the service account ID, which you use in the next step.
Use the confluent api-key create command to create a Cloud API key for the service account.
confluent api-key create --resource cloud --service-account <sa-id> --description "<api-key-description>"
Your output should resemble:
It may take a couple of minutes for the API key to be ready.
Save the API key and secret. The secret is not retrievable later.
+---------+------------------------------------------------------------------+
| API Key | UZ7UB0BEMH7ZZL4T                                                 |
| Secret  | PcFU4EUD0bbSFaz3jnx2jhYmcuPVZShdowwhOkrYUhusFONqQtfU0tMtT8gkZSde |
+---------+------------------------------------------------------------------+
Log in to Confluent Cloud Console and navigate to Cloud API keys.
Click Add key, and on the Create key page, click Granular access and Next.
Click Create a new one to create a service account for your telemetry data.
Enter a name and description for the service account, for example, “telemetry-sa” and “telemetry service account”.
Click Next.
In the Create key page, enter a description for the service account’s API key, for example, “telemetry-sa api key”.
Click Download and continue to download a text file that contains your API key and secret.
Configure Health+
To configure Health+, you must configure the Telemetry Reporter plugin on every service that you want to include in Health+. The process for configuring Telemetry Reporter for ksqlDB and Connect is the same as for the broker. You must set telemetry.enabled to true and specify the API key telemetry.api.key and secret telemetry.api.secret for each component.
You have a number of options for configuring Health+.
Open Control Center in a browser. The default URL is http://localhost:9021/.
On the Home page, click your cluster.
In the navigation menu, click Health+ to open the overview page.
Click Get started to set up Health+ for your cluster.
In the Enable your cluster to communicate with Health+ section, enter your API key and secret.
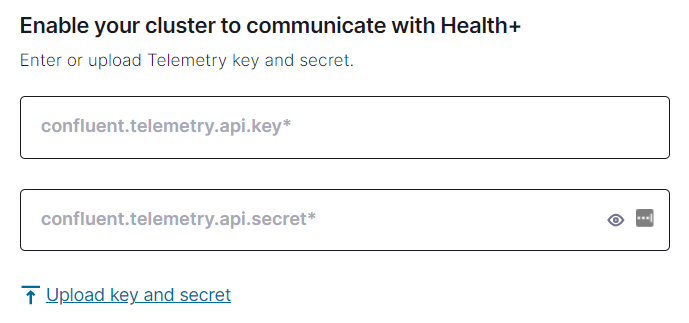
If you used the Confluent CLI to generate the key and secret, enter them in the confluent.telemetry.api.key and confluent.telemetry.api.secret text boxes.
If you used Confluent Cloud Console to generate the key and secret, click Upload key and secret and navigate to the file that you downloaded previously.
Click Continue.
(Optional) Add additional Confluent Platform services, such as ksqlDB or Connect.
For any Confluent Platform components other than Confluent Server, enable Telemetry Reporting by adding the following lines to the corresponding configuration file for the service. The default location for a component’s configuration file is
$CONFLUENT_HOME/etc/<component_name>/<component_name>.properties.metric.reporters=io.confluent.telemetry.reporter.TelemetryReporter confluent.telemetry.enabled=true confluent.telemetry.api.key=<api_key> confluent.telemetry.api.secret=<api_secret>
Note
Confluent Server doesn’t require the
metric.reporterssetting, but all other Confluent Platform components do require it.Save the file and restart the service to deploy the new configuration. Use the
confluent local services <component_name> stopandconfluent local services <component_name> startcommands to restart the service.
Navigate to the Health+ page in Confluent Cloud Console to verify that your data is being received. The tile for your Confluent Platform cluster should show Running.
Click Finish.
Click the tile for your cluster to see your telemetry data on the Monitor Using Health+ Dashboard for Confluent Platform.
If you use Ansible Playbooks for Confluent Platform to manage your Confluent Platform installation, add the following configuration overrides to all Confluent Platform roles and deploy the changes. This includes adding overrides for ksqlDB, Connect, and any other Confluent Platform roles for which you want to receive metrics in Health+.
telemetry_enabled: true
telemetry_api_key: <api_key>
telemetry_api_secret: <api_secret>
When you use Confluent for Kubernetes (CFK) to manage Confluent Platform, you can enable telemetry as described in the Confluent for Kubernetes documentation.
The Telemetry Reporter settings are in the CFK values file and are managed globally for all Confluent Platform components.
For Confluent Server, enable Telemetry Reporter by adding the following lines to the server configuration file. The default location for the server configuration file is $CONFLUENT_HOME/etc/kafka/server.properties. Replace <api_key> and <api_secret> with the key and secret you generated previously.
confluent.telemetry.enabled=true
confluent.telemetry.api.key=<api_key>
confluent.telemetry.api.secret=<api_secret>
Save the server configuration and restart Confluent Server.
If restarting Confluent Server is undesirable, you can add these configurations by using dynamic configuration with the kafka-config CLI. For more information, see Enable Telemetry without a restart.
For all Confluent Platform components other than Confluent Server, enable Telemetry Reporting by adding the following lines to the corresponding configuration file for the service. The default location for a component’s configuration file is $CONFLUENT_HOME/etc/<component_name>/<component_name>.properties.
metric.reporters=io.confluent.telemetry.reporter.TelemetryReporter
confluent.telemetry.enabled=true
confluent.telemetry.api.key=<api_key>
confluent.telemetry.api.secret=<api_secret>
Save the file and restart the service to deploy the new configuration. Use the confluent local services <component_name> stop and confluent local services <component_name> start commands to restart the service.
Note
Confluent Server doesn’t require the metric.reporters setting, but all other Confluent Platform components do require it.
Configuration with a proxy
Confluent Telemetry Reporter supports routing telemetry data through an authenticated HTTP proxy. In these environments, set the following parameters in the properties file of the broker to enable telemetry data to egress through a proxy.
confluent.telemetry.proxy.url=http://<proxy_server_ip>:<proxy_server_port>
confluent.telemetry.proxy.username=<proxy-username>
confluent.telemetry.proxy.password=<proxy-password>
What data is sent and how is it used?
When you have Confluent Telemetry Reporter enabled for a specific Confluent Platform component, Confluent collects metrics about the Confluent Platform component that include:
Runtime performance metrics
The Kafka version
The Confluent Platform version
A unique identifier that’s valid for the applicable Confluent Platform component
A unique identifier for the Kafka cluster
A unique identifier for your organization.
The data is sent using an encrypted connection to Confluent servers once per minute, by default. The resulting data is used by Confluent to offer Health+ to its customers and to maintain and improve Confluent Products and Services.
For this data to be sent, enable the transmission by setting configuration flags in every Confluent Platform component. You can stop sending data at any time by removing these configuration flags.
Telemetry Reporter requires an Amazon Root certificate to successful submit metrics to Confluent. The required CA Root Certificate is: C=US; O=Amazon; CN=Amazon RSA 2048 M02
You can find this certificate in the default TrustStore included with Java. If you made adjustments to the default TrustStore that remove the above certificate, you must add it back to use Telemetry Reporter.
The default TrustStore is typically a file named cacerts. It’s located in the lib/security directory within the Java installation directory.
Dynamic Configuration
Currently, dynamic configuration applies only to Kafka brokers.
To understand how to apply dynamic configs for your cluster, see Kafka Dynamic Configurations.
Enable Telemetry without a restart
If you’re using Confluent Server, you can enable the Telemetry Reporter without a restart by using the following command. Replace <api_key> and <api_secret> with the key and secret you generated previously.
$CONFLUENT_HOME/bin/kafka-configs --bootstrap-server localhost:9092 \
--alter --entity-type brokers --entity-default \
--add-config confluent.telemetry.enabled=true, \
confluent.telemetry.api.key=<api_key>, \
confluent.telemetry.api.secret=<api_secret>
Supported dynamic configuration properties
confluent.telemetry.enabledconfluent.telemetry.api.keyconfluent.telemetry.api.secretconfluent.telemetry.proxy.urlconfluent.telemetry.proxy.usernameconfluent.telemetry.proxy.password
Disable Telemetry
For all Confluent Platform components that have telemetry enabled, set the confluent.telemetry.enabled config to false and restart the component.
confluent.telemetry.enabled=false
If you’re using Confluent Server, you can disable Telemetry Reporter without a restart by using the following command. Replace <api_key> and <api_secret> with the key and secret you generated previously.
  $CONFLUENT_HOME/bin/kafka-configs --bootstrap-server localhost:9092 \
  --alter --entity-type brokers --entity-default \
  --add-config confluent.telemetry.enabled=false, \
  confluent.telemetry.api.key=<api_key>, \
  confluent.telemetry.api.secret=<api_secret>