Best Practices for Kafka Production Deployments in Confluent Platform
After you have deployed your Kafka cluster in production, there are some tools and best practices to keep your cluster running in good shape. This section talks about configuring settings dynamically, changing log levels, partition reassignment and deleting topics.
Logging
Apache Kafka® emits a number of logs. The location the logs are written depends on the packaging format. For example, kafka_logs_dir will be in /var/log/kafka in a RPM/Debian installation and $base_dir/logs for a ZIP/TAR installation. The default logging level is INFO. It provides a moderate amount of information, but is designed to be light so that your logs do not grow too big.
When debugging problems, particularly problems with replicas falling out of ISR, it can be helpful to bump up the logging level to DEBUG.
You can modify the log4j.properties file and restart your nodes — but that leads to unnecessary downtime.
Controller
Kafka elects one broker in the cluster to be the controller. The controller is responsible for cluster management and handles events like broker failures, leader election, topic deletion and more.
Since the controller is embedded in the broker, the logs from the controller are separated from the server logs in logs/controller.log. Any ERROR, FATAL or WARN in this log indicates an important event that should be looked at by the administrator.
State Change Log
The controller manages state for all resources in the Kafka cluster. This includes topics, partitions, brokers and replicas. As part of state management, when the state of any resource is changed by the controller, it logs the action to a special state change log stored under logs/state-change.log. This is useful for troubleshooting purposes. For example, if some partition is offline for a while, this log can provide useful information as to whether the partition is offline due to a failed leader election operation.
Note that the default log level for this log is TRACE.
Request logging
Kafka has the facility to log every request served by the broker. This includes not only produce and consume requests, but also requests sent by the controller to brokers and metadata requests.
The following is the default setting:
log4j.logger.kafka.request.logger=WARN, requestAppender
To enable this log at the
DEBUGlevel, set it to:log4j.logger.kafka.request.logger=DEBUG, requestAppender
If this log is enabled at the
DEBUGlevel, it contains latency information for every request along with the latency breakdown by component, so you can see where the bottleneck is.To enable this log at the
TRACElevel, set it to:log4j.logger.kafka.request.logger=TRACE, requestAppender
If this log is enabled at
TRACE, it further logs the contents of the request than theDEBUGlevel.We do not recommend you set this log to
TRACEfor a long period of time as the amount of logging can affect the performance of the cluster.
For more details on logging, see Configure Confluent Platform Logging.
Admin operations
This section covers the various admin tools that you can use to administer a Kafka cluster in production. There are still a number of useful operations that are not automated and have to be triggered using one of the tools that ship with Kafka under bin/
Adding topics
You have the option of either adding topics manually or having them be created automatically when data is first published to a non-existent topic. If topics are auto-created then you may want to tune the default topic configurations used for auto-created topics.
Topics are added and modified using the topic tool:
bin/kafka-topics --bootstrap-server localhost:9092 --create --topic my_topic_name \
 --partitions 20 --replication-factor 3 --config x=y
The replication factor controls how many servers will replicate each message that is written. If you have a replication factor of 3, then up to 2 servers can fail before you will lose access to your data. We recommend you use a replication factor of 2 or 3 so that you can transparently restart machines without interrupting data consumption.
The partition count controls how many shards contain a log for the topic. There are several impacts of the partition count. First, each partition must fit entirely on a single server. For example, if you have a topic with 20 partitions the full data set (and read and write load) will be handled by no more than 20 servers (not counting replicas). Finally the partition count impacts the maximum parallelism of your consumers.
The configurations added on the command line override the default settings the server has for things like the length of time data should be retained. The complete set of per-topic configurations is documented here.
Modifying topics
You can change the configuration or partitioning of a topic using the same topic tool.
To add partitions you can do
bin/kafka-topics --bootstrap-server localhost:9092 --alter --topic my_topic_name \
 --partitions 40
Be aware that one use case for partitions is to semantically partition data, and adding partitions doesn’t change the partitioning of existing data so this may disturb consumers if they rely on that partition. That is if data is partitioned by hash(key) % number_of_partitions then this partitioning will potentially be shuffled by adding partitions but Kafka will not attempt to automatically redistribute data in any way.
To add configs:
bin/kafka-configs --bootstrap-server localhost:9092 --alter --entity-type topics --entity-name my_topic_name --add-config x=y
To remove a config:
bin/kafka-configs --bootstrap-server localhost:9092 --alter --entity-type topics --entity-name my_topic_name \
 --delete-config x
Note that Kafka does not currently support reducing the number of partitions for a topic.
Deleting topics
You can also delete a topic using the topic tool:
bin/kafka-topics --bootstrap-server localhost:9092 --delete --topic my_topic_name
Graceful shutdown
The Kafka cluster will automatically detect any broker shutdown or failure and elect new leaders for the partitions on that machine. This will occur whether a server fails or it is brought down intentionally for maintenance or configuration changes. For the later cases Kafka supports a more graceful mechanism for stopping a server than just killing it. When a server is stopped gracefully it has two optimizations it will take advantage of:
It will sync all its logs to disk to avoid needing to do any log recovery when it restarts (i.e. validating the checksum for all messages in the tail of the log). Log recovery takes time so this speeds up intentional restarts.
It will migrate any partitions the server is the leader for to other replicas prior to shutting down. This will make the leadership transfer faster and minimize the time each partition is unavailable to a few milliseconds.
Syncing the logs will happen automatically happen whenever the server is stopped other than by a hard kill, but the controlled leadership migration requires using a special setting: controlled.shutdown.enable=true
Note that controlled shutdown will only succeed if all the partitions hosted on the broker have replicas (i.e. the replication factor is greater than 1 and at least one of these replicas is alive). This is generally what you want since shutting down the last replica would make that topic partition unavailable.
Rolling restart
If you need to do software upgrades, broker configuration updates, or cluster maintenance, then you will need to restart all the brokers in your Kafka cluster. To do this, you can do a rolling restart by restarting one broker at a time. Restarting the brokers one at a time provides high availability by avoiding downtime for end users.
Some considerations to avoid downtime include:
Use Confluent Control Center to monitor broker status during the rolling restart.
Because one replica is unavailable while a broker is restarting, clients will not experience downtime if the number of remaining in sync replicas is greater than the configured
min.insync.replicas.Run brokers with
controlled.shutdown.enable=trueto migrate topic partition leadership before the broker is stopped.The active controller should be the last broker you restart. This is to ensure that the active controller is not moved on each broker restart, which would slow down the restart.
Before starting a rolling restart:
Verify your cluster is healthy and there are no under replicated partitions. In Control Center, navigate to Overview of the cluster, and observe the Under replicated partitions value. If there are under replicated partitions, investigate why before doing a rolling restart.
Identify which Kafka broker in the cluster is the active controller. The active controller will report
1for the following metrickafka.controller:type=KafkaController,name=ActiveControllerCountand the remaining brokers will report0.
Use the following workflow for rolling restart:
Connect to one broker, being sure to leave the active controller for last, and stop the broker process gracefully. Do not send a
kill -9command. Wait until the broker has completely shutdown.Tip
These instructions are based on the assumption that you are installing Confluent Platform by using ZIP or TAR archives. For more information, see Install Confluent Platform On-Premises.
bin/kafka-server-stop
If you are performing a software upgrade or making any system configuration changes, follow those steps on this broker. (If you are just changing broker properties, you could optionally do this before you stop the broker)
Start the broker back up, passing in the broker properties file.
bin/kafka-server-start etc/kafka/broker.properties
Wait until that broker completely restarts and is caught up before proceeding to restart the next broker in your cluster. Waiting is important to ensure that leader failover happens as cleanly as possible. To know when the broker is caught up, in Control Center, navigate to Overview of the cluster, and observe the Under replicated partitions value. During broker restart, this number increases because data will not be replicated to topic partitions that reside on the restarting broker.
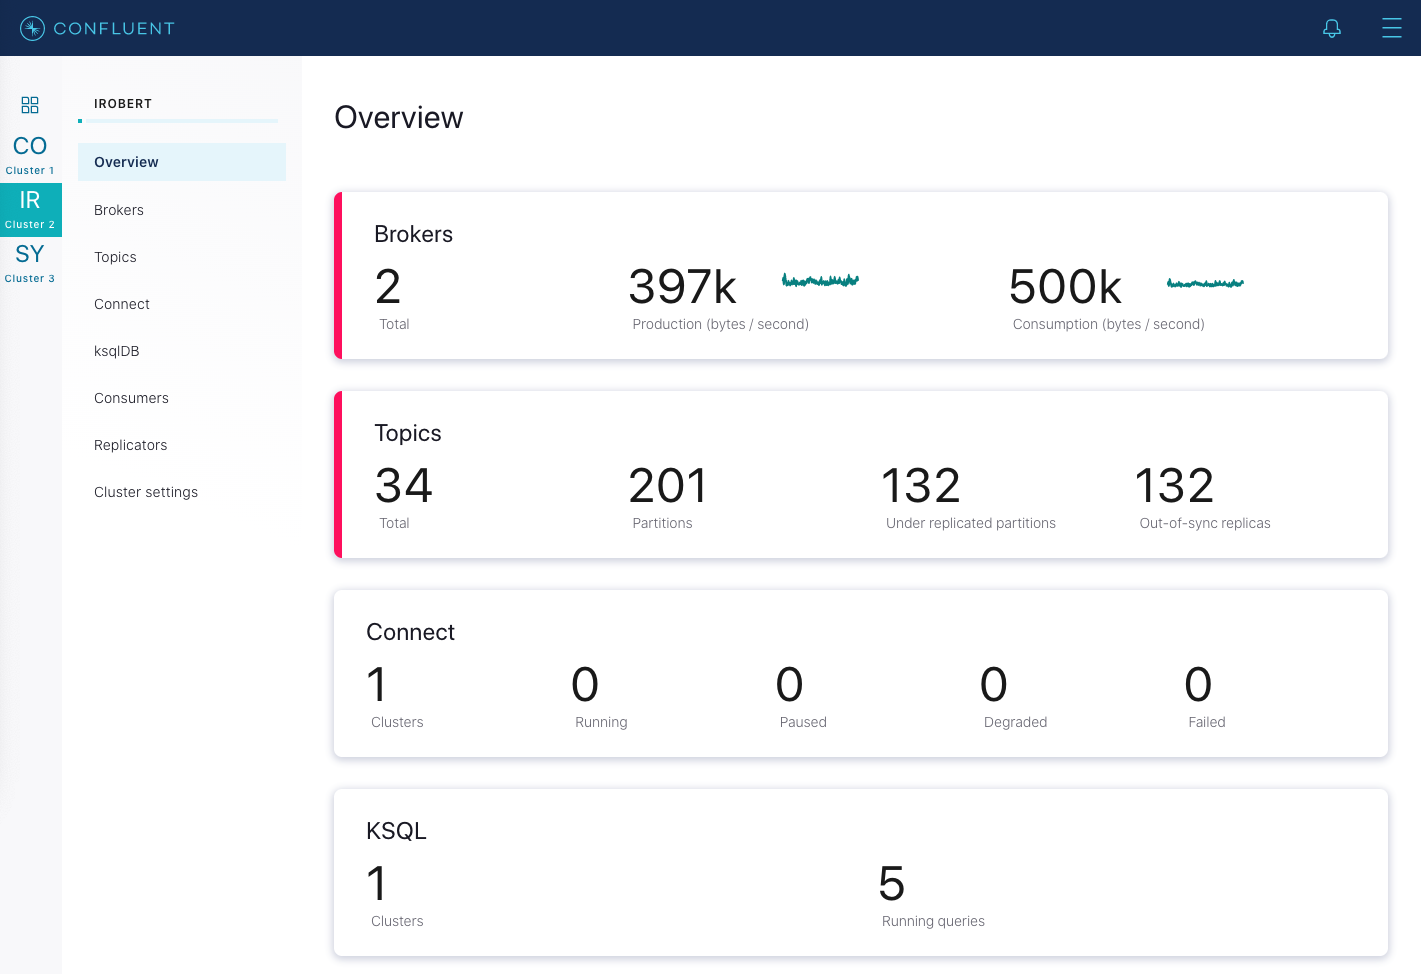
After a broker restarts and is caught up, this number goes back to its original value before restart, which should be
0in a healthy cluster.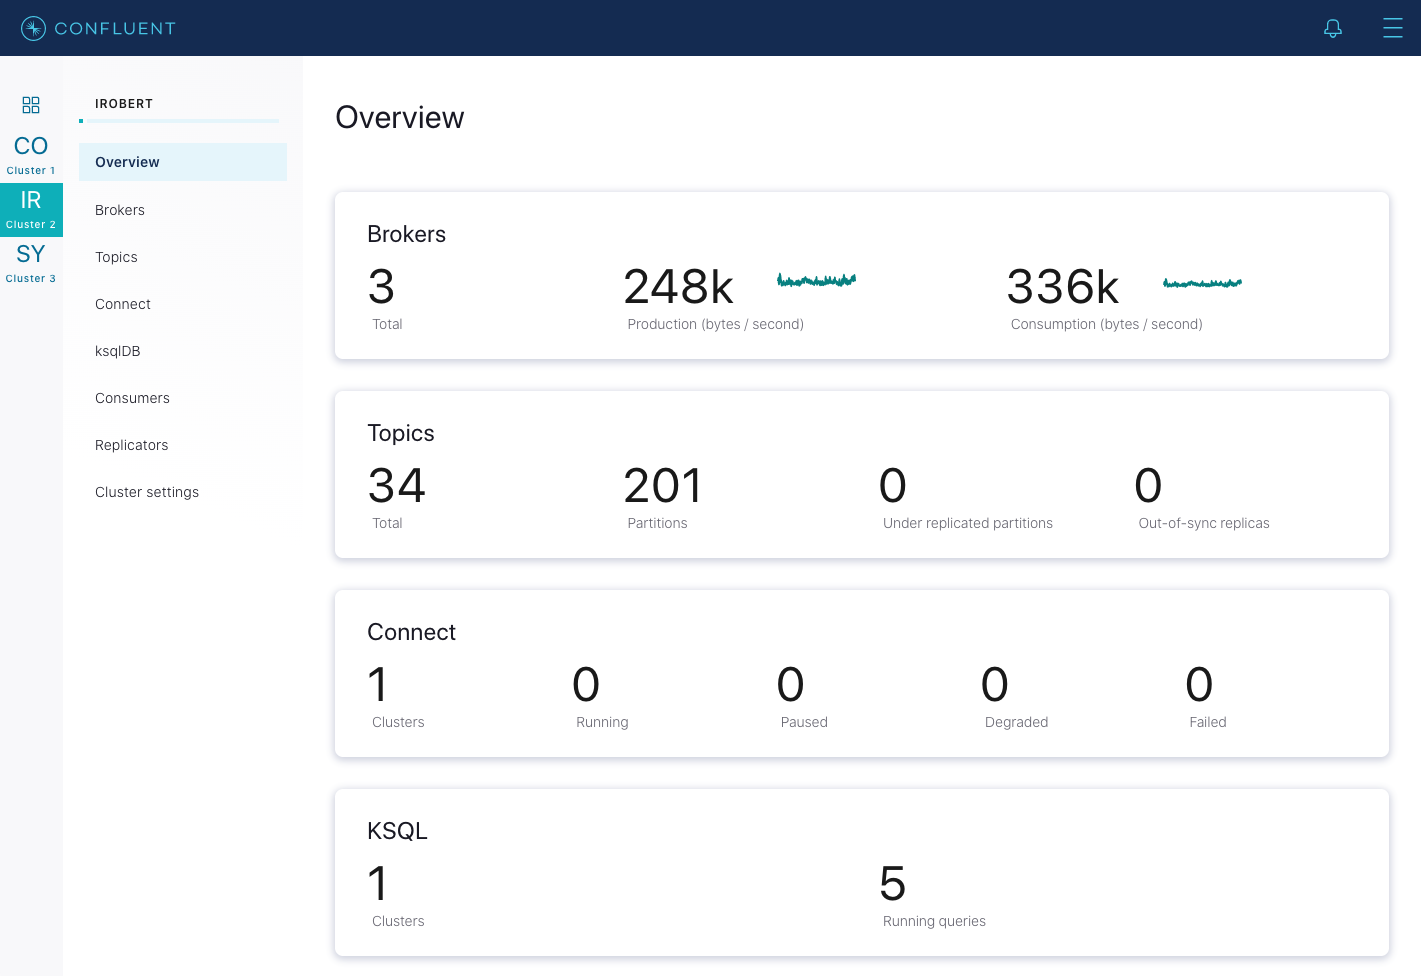
Repeat the above steps on each broker until you have restarted all brokers but the active controller. Now you can restart the active controller.
Scaling the cluster (adding a node to a Kafka cluster)
Tip
To learn more about adding adding nodes and rebalancing, see Manage Self-Balancing Kafka Clusters in Confluent Platform, Quick Start for Auto Data Balancing in Confluent Platform, Configure a Multi-Node Confluent Platform Environment with Docker, and Tutorial: Set Up a Multi-Broker Kafka Cluster.
Adding servers to a Kafka cluster is easy, just assign them a unique broker ID and start up Kafka on your new servers. However these new servers will not automatically be assigned any data partitions, so unless partitions are moved to them they won’t be doing any work until new topics are created. So usually when you add machines to your cluster you will want to migrate some existing data to these machines. Other common reasons for migrating data are decommissioning of brokers and rebalancing data across the cluster (when it becomes unbalanced).
Starting with Confluent Platform 6.0.0, you can use Manage Self-Balancing Kafka Clusters in Confluent Platform to automatically manage the distribution of data across partitions. Self-Balancing Clusters will auto-initiate a rebalance if needed based on a number of metrics and factors, including when Kafka nodes (brokers) are added or removed.
In Confluent Platform versions previous to 6.x, the process of migrating data must manually initiated but fully automated. Under the covers, when Kafka moves a partition, it will add a new replica on the destination machine as a follower of the partition it is migrating. The new replica is allowed to replicate and when it is fully caught up, it will be marked as in-sync. Then one of the existing replicas on the original server will be deleted, completing the move.
Confluent Platform includes the confluent-rebalancer tool and the open source Kafka kafka-reassign-partitions tool. The Confluent Rebalancer has the following advantages:
Minimizes data movement
Balances data at both cluster and topic level (instead of just topic level)
Balances disk usage across brokers (in addition to balancing the number of leaders and replicas across racks and brokers)
Supports decommissioning of broker(s)
Supports moving partitions away from dead brokers
The confluent-rebalancer is described in a separate page.
The open source partition reassignment tool can run in 3 mutually exclusive modes -
--generate: In this mode, given a list of topics and a list of brokers, the tool generates a candidate reassignment to move all partitions of the specified topics to the new brokers. This option merely provides a convenient way to generate a partition reassignment plan given a list of topics and target brokers.--execute: In this mode, the tool kicks off the reassignment of partitions based on the user provided reassignment plan. (using the--reassignment-json-fileoption). This can either be a custom reassignment plan hand crafted by the admin or provided by using the –generate option--verify: In this mode, the tool verifies the status of the reassignment for all partitions listed during the last--execute. The status can be either of successfully completed, failed or in progress
The partition reassignment tool does not have the ability to automatically generate a reassignment plan for decommissioning brokers yet. As such, the admin has to come up with a reassignment plan to move the replica for all partitions hosted on the broker to be decommissioned, to the rest of the brokers. This can be relatively tedious as the reassignment needs to ensure that all the replicas are not moved from the decommissioned broker to only one other broker. As stated previously, the confluent-rebalancer has built-in support for this.
Changing the replication factor
You can increase or decrease the replication factor with the kafka-reassign-partitions tool. To do so, you create a reassignment plan in a JSON file that specifies the increased or decreased replicas. Then use the file with the kafka-reassign-partitions tool --execute option to increase the replication factor of the partitions specified in the file.
Save the current state
Check the current state of a topic using the kafka-topics tool:
bin/kafka-topics --bootstrap-server localhost:9092 --topic foo --describe
You should get output similar to the following. Note this example has been shortened for brevity:
Topic:foo    PartitionCount:1        ReplicationFactor:1     Configs: <..>

Topic: foo   Partition: 5    Leader: 5       Replicas: 5 Isr: 5
This output shows that the partition’s only replica exists on broker 5.
Save the current state as a JSON file named original-state.json to use as the --reassignment-json-file option during a rollback. The format should be like the following:
{"version":1,
 "partitions":[
    {"topic":"foo",
     "partition":0,
     "replicas":[5]
    }
  ]
}
Increase the replication factor
The following example increases the replication factor of partition 0 of topic foo from 1 to 3. As part of increasing the replication factor, the example adds more replicas on brokers 6 and 7.
The first step is to create the custom reassignment plan in a JSON file named increase-replication-factor.json.
cat increase-replication-factor.json
{"version":1,
 "partitions":[
    {"topic":"foo",
     "partition":0,
     "replicas":[5,6,7]
    }
  ]
}
Then, use the JSON file with the --execute option to start the reassignment process:
bin/kafka-reassign-partitions --bootstrap-server localhost:9092 --reassignment-json-file increase-replication-factor.json --execute
This generates output similar to the following:
Current partition replica assignment


Successfully started reassignment of partitions
{"version":1,
 "partitions":[
    {"topic":"foo",
     "partition":0,
     "replicas":[5,6,7]
    }
  ]
}
The --verify option can be used with the tool to check the status of the partition reassignment. Use increase-replication-factor.json that you used earlier with the --execute with the --verify option
bin/kafka-reassign-partitions --bootstrap-server localhost:9092 --reassignment-json-file increase-replication-factor.json --verify
This generates output similar to the following:
Reassignment of partition [foo,0] completed successfully
You can also verify the increase in replication factor with the kafka-topics tool:
bin/kafka-topics --bootstrap-server localhost:9092 --topic foo --describe
This generates output similar to the following. Note this example has been shortened for brevity:
Topic:foo    PartitionCount:1        ReplicationFactor:3     Configs: <..>
Topic: foo   Partition: 0    Leader: 5       Replicas: 5,6,7 Isr: 5,6,7
Decrease the replication factor
If you need to decrease the replication factor, you can roll back using the kafka-reassign-partitions tool and the execute option with the original-state.json you saved previously:
bin/kafka-reassign-partitions --bootstrap-server localhost:9092 --reassignment-json-file original-state.json --execute
This generates output similar to the following:
Current partition replica assignment


Successfully started reassignment of partitions
{"version":1,
 "partitions":[
    {"topic":"foo",
     "partition":0,
     "replicas":[5]
    }
  ]
}
Limiting bandwidth usage during data migration
Kafka lets you apply a throttle to replication traffic, setting an upper bound on the bandwidth used to move replicas from machine to machine. This is useful when rebalancing a cluster, bootstrapping a new broker or adding or removing brokers, as it limits the impact these data-intensive operations will have on users.
There are three interfaces that can be used to engage a throttle. The simplest, and safest, is to apply a throttle when invoking confluent-rebalancer or kafka-reassign-partitions, but kafka-configs can also be used to view and alter the throttle values directly.
So for example, if you were to execute a rebalance, with the below command, it would move partitions at no more than 50 MBps.
bin/kafka-reassign-partitions --bootstrap-server myhost:9092 --execute
--reassignment-json-file bigger-cluster.json —throttle 50000000
When you execute this script you will see the throttle engage:
…
The throttle limit was set to 50000000 B/s
Successfully started reassignment of partitions.
Should you wish to alter the throttle, during a rebalance, say to increase the throughput so it completes quicker, you can do this by re-running the execute command passing the same reassignment-json-file:
bin/kafka-reassign-partitions --bootstrap-server localhost:9092  --execute
--reassignment-json-file bigger-cluster.json --throttle 700000000
There is an existing assignment running.
The throttle limit was set to 700000000 B/s
After the rebalance completes the administrator can check the status of the rebalance using the --verify option. If the rebalance has completed, and --verify is run, the throttle will be removed. It is important that administrators remove the throttle in a timely manner after rebalancing completes by running the command with the --verify option. Failure to do so could cause regular replication traffic to be throttled.
When the --verify option is executed, and the reassignment has completed, the script will confirm that the throttle was removed:
bin/kafka-reassign-partitions --bootstrap-server localhost:9092  --verify
--reassignment-json-file bigger-cluster.json
Status of partition reassignment:
Reassignment of partition [my-topic,1] completed successfully
Reassignment of partition [mytopic,0] completed successfully
Throttle was removed.
The administrator can also validate the assigned configs using the kafka-configs. There are two pairs of throttle configuration used to manage the throttling process. The throttle value itself. This is configured, at a broker level, using the dynamic properties:
leader.replication.throttled.rate
follower.replication.throttled.rate
There is also an enumerated set of throttled replicas:
leader.replication.throttled.replicas
follower.replication.throttled.replicas
Which are configured per topic. All four config values are automatically assigned by kafka-reassign-partitions (discussed below).
The throttle mechanism works by measuring the received and transmitted rates, for partitions in the replication.throttled.replicas lists, on each broker. These rates are compared to the replication.throttled.rate config to determine if a throttle should be applied. The rate of throttled replication (used by the throttle mechanism) is recorded in the below JMX metrics, so they can be externally monitored.
MBean:kafka.server:type=LeaderReplication,name=byte-rate
MBean:kafka.server:type=FollowerReplication,name=byte-rate
To view the throttle limit configuration:
bin/kafka-configs --describe --bootstrap-server localhost:9092 --entity-type brokers
Configs for brokers '2' are leader.replication.throttled.rate=1000000,follower.replication.throttled.rate=1000000
Configs for brokers '1' are leader.replication.throttled.rate=1000000,follower.replication.throttled.rate=1000000
This shows the throttle applied to both leader and follower side of the replication protocol. By default both sides are assigned the same throttled throughput value.
To view the list of throttled replicas:
bin/kafka-configs --describe --bootstrap-server localhost:9092 --entity-type topics
Configs for topic ‘my-topic' are leader.replication.throttled.replicas=1:102,0:101,follower.replication.throttled.replicas=1:101,0:102
Here we see the leader throttle is applied to partition 1 on broker 102 and partition 0 on broker 101. Likewise the follower throttle is applied to partition 1 on broker 101 and partition 0 on broker 102.
By default kafka-reassign-partitions will apply the leader throttle to all replicas that exist before the rebalance, any one of which might be leader. It will apply the follower throttle to all move destinations. So if there is a partition with replicas on brokers 101,102, being reassigned to 102,103, a leader throttle, for that partition, would be applied to 101,102 (possible leaders during rebalance) and a follower throttle would be applied to 103 only (the move destination).
If required, you can also use the --alter switch on kafka-configs to alter the throttle configurations manually.
Some care should be taken when using throttled replication. In particular:
Throttle Removal:
The throttle should be removed in a timely manner after reassignment completes (by running confluent-rebalancer --finish or kafka-reassign-partitions -—verify).
Ensuring Progress:
If the throttle is set too low, in comparison to the incoming write rate, it is possible for replication to not make progress. This occurs when:
max(BytesInPerSec) > throttle
Where BytesInPerSec is the metric that monitors the write throughput of producers into each broker.
The administrator can monitor whether replication is making progress, during the rebalance, using the metric:
kafka.server:type=FetcherLagMetrics,name=ConsumerLag,clientId=([-.\w]+),topic=([-.\w]+),partition=([0-9]+)
The lag should constantly decrease during replication. If the metric does not decrease the administrator should increase the throttle throughput as described above.
Avoiding long delays during replication:
The throttled throughput should be large enough that replicas cannot be starved for extended periods. A good, conservative rule of thumb is to keep throttle above #brokers MB/s where #brokers is the number of brokers in your cluster.
Administrators wishing to use lower throttle values can tune the response size used for replication based on the relation:
Worst-Case-Delay = replica.fetch.response.max.bytes x #brokers / throttle
Here, the admin should tune the throttle and/or replica.fetch.response.max.bytes appropriately to ensure the delay is never larger than replica.lag.time.max.ms (as it is possible for some partitions, particularly smaller ones, to enter the ISR before the rebalance completes) or the outer throttle window: (replication.quota.window.size.seconds x replication.quota.window.num) or the connection timeout replica.socket.timeout.ms.
As the default for replica.fetch.response.max.bytes is 10MB and the delay should be less than 10s (replica.lag.time.max.ms), this leads to the rule of thumb that throttles should never be less than #brokers MBps .
To better understand the relation let’s consider an example. Say we have a 5 node cluster, with default settings. We set a throttle of 10 MBps, cluster-wide, and add a new broker. The bootstrapping broker would replicate from the other 5 brokers with requests of size 10MB (default replica.fetch.response.max.bytes). The worst case payload, arriving at the same time on the bootstrapping broker, is 50MB. In this case the follower throttle, on the bootstrapping broker, would delay subsequent replication requests for (50MB / 10 MBps) = 5s, which is acceptable. However if we set the throttle to 1 MBps the worst-case delay would be 50s which is not acceptable.
Balancing replicas across racks
The rack awareness feature spreads replicas of the same partition across different racks. This extends the guarantees Kafka provides for broker-failure to cover rack-failure, limiting the risk of data loss should all the brokers on a rack fail at once. The feature can also be applied to other broker groupings such as availability zones in EC2.
You can specify that a broker belongs to a particular rack by adding a property to the broker config:
broker.rack=my-rack-id
When a topic is created or modified, or when replicas are redistributed, the rack constraint will be honored, ensuring replicas span as many racks as they can. A partition will span the number of different racks, which is a minimum of #racks and replication-factor.
The algorithm used to assign replicas to brokers ensures that the number of leaders per broker will be constant, regardless of how brokers are distributed across racks. This ensures balanced throughput.
However if racks are assigned different numbers of brokers, the assignment of replicas will not be even. Racks with fewer brokers will get more replicas, meaning they will use more storage and put more resources into replication. Hence it is sensible to configure an equal number of brokers per rack.
Caution
Currently, rack awareness cannot be enabled during upgrades. You need to enable rack awareness before or after the Confluent Platform version upgrade is complete.
Tip
There is no impact to renaming a broker.rack if there are no operations in progress when the rack is renamed during start up. If you have multiple brokers per rack, make sure that no topic configuration operations are being performed until the rack is renamed (for example, no new topics added or modifications).
Enforcing client quotas
Starting in 0.9, the Kafka cluster has the ability to enforce quotas on produce and fetch requests. Quotas are basically byte-rate thresholds defined per client-id. A client-id logically identifies an application making a request. Hence a single client-id can span multiple producer and consumer instances and the quota will apply for all of them as a single entity i.e. if client-id=”test-client” has a produce quota of 10 MBps, this is shared across all instances with that same ID.
For more information about quotas, see Kafka Quotas.
Quotas protect brokers from producers and consumers who produce/consume very high volumes of data and thus monopolize broker resources and cause network saturation. This is especially important in large multi-tenant clusters where a small set of badly behaved clients can degrade user experience for the well behaved ones. In fact, when running Kafka as a service quotas make it possible to enforce API limits according to an agreed upon contract.
When a broker detects quota violation, it does not return an error. Rather it attempts to slow down a client exceeding its quota. The broker computes the amount of delay needed to bring the quota-violating client under its quota and delays the response for that time. This approach keeps the quota violation transparent to clients (outside of client side metrics). This also keeps them from having to implement any special backoff and retry behavior which ensures quotas are enforced regardless of the client implementation. JMX metrics on the client and brokers can reveal when clients are throttled.
Client byte rate is measured over multiple small windows (for example, 30 windows of one second each) in order to detect and correct quota violations quickly. Typically, having large measurement windows (for example, 10 windows of 30 seconds each) leads to large bursts of traffic followed by long delays.
By default, each client-id receives an unlimited quota. You can set default or/and custom quotas for each user, each client-id, a user group or a client-id group.
Warning
Clients configured with very low throughput quotas may be throttled for large periods of time and may exceed request timeouts if the produce request is too large.
An example command to configure custom quota for (user=user1, client-id=clientA):
bin/kafka-configs.sh  --bootstrap-server localhost:9092 --alter \
  --add-config 'producer_byte_rate=1024,consumer_byte_rate=2048,request_percentage=200' \
  --entity-type users --entity-name user1 --entity-type clients \
  --entity-name clientA
An example command to configure custom quota for (user=user1):
bin/kafka-configs.sh  --bootstrap-server localhost:9092 --alter \
  --add-config 'producer_byte_rate=1024,consumer_byte_rate=2048,request_percentage=200' \
  --entity-type users --entity-name user1
An example command to configure custom quota for (client-id=clientA):
bin/kafka-configs.sh  --bootstrap-server localhost:9092 --alter \
  --add-config 'producer_byte_rate=1024,consumer_byte_rate=2048,request_percentage=200' \
  --entity-type clients --entity-name clientA
It is possible to set default quotas for each (user, client-id), user or client-id group by specifying the --entity-default option instead of --entity-name.
An example command to configure default client-id quota for (user=user1):
bin/kafka-configs.sh  --bootstrap-server localhost:9092 --alter \
  --add-config 'producer_byte_rate=1024,consumer_byte_rate=2048,request_percentage=200' \
  --entity-type users --entity-name user1 --entity-type clients \
  --entity-default
An example command to configure default quota for user:
bin/kafka-configs.sh  --bootstrap-server localhost:9092 --alter \
  --add-config 'producer_byte_rate=1024,consumer_byte_rate=2048,request_percentage=200' \
  --entity-type users --entity-default
An example command to configure default quota for client-id:
bin/kafka-configs.sh  --bootstrap-server localhost:9092 --alter \
  --add-config 'producer_byte_rate=1024,consumer_byte_rate=2048,request_percentage=200' \
  --entity-type clients --entity-default
An example command to describe the quota for a given (user, client-id):
bin/kafka-configs.sh  --bootstrap-server localhost:9092 --describe \
  --entity-type users --entity-name user1 --entity-type clients --entity-name clientA

Configs for user-principal 'user1', client-id 'clientA' are producer_byte_rate=1024,consumer_byte_rate=2048,request_percentage=200
An example command to describe quota for a given user:
bin/kafka-configs.sh  --bootstrap-server localhost:9092 --describe \
  --entity-type users --entity-name user1

Configs for user-principal 'user1' are producer_byte_rate=1024,consumer_byte_rate=2048,request_percentage=200
An example command to describe quota for a given client-id:
bin/kafka-configs.sh  --bootstrap-server localhost:9092 --describe \
  --entity-type clients --entity-name clientA

Configs for client-id 'clientA' are producer_byte_rate=1024,consumer_byte_rate=2048,request_percentage=200
If entity name is not specified, all entities of the specified type are described. For example, to describe all users:
bin/kafka-configs.sh  --bootstrap-server localhost:9092 --describe \
  --entity-type users

Configs for user-principal 'user1' are producer_byte_rate=1024,consumer_byte_rate=2048,request_percentage=200
Configs for default user-principal are producer_byte_rate=1024,consumer_byte_rate=2048,request_percentage=200
Similarly, an example to describe all users and clients:
bin/kafka-configs.sh  --bootstrap-server localhost:9092 --describe \
  --entity-type users --entity-type clients

Configs for user-principal 'user1', default client-id are producer_byte_rate=1024,consumer_byte_rate=2048,request_percentage=200
Configs for user-principal 'user1', client-id 'clientA' are producer_byte_rate=1024,consumer_byte_rate=2048,request_percentage=200
Performance tips
Picking the number of partitions for a topic
Tip
To learn about benchmark testing and results for Kafka performance on the latest hardware in the cloud, see Apache Kafka Performance, Latency, Throughput, and Test
There isn’t really a right answer, we expose this as an option because it is a tradeoff. The simple answer is that the partition count determines the maximum consumer parallelism and so you should set a partition count based on the maximum consumer parallelism you would expect to need (that is, over-provision). Clusters with up to 10k total partitions are quite workable. Beyond that we don’t aggressively test (it should work, but we can’t guarantee it).
Here are more complete tradeoffs to consider:
A partition is basically a directory of log files.
Each partition must fit entirely on one machine. So if you have only one partition in your topic you cannot scale your write rate or retention beyond the capability of a single machine. If you have 1000 partitions you could potentially use 1000 machines.
Each partition is totally ordered. If you want a total order over all writes you probably want to have just one partition.
Each partition is not consumed by more than one consumer thread/process in each consumer group. This allows to have each process consume in a single threaded fashion to guarantee ordering to the consumer within the partition (if we split up a partition of ordered messages and handed them out to multiple consumers even though the messages were stored in order they would be processed out of order at times).
Many partitions can be consumed by a single process, though. So you can have 1000 partitions all consumed by a single process. Another way to say the above is that the partition count is a bound on the maximum consumer parallelism.
More partitions will mean more files and hence can lead to smaller writes if you don’t have enough memory to properly buffer the writes and coalesce them into larger writes
More partitions means longer leader fail-over time. Each partition can be handled quickly (milliseconds) but with thousands of partitions this can add up.
When we checkpoint the consumer position we store one offset per partition so the more partitions the more expensive the position checkpoint is.
It is possible to later expand the number of partitions BUT when we do so we do not attempt to reorganize the data in the topic. So if you are depending on key-based semantic partitioning in your processing you will have to manually copy data from the old low partition topic to a new higher partition topic if you later need to expand.
Tuning virtual memory
Linux virtual memory automatically adjusts to accommodate the workload of a system. Because Kafka relies heavily on the system page cache, when a virtual memory system swaps to disk it is possible that insufficient memory is allocated to the page cache. Generally speaking, swapping has a noticeable negative impact on all aspects of Kafka performance, and should be avoided.
If you do not configure swap space, then you can avoid altogether swapping-related performance issues. However, swap provides an important safety mechanism in case of a catastrophic system issue. For example, swap prevents the OS from abruptly killing a process when faced with an out-of-memory condition.
To avoid swap performance issues and simultaneously have the assurance of a safety net, set the vm.swappiness parameter to a very low value, such as 1. The vm.swappiness value is a percentage of how likely the virtual memory subsystem is to use swap space rather than drop pages from the page cache. The higher the value of the parameter, the more aggressively the kernel will swap. Reducing the page cache size is preferable to adjusting swap. However, it is not recommended to use a value of 0, because it would never allow a swap under any circumstances, thus forfeiting the safety net afforded when using this parameter.
Lagging replicas
ISR is the set of replicas that are fully sync-ed up with the leader. In other words, every replica in the ISR has written all committed messages to its local log. In steady state, ISR should always include all replicas of the partition. Occasionally, some replicas fall out of the insync replica list. This could either be due to failed replicas or slow replicas.
A replica can be dropped out of the ISR if it diverges from the leader beyond a certain threshold. This is controlled by the following parameter:
replica.lag.time.max.msThis is typically set to a value that reliably detects the failure of a broker. You can set this value appropriately by observing the value of the replica’s minimum fetch rate that measures the rate of fetching messages from the leader (
kafka.server:type=ReplicaFetcherManager,name=MinFetchRate,clientId=Replica). If that rate isn, set the value for this parameter to larger than1/n * 1000.
Increasing consumer throughput
First, try to figure out if the consumer is just slow or has stopped. To do so, you can monitor the maximum lag metric kafka.consumer:type=ConsumerFetcherManager,name=MaxLag,clientId=([-.\w]+) that indicates the number of messages the consumer lags behind the producer. Another metric to monitor is the minimum fetch rate kafka.consumer:type=ConsumerFetcherManager,name=MinFetchRate,clientId=([-.\w]+) of the consumer. If the MinFetchRate of the consumer drops to almost 0, the consumer is likely to have stopped. If the MinFetchRate is non-zero and relatively constant, but the consumer lag is increasing, it indicates that the consumer is slower than the producer. If so, the typical solution is to increase the degree of parallelism in the consumer. This may require increasing the number of partitions of a topic.
Handling large message sizes
We strongly recommend that you adhere to the default maximum size of 1 MB for messages. When it is absolutely necessary to increase the maximum message size, the following are a few of the many implications you should consider. Also consider alternative options such as using compression and/or splitting up messages.
- Heap fragmentation
Consistently large messages likely cause heap fragmentation on the broker side, requiring significant JVM tuning to maintain consistent performance.
- Dirty page cache
Accessing messages that are no longer available in the page cache is slow. With larger messages, fewer messages can fit in the page cache, causing degraded performance.
- Kafka client buffer sizes
Default buffer sizes on the client side are tuned for small messages (<1MB). You will have to tune client side buffers on both the producer and consumer to properly handle the messages. See max.message.bytes.
To configure Kafka to handle larger messages, set the following configuration parameters at the level you need, in Producer, Consumer and Topic. If all topics needs this configuration, set it in the Broker configuration, but this is not recommended for the reasons listed above.
Scope | Config Parameter | Notes |
|---|---|---|
Topic |
| Recommended to set the maximum message size at the topic level. |
Broker |
| Setting the maximum message size at the broker level is not recommended. |
Producer |
| Required for the producer level change of the maximum message size. |
| Use these parameters for performance tuning. | |
Consumer |
| Use these to set the maximum message size at the consumer level. |
For example, if you want to be able to handle 2 MB messages, you need to configure as below.
Topic configuration:
max.message.bytes=2097152
Producer configuration:
max.request.size=2097152

# This will allow 5 messages per batch (1 batch = 1 partition) if all messages is 2MB.
batch.size=10485760

# This will allow 10 batches to be held in memory at any one time if all messages is 2MB
buffer.memory=104857600
Consumer configuration:
# This will allow consuming maximum 5 records per partition if all messages is 2MB.
max.partition.fetch.bytes=10485760

# This will allow consuming 10 partitions if all messages is 2MB.
fetch.max.bytes=104857600.
In addition to configuring Kafka to handle larger messages, consider compressing the messages at the producer level to reduce the size received by the brokers to avoid some of the reasons listed above.
Software updates
Software updates can be done by upgrading the cluster – in a rolling restart fashion.
Note
If you are still running on Kafka 0.7.x (released in 2012): The only time the aforementioned update instructions will not work is when upgrading from 0.7 to 0.8. In this case refer to the specific Migrating from 0.7 to 0.8 migration guide.
Backup and restoration
The best way to backup a Kafka cluster is to setup a second cluster and replicate events between topics in the cluster. Depending on your setup and requirements, the backup cluster may be in the same data center or in a remote one. See the section on Overview of Multi-Datacenter Deployment Solutions on Confluent Platform for more details.