Quick Start for Confluent Platform
Use Confluent Platform and a few SQL statements to build a real-time application that processes example data streams.
In this quick start, you will:
Install and run Confluent Platform and Apache Kafka®.
Generate real-time mock data.
Create topics to store your data.
Create real-time streams on your data.
Query and join streams with SQL statements.
Build a view that updates as new events arrive.
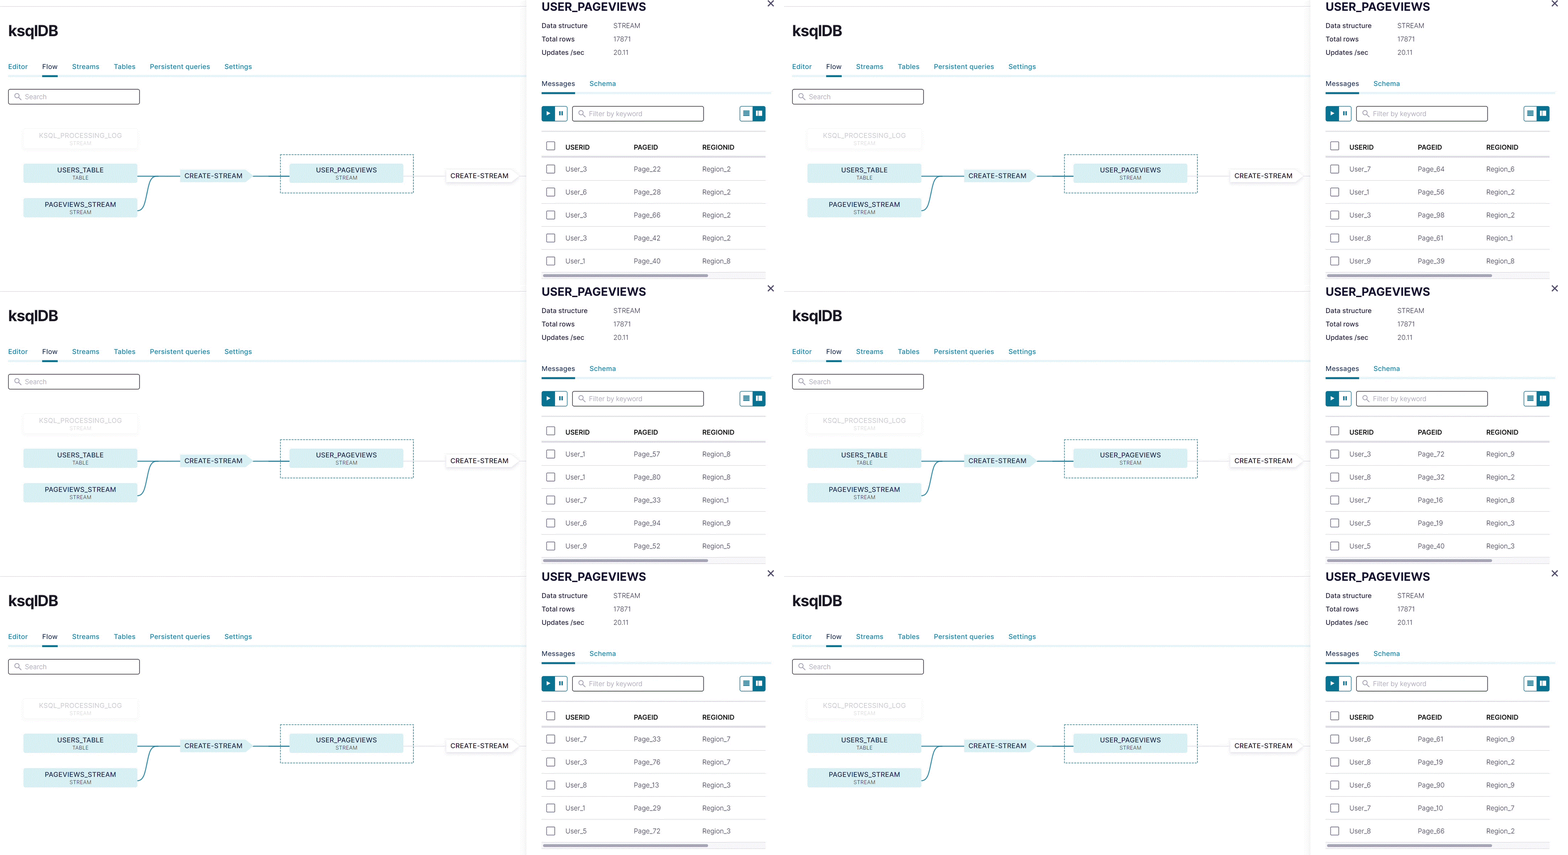
Visualize the topology of your streaming app.
When you finish this quick start, you’ll have a realtime app that consumes and processes data streams by using familiar SQL statements.
Tip
These steps use Docker, but there are other ways to install Confluent Platform. You can use a TAR or ZIP Archive, or package managers like
systemd, Kubernetes, and Ansible. For more information, see Install Confluent Platform On-Premises.If you are interested in a fully managed cloud-native service for Apache Kafka®, sign up for Confluent Cloud and get started for free using the Confluent Cloud Quick Start.
Prerequisites
To run this quick start, you will need Docker and Docker Compose installed on a computer with a supported Operating System. Make sure Docker is running. For full prerequisites, expand the Detailed prerequisites section that follows.
Detailed prerequisites
A connection to the internet.
Operating System currently supported by Confluent Platform.
Note
You can run the Confluent Platform Quick Start on Windows if you are running Docker Desktop for Windows on WSL 2. For more information, see How to Run Confluent on Windows in Minutes.
Docker version 1.11 or later is installed and running.
On Mac: Docker memory is allocated minimally at 6 GB (Mac). When using Docker Desktop for Mac, the default Docker memory allocation is 2 GB. Change the default allocation to 6 GB in the Docker Desktop app by navigating to Preferences > Resources > Advanced.
Networking and Kafka on Docker: Configure your hosts and ports to allow both internal and external components to the Docker network to communicate. For more information, see Kafka Listeners Explained.
Step 1: Download and start Confluent Platform
In this step, you download a Confluent Platform Docker image. This image uses the new Kafka-based KRaft metadata service, which provides several benefits. For more information, see the KRaft Overview. If you would rather download Confluent Platform as a TAR or ZIP archive, see Install Confluent Platform using ZIP and TAR Archives.
Download or copy the contents of the Confluent Platform KRaft all-in-one Docker Compose file, for example:
wget https://raw.githubusercontent.com/confluentinc/cp-all-in-one/7.4.14-post/cp-all-in-one-kraft/docker-compose.ymlNote
To use Apache ZooKeeper as the metadata service, download the Confluent Platform ZooKeeper all-in-one Docker Compose file.
Start the Confluent Platform stack with the
-doption to run in detached mode:docker-compose up -d
Each Confluent Platform component starts in a separate container. Your output should resemble:
Starting broker ... done
Starting schema-registry ... done
Starting connect         ... done
Starting rest-proxy      ... done
Starting ksqldb-server   ... done
Starting ksql-datagen    ... done
Starting ksqldb-cli      ... done
Starting control-center  ... done
Verify that the services are up and running:
docker-compose psYour output should resemble:
   Name                    Command               State                               Ports
--------------------------------------------------------------------------------------------------------------
broker            /etc/confluent/docker/run        Up      0.0.0.0:9092->9092/tcp,:::9092->9092/tcp,
                                                         0.0.0.0:9101->9101/tcp,:::9101->9101/tcp
connect           /etc/confluent/docker/run        Up      0.0.0.0:8083->8083/tcp,:::8083->8083/tcp, 9092/tcp
control-center    /etc/confluent/docker/run        Up      0.0.0.0:9021->9021/tcp,:::9021->9021/tcp
ksql-datagen      bash -c echo Waiting for K ...   Up
ksqldb-cli        /bin/sh                          Up
ksqldb-server     /etc/confluent/docker/run        Up      0.0.0.0:8088->8088/tcp,:::8088->8088/tcp
rest-proxy        /etc/confluent/docker/run        Up      0.0.0.0:8082->8082/tcp,:::8082->8082/tcp
schema-registry   /etc/confluent/docker/run        Up      0.0.0.0:8081->8081/tcp,:::8081->8081/tcp
After a few minutes, if the state of any component isn’t Up, run the
docker-compose up -dcommand again, or trydocker-compose restart <image-name>, for example:docker-compose restart control-center
Note
This Docker image runs Kafka in KRaft isolated mode, which is the supported mode for production workloads for Confluent Platform.
Step 2: Create Kafka topics for storing your data
In Confluent Platform, realtime streaming events are stored in a Kafka topic, which is essentially an append-only log. For more info, see the Apache Kafka Introduction.
In this step, you create two topics by using Confluent Control Center (Legacy). Control Center (Legacy) provides the features for building and monitoring production data pipelines and event streaming applications.
The topics are named pageviews and users. In later steps, you create data generators that produce data to these topics.
Create the pageviews topic
Confluent Control Center (Legacy) enables creating topics in the UI with a few clicks.
Navigate to Control Center (Legacy) at http://localhost:9021. It may take a minute or two for Control Center (Legacy) to start and load.
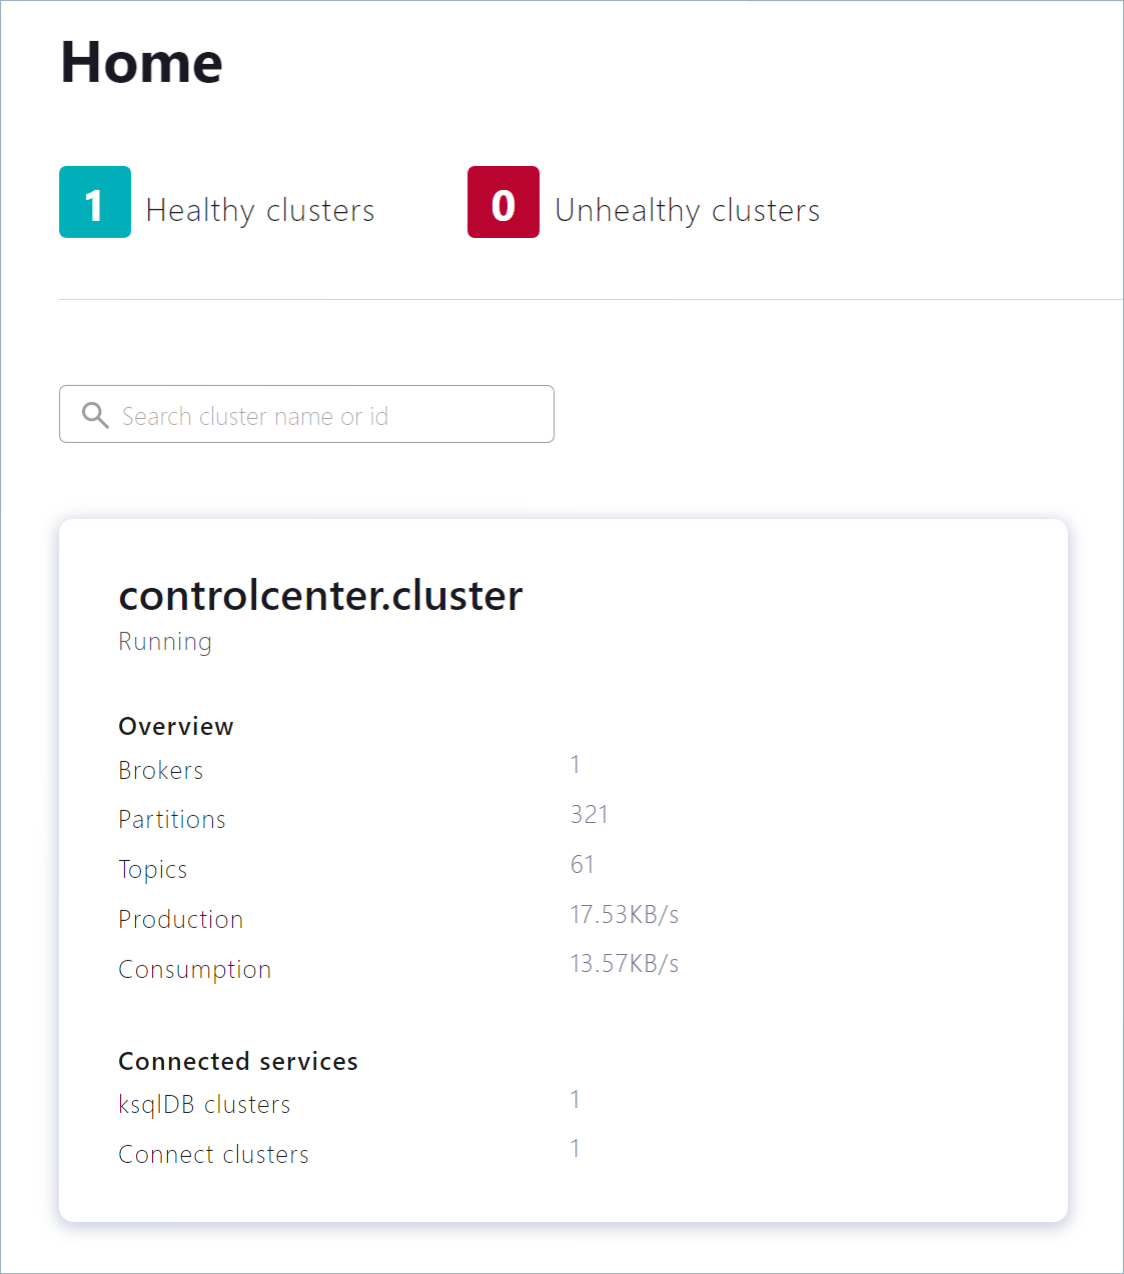
Click the controlcenter.cluster tile.
Note
This tile may look slightly different if you are running in KRaft mode.
In the navigation menu, click Topics to open the topics list. Click Add a topic to start creating the
pageviewstopic.
In the Topic name field, enter
pageviewsand click Create with defaults. Topic names are case-sensitive.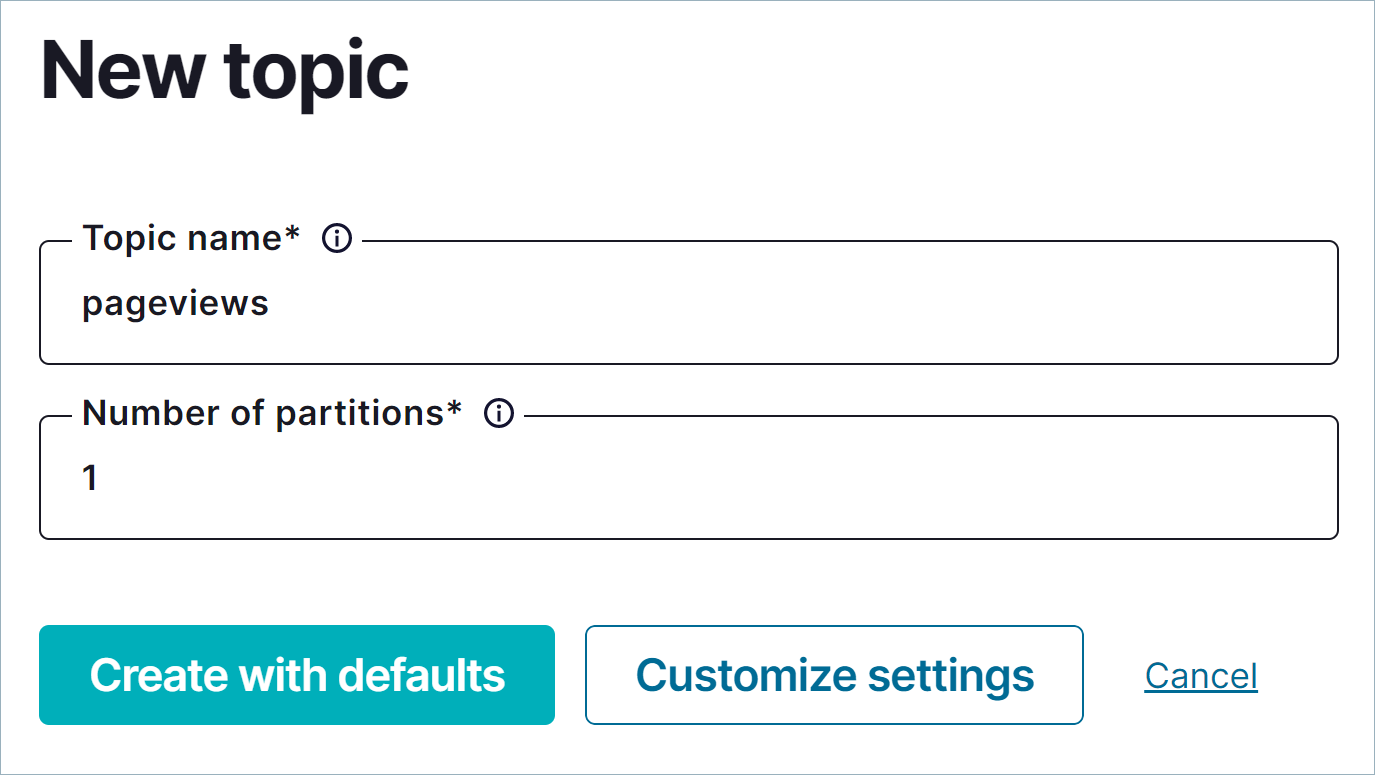
Create the users topic
Repeat the previous steps to create the users topic.
Step 3: Generate mock data
In Confluent Platform, you get events from an external source by using a connector, which enables streaming large volumes of data to and from your Kafka cluster. Confluent publishes many connectors for integrating with external systems, like MongoDb and Elasticsearch. For more information, see the Kafka Connect Overview page.
In this step, you run the Datagen Source Connector to generate mock data. The mock data is stored in the pageviews and users topics that you created previously. To learn more about installing connectors, see Install Self-Managed Connectors.
In the navigation menu, click Connect.
Click the
connect-defaultcluster in the Connect clusters list.Click Add connector to start creating a connector for pageviews data.
Select the
DatagenConnectortile.Tip
To see source connectors only, click Filter by category and select Sources.
In the Name field, enter
datagen-pageviewsas the name of the connector.Enter the following configuration values in the following sections:
Common section:
Key converter class:
org.apache.kafka.connect.storage.StringConverter.
General section:
kafka.topic:
pageviews. You can choose this from the dropdown.max.interval:
100.quickstart:
pageviews.
Click Next to review the connector configuration. When you’re satisfied with the settings, click Launch.
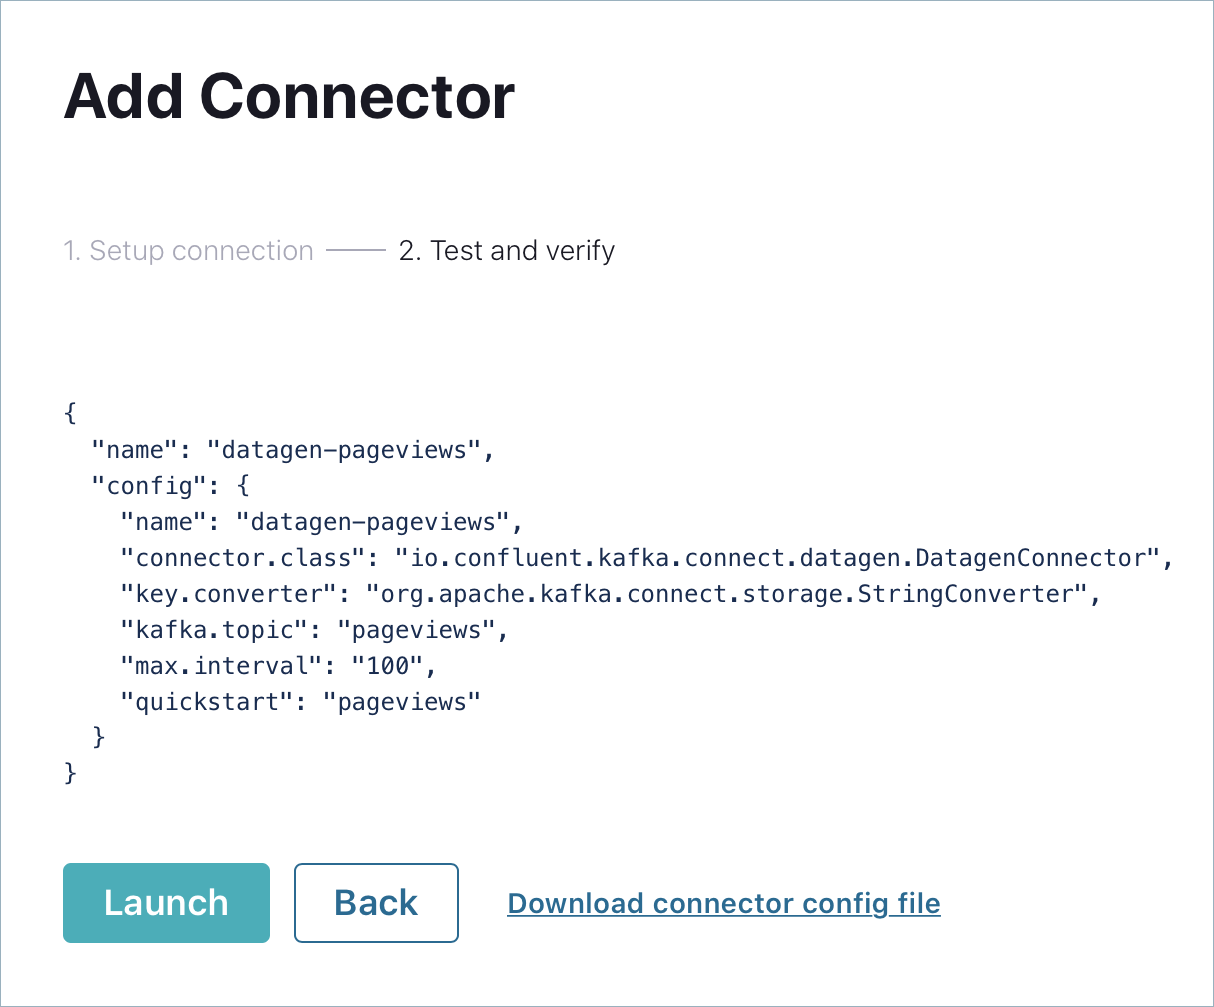
Run a second instance of the Datagen Source connector connector to produce mock data to the users topic.
In the navigation menu, click Connect.
In the Connect clusters list, click
connect-default.Click Add connector.
Select the
DatagenConnectortile.In the Name field, enter
datagen-usersas the name of the connector.Enter the following configuration values:
Common section:
Key converter class:
org.apache.kafka.connect.storage.StringConverter
General section:
kafka.topic:
usersmax.interval:
1000quickstart:
users
Click Next to review the connector configuration. When you’re satisfied with the settings, click Launch.
In the navigation menu, click Topics and in the list, click users.
Click Messages to confirm that the
datagen-usersconnector is producing data to theuserstopic.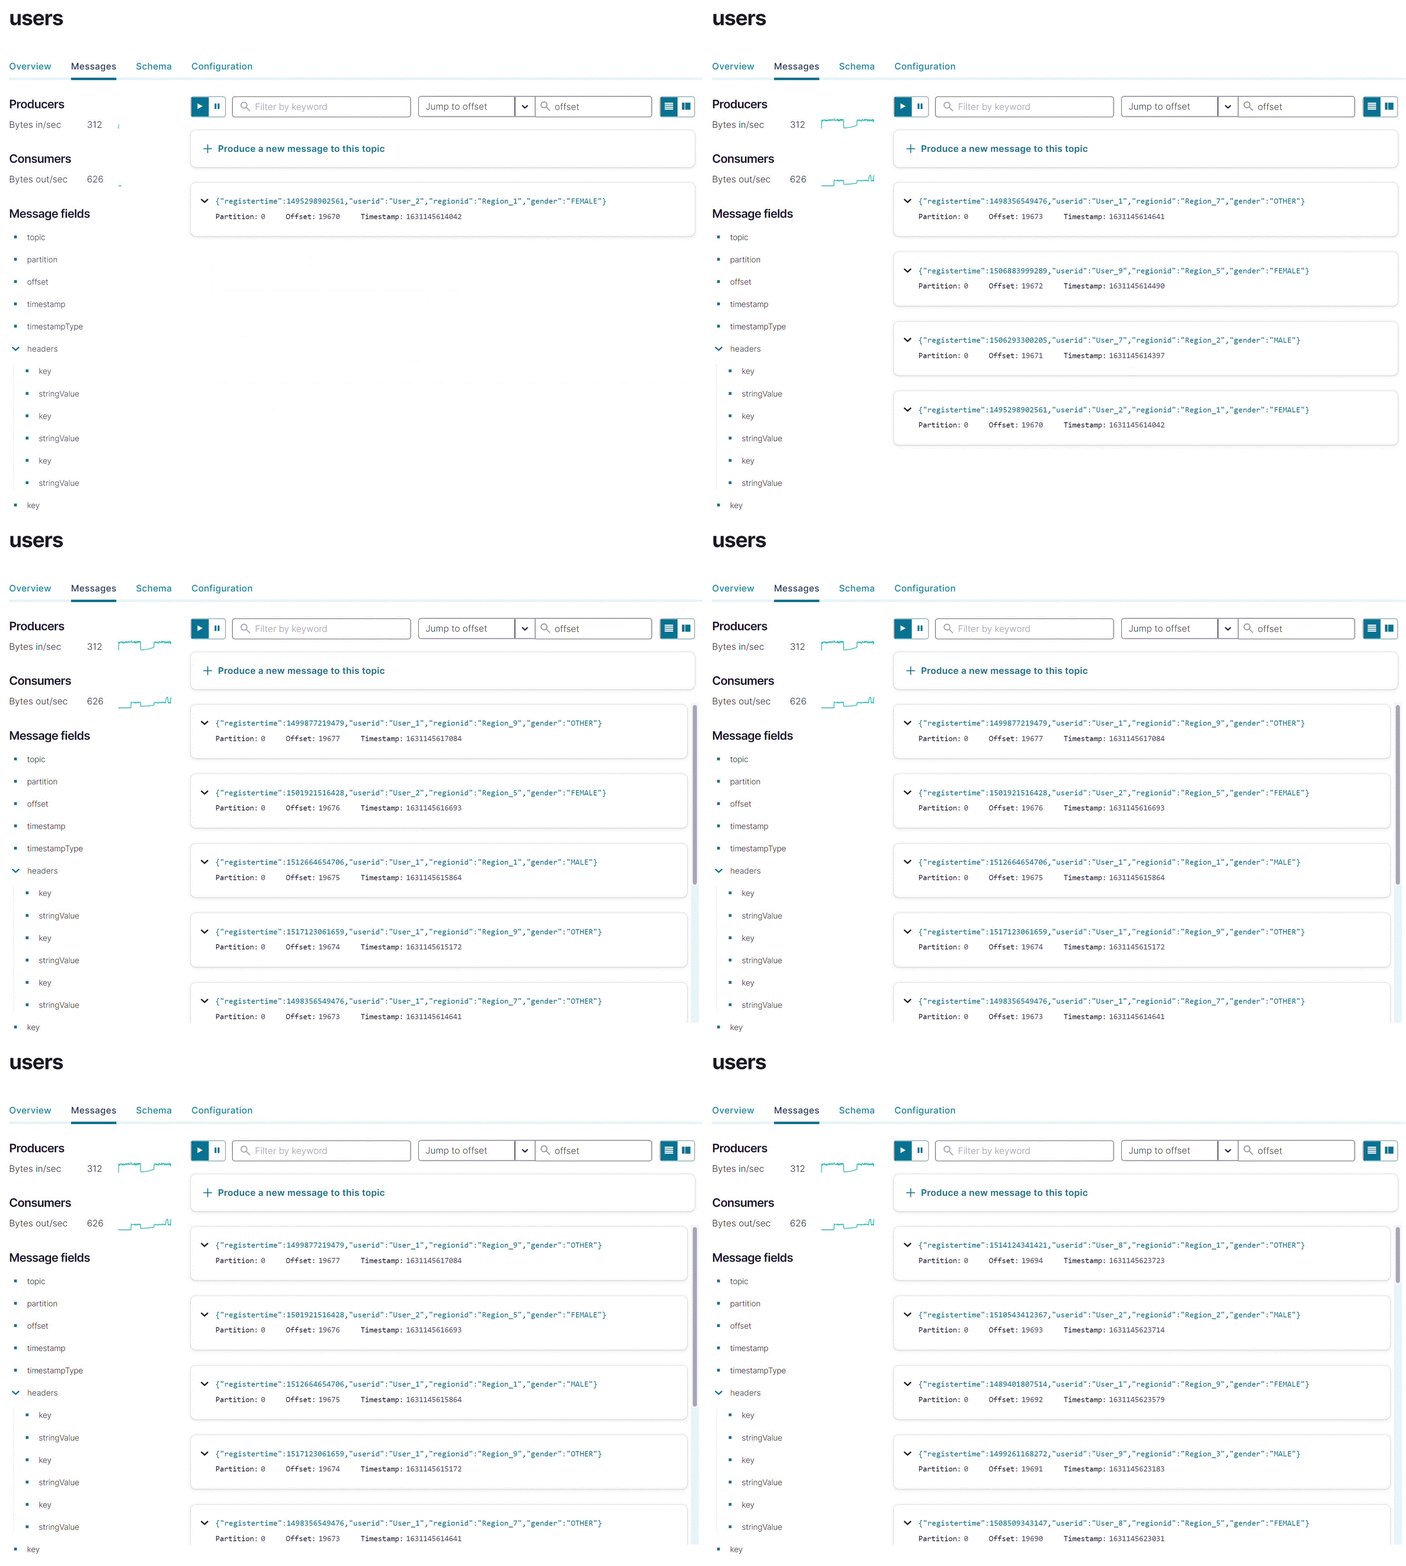
Inspect the schema of a topic
By default, the Datagen Source Connector produces data in Avro format, which defines the schemas of pageviews and users messages.
Schema Registry ensures that messages sent to your cluster have the correct schema. For more information, see Schema Registry for Confluent Platform.
In the navigation menu, click Topics, and in the topic list, click pageviews.
Click Schema to inspect the Avro schema that applies to
pageviewsmessage values.Your output should resemble:
{
  "connect.name": "ksql.pageviews",
  "fields": [
    {
      "name": "viewtime",
      "type": "long"
    },
    {
      "name": "userid",
      "type": "string"
    },
    {
      "name": "pageid",
      "type": "string"
    }
  ],
  "name": "pageviews",
  "namespace": "ksql",
  "type": "record"
}
Step 4: Create a stream and table by using SQL statements
In this step, you create a stream for the pageviews topic and a table for the users topic by using familiar SQL syntax. When you register a stream or a table on a topic, you can use the stream/table in SQL statements.
Note
A stream is a an immutable, append-only collection that represents a series of historical facts, or events. After a row is inserted into a stream, the row can never change. You can append new rows at the end of the stream, but you can’t update or delete existing rows.
A table is a mutable collection that models change over time. It uses row keys to display the most recent data for each key. All but the newest rows for each key are deleted periodically. Also, each row has a timestamp, so you can define a windowed table which enables controlling how to group records that have the same key for stateful operations – like aggregations and joins – into time spans. Windows are tracked by record key.
Together, streams and tables comprise a fully realized database. For more information, see Stream processing.
The SQL engine is implemented in ksqlDB, the purpose-built database for stream processing applications. The following steps show how to create a ksqlDB application, which enables processing real-time data with familiar SQL syntax.
This example app shows these stream processing operations.
JOIN the
pageviewsstream with theuserstable to create an enriched stream of pageview events.Filter the enriched stream by the
regionfield.Create a windowed view on the filtered stream that shows the most recently updated rows. The window has a SIZE of 30 seconds.
Tip
These processing steps are implemented with only three SQL statements.
The following steps show how use the CREATE STREAM and CREATE TABLE statements to register a stream on the pageviews topic and a table on the users topic. Registering a stream or a table on a topic enables SQL queries on the topic’s data.
In the navigation menu, click ksqlDB.
Click the
ksqldb1application to open the ksqlDB page. There are tabs for editing SQL statements and for monitoring the streams and tables that you create.Copy the following SQL into the editor window. This statement registers a stream, named
pageviews_stream, on thepageviewstopic. Stream and table names are not case-sensitive.CREATE STREAM pageviews_stream WITH (KAFKA_TOPIC='pageviews', VALUE_FORMAT='AVRO');
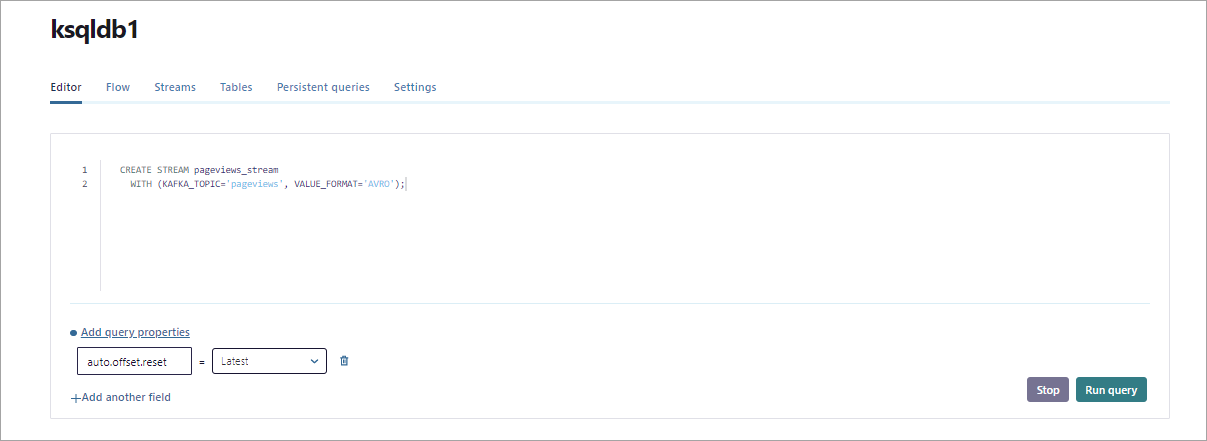
Click Run query to execute the statement. In the result window, your output should resemble:
{
  "@type": "currentStatus",
  "statementText": "CREATE STREAM PAGEVIEWS_STREAM (VIEWTIME BIGINT, USERID STRING, PAGEID STRING) WITH (KAFKA_TOPIC='pageviews', KEY_FORMAT='KAFKA', VALUE_FORMAT='AVRO', VALUE_SCHEMA_ID=2);",
  "commandId": "stream/`PAGEVIEWS_STREAM`/create",
  "commandStatus": {
    "status": "SUCCESS",
    "message": "Stream created",
    "queryId": null
  },
  "commandSequenceNumber": 2,
  "warnings": []
}
Use a SELECT query to confirm that data is moving through your stream. Copy the following SQL into the editor and click Run query.
SELECT * FROM pageviews_stream EMIT CHANGES;
Your output should resemble:
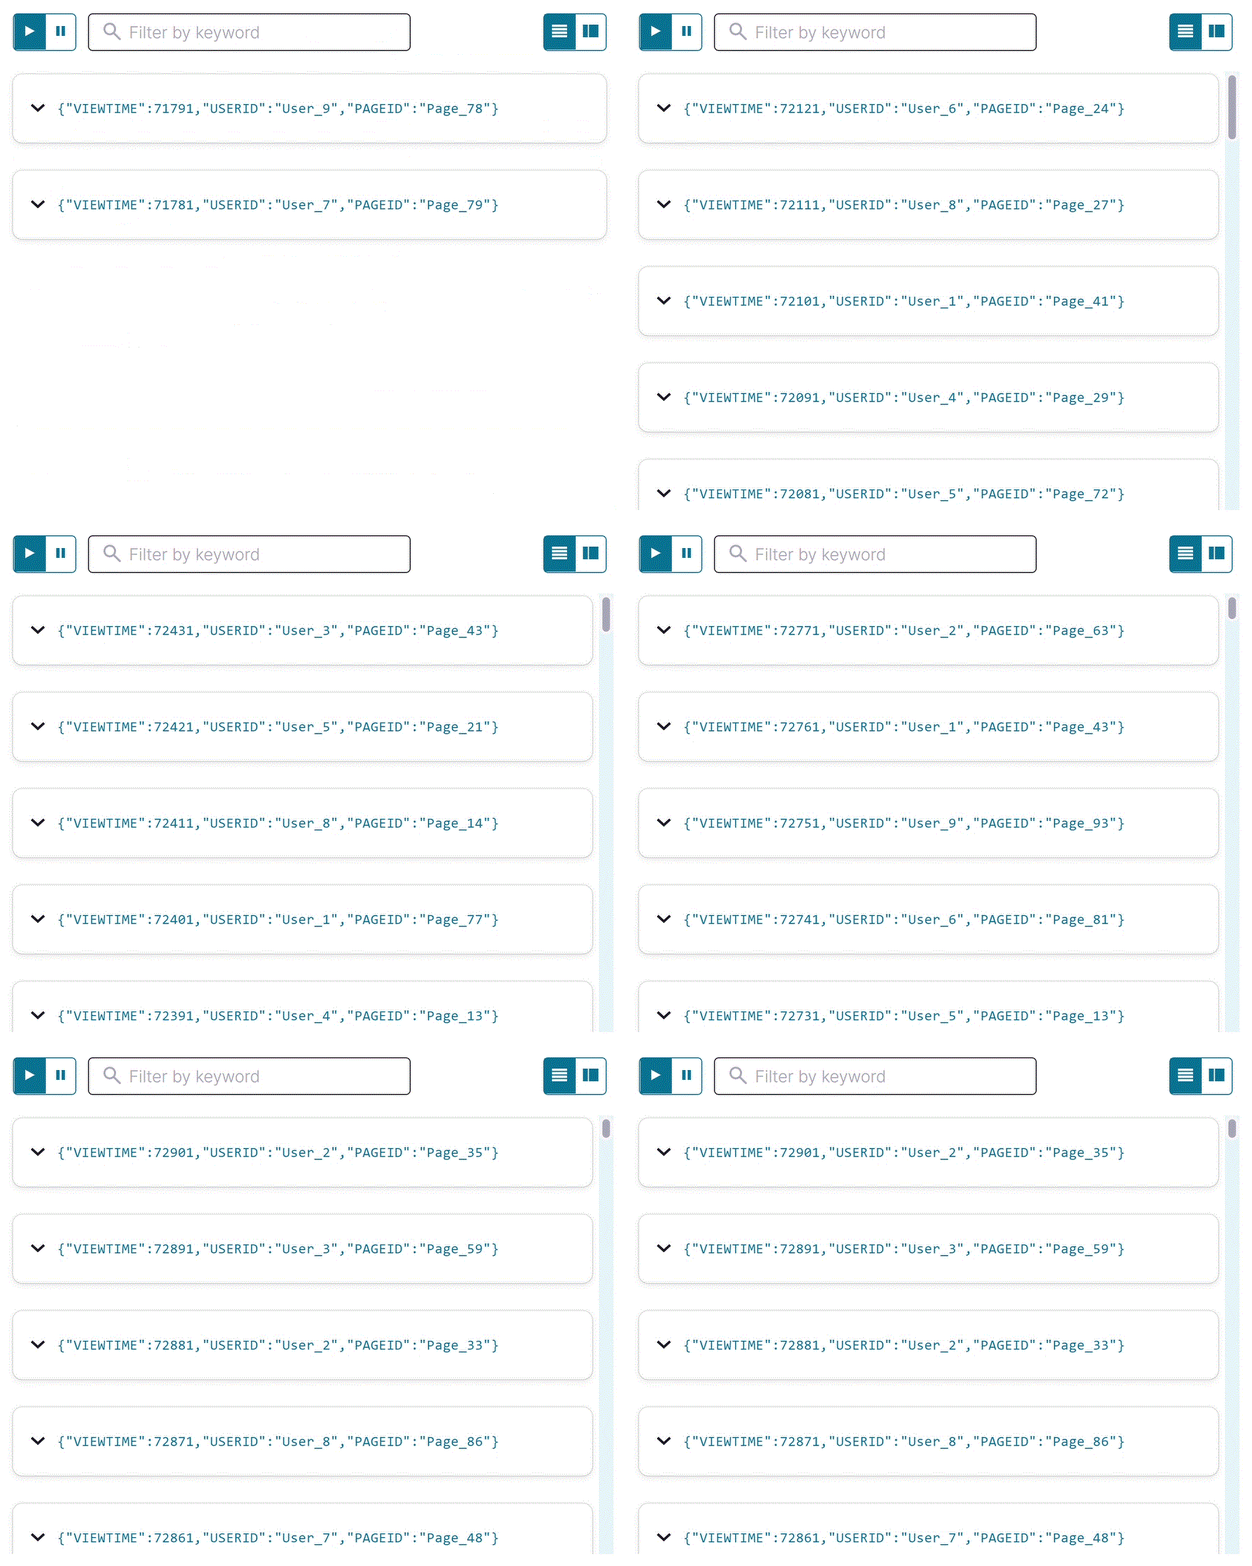
Click Stop to end the SELECT query.
Important
Stopping the SELECT query doesn’t stop data movement through the stream.
Copy the following SQL into the editor window and click Run query. This statement registers a table, named
users_table, on theuserstopic.CREATE TABLE users_table (id VARCHAR PRIMARY KEY) WITH (KAFKA_TOPIC='users', VALUE_FORMAT='AVRO');
Your output should resemble:
{
  "@type": "currentStatus",
  "statementText": "CREATE TABLE USERS_TABLE (ID STRING PRIMARY KEY, REGISTERTIME BIGINT, USERID STRING, REGIONID STRING, GENDER STRING) WITH (KAFKA_TOPIC='users', KEY_FORMAT='KAFKA', VALUE_FORMAT='AVRO', VALUE_SCHEMA_ID=2);",
  "commandId": "table/`USERS_TABLE`/create",
  "commandStatus": {
     "status": "SUCCESS",
     "message": "Table created",
     "queryId": null
  },
  "commandSequenceNumber": 4,
  "warnings": []
}
A table requires you to specify a PRIMARY KEY when you register it. In ksqlDB, a table is similar to tables in other SQL systems: a table has zero or more rows, and each row is identified by its PRIMARY KEY.
Inspect the schemas of your stream and table
Schema Registry is installed with Confluent Platform and is running in the stack, so you don’t need to specify message schemas in your CREATE STREAM and CREATE TABLE statements. For the Avro, JSON_SR, and Protobuf formats, Schema Registry infers schemas automatically.
Click Streams to see the currently registered streams. In the list, click PAGEVIEWS_STREAM to see details about the stream.
In the Schema section, you can see the field names and types for the message values produced by the
datagen-pageviewsconnector.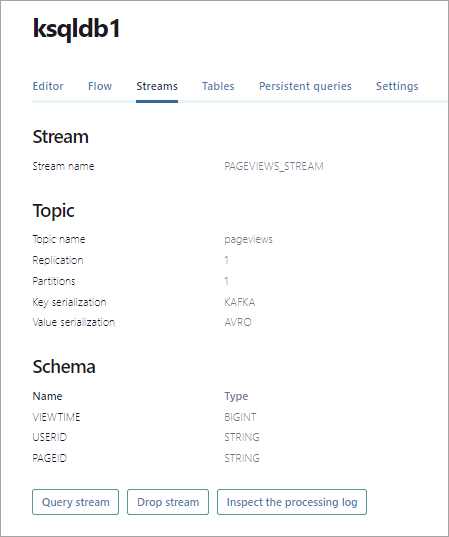
Click Tables to see the currently registered tables. In the list, click USERS_TABLE to see details about the table.
In the Schema section, you can see the field names and types for the message values produced by the
datagen-usersconnector.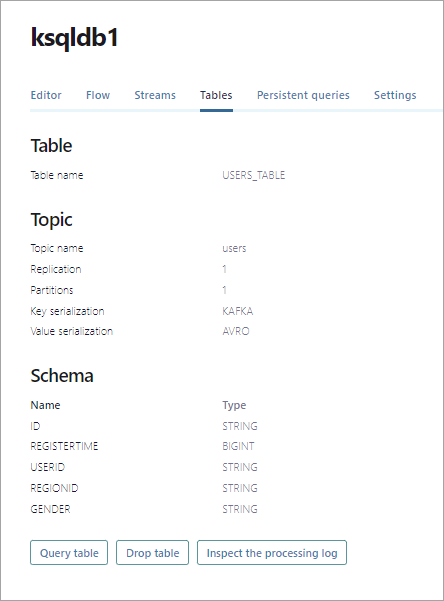
Create queries to process data
In this step, you write SQL queries that inspect and process pageview and user rows. You can create different kinds of queries.
Transient query: a non-persistent, client-side query that you terminate manually or with a LIMIT clause. A transient query doesn’t create a new topic.
Persistent query: a server-side query that outputs a new stream or table that’s backed by a new topic. It runs until you issue the TERMINATE statement. The syntax for a persistent query uses the CREATE STREAM AS SELECT or CREATE TABLE AS SELECT statements.
Push query: A query that produces results continuously to a subscription. The syntax for a push query uses the EMIT CHANGES keyword. Push queries can be transient or persistent.
Pull query: A query that gets a result as of “now”, like a query against a traditional relational database. A pull query runs once and returns the current state of a table. Tables are updated incrementally as new events arrive, so pull queries run with predictably low latency. Pull queries are always transient.
Query for pageviews
Click Editor to return to the query editor.
Copy the following SQL into the editor and click Run query. This statement creates a transient query that returns three rows from
pageviews_stream.SELECT pageid FROM pageviews_stream EMIT CHANGES LIMIT 3;
Your output should resemble:
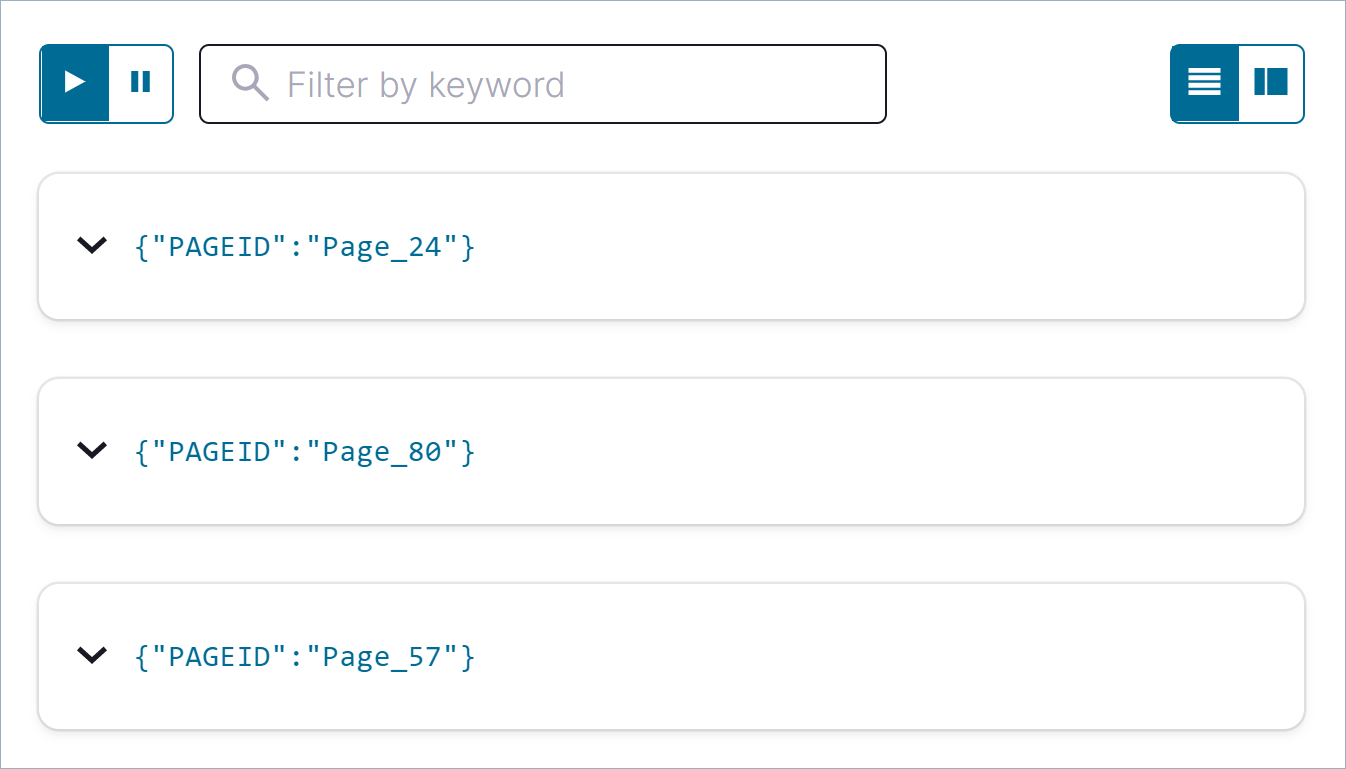
Click the Card view or Table view icon to change the layout of the output.
Join your stream and table
In this step, you create a stream named user_pageviews by using a persistent query that joins pageviews_stream with users_table on the userid key. This join enriches pageview data with information about the user who viewed the page. The joined rows are written to a new sink topic, which has the same name as the new stream, by default.
Tip
You can specify the name of the sink topic by using the KAFKA_TOPIC keyword in a WITH clause.
The following steps show how to join a stream with a table and view the resulting stream’s output.
Copy the following SQL into the editor and click Run query.
CREATE STREAM user_pageviews
  AS SELECT users_table.id AS userid, pageid, regionid, gender
    FROM pageviews_stream
    LEFT JOIN users_table ON pageviews_stream.userid = users_table.id
EMIT CHANGES;
Your output should resemble:
{
  "@type": "currentStatus",
  "statementText": "CREATE STREAM USER_PAGEVIEWS WITH (KAFKA_TOPIC='USER_PAGEVIEWS', PARTITIONS=1, REPLICAS=1) AS SELECT\n  USERS_TABLE.ID USERID,\n  PAGEVIEWS_STREAM.PAGEID PAGEID,\n  USERS_TABLE.REGIONID REGIONID,\n  USERS_TABLE.GENDER GENDER\nFROM PAGEVIEWS_STREAM PAGEVIEWS_STREAM\nLEFT OUTER JOIN USERS_TABLE USERS_TABLE ON ((PAGEVIEWS_STREAM.USERID = USERS_TABLE.ID))\nEMIT CHANGES;",
  "commandId": "stream/`USER_PAGEVIEWS`/create",
  "commandStatus": {
     "status": "SUCCESS",
     "message": "Created query with ID CSAS_USER_PAGEVIEWS_5",
     "queryId": "CSAS_USER_PAGEVIEWS_5"
  },
  "commandSequenceNumber": 6,
  "warnings": []
}
Tip
The highlighted lines in the output show that the query’s internal identifier is
CSAS_USER_PAGEVIEWS_5and is prepended with “CSAS”, which stands for CREATE STREAM AS SELECT.Identifiers for tables are prepended with “CTAS”, which stands for CREATE TABLE AS SELECT.
Click Streams to open the list of streams that you can access.
Select USER_PAGEVIEWS, and click Query stream.
The editor opens with a transient SELECT query, and streaming output from the
user_pageviewsstream displays in the result window. The joined stream has all fields frompageviews_streamandusers_table.Note
The query uses the EMIT CHANGES syntax, which indicates that this is a push query. A push query enables you to query a stream or table with a subscription to the results. It continues until you stop it. For more information, see Push queries.
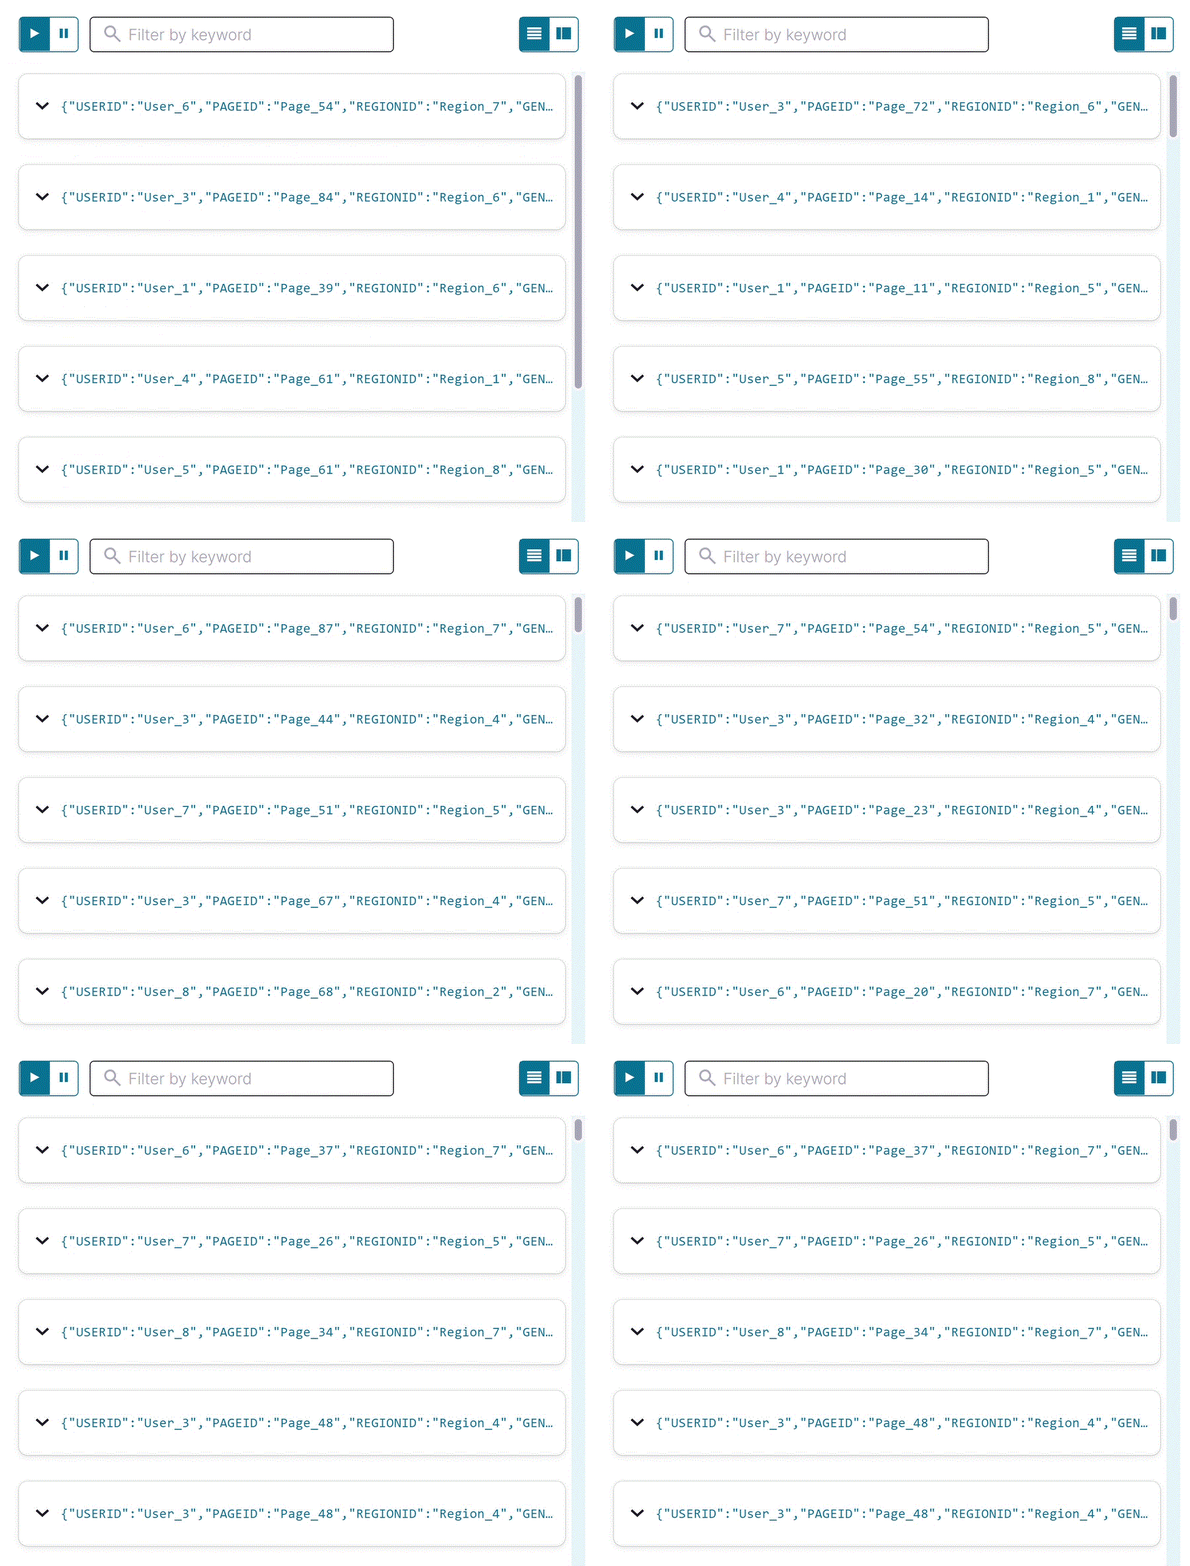
Click Stop to end the transient push query.
Filter a stream
In this step, you create a stream, named pageviews_region_like_89, which is made of user_pageviews rows that have a regionid value that ends with 8 or 9. Results from this query are written to a new topic, named pageviews_filtered_r8_r9. The topic name is specified explicitly in the query by using the KAFKA_TOPIC keyword.
Copy the following SQL into the editor and click Run query.
CREATE STREAM pageviews_region_like_89
  WITH (KAFKA_TOPIC='pageviews_filtered_r8_r9', VALUE_FORMAT='AVRO')
    AS SELECT * FROM user_pageviews
    WHERE regionid LIKE '%_8' OR regionid LIKE '%_9'
EMIT CHANGES;
Your output should resemble:
{
  "@type": "currentStatus",
  "statementText": "CREATE STREAM PAGEVIEWS_REGION_LIKE_89 WITH (KAFKA_TOPIC='pageviews_filtered_r8_r9', PARTITIONS=1, REPLICAS=1, VALUE_FORMAT='AVRO') AS SELECT *\nFROM USER_PAGEVIEWS USER_PAGEVIEWS\nWHERE ((USER_PAGEVIEWS.REGIONID LIKE '%_8') OR (USER_PAGEVIEWS.REGIONID LIKE '%_9'))\nEMIT CHANGES;",
  "commandId": "stream/`PAGEVIEWS_REGION_LIKE_89`/create",
  "commandStatus": {
     "status": "SUCCESS",
     "message": "Created query with ID CSAS_PAGEVIEWS_REGION_LIKE_89_7",
     "queryId": "CSAS_PAGEVIEWS_REGION_LIKE_89_7"
  },
  "commandSequenceNumber": 8,
  "warnings": []
}
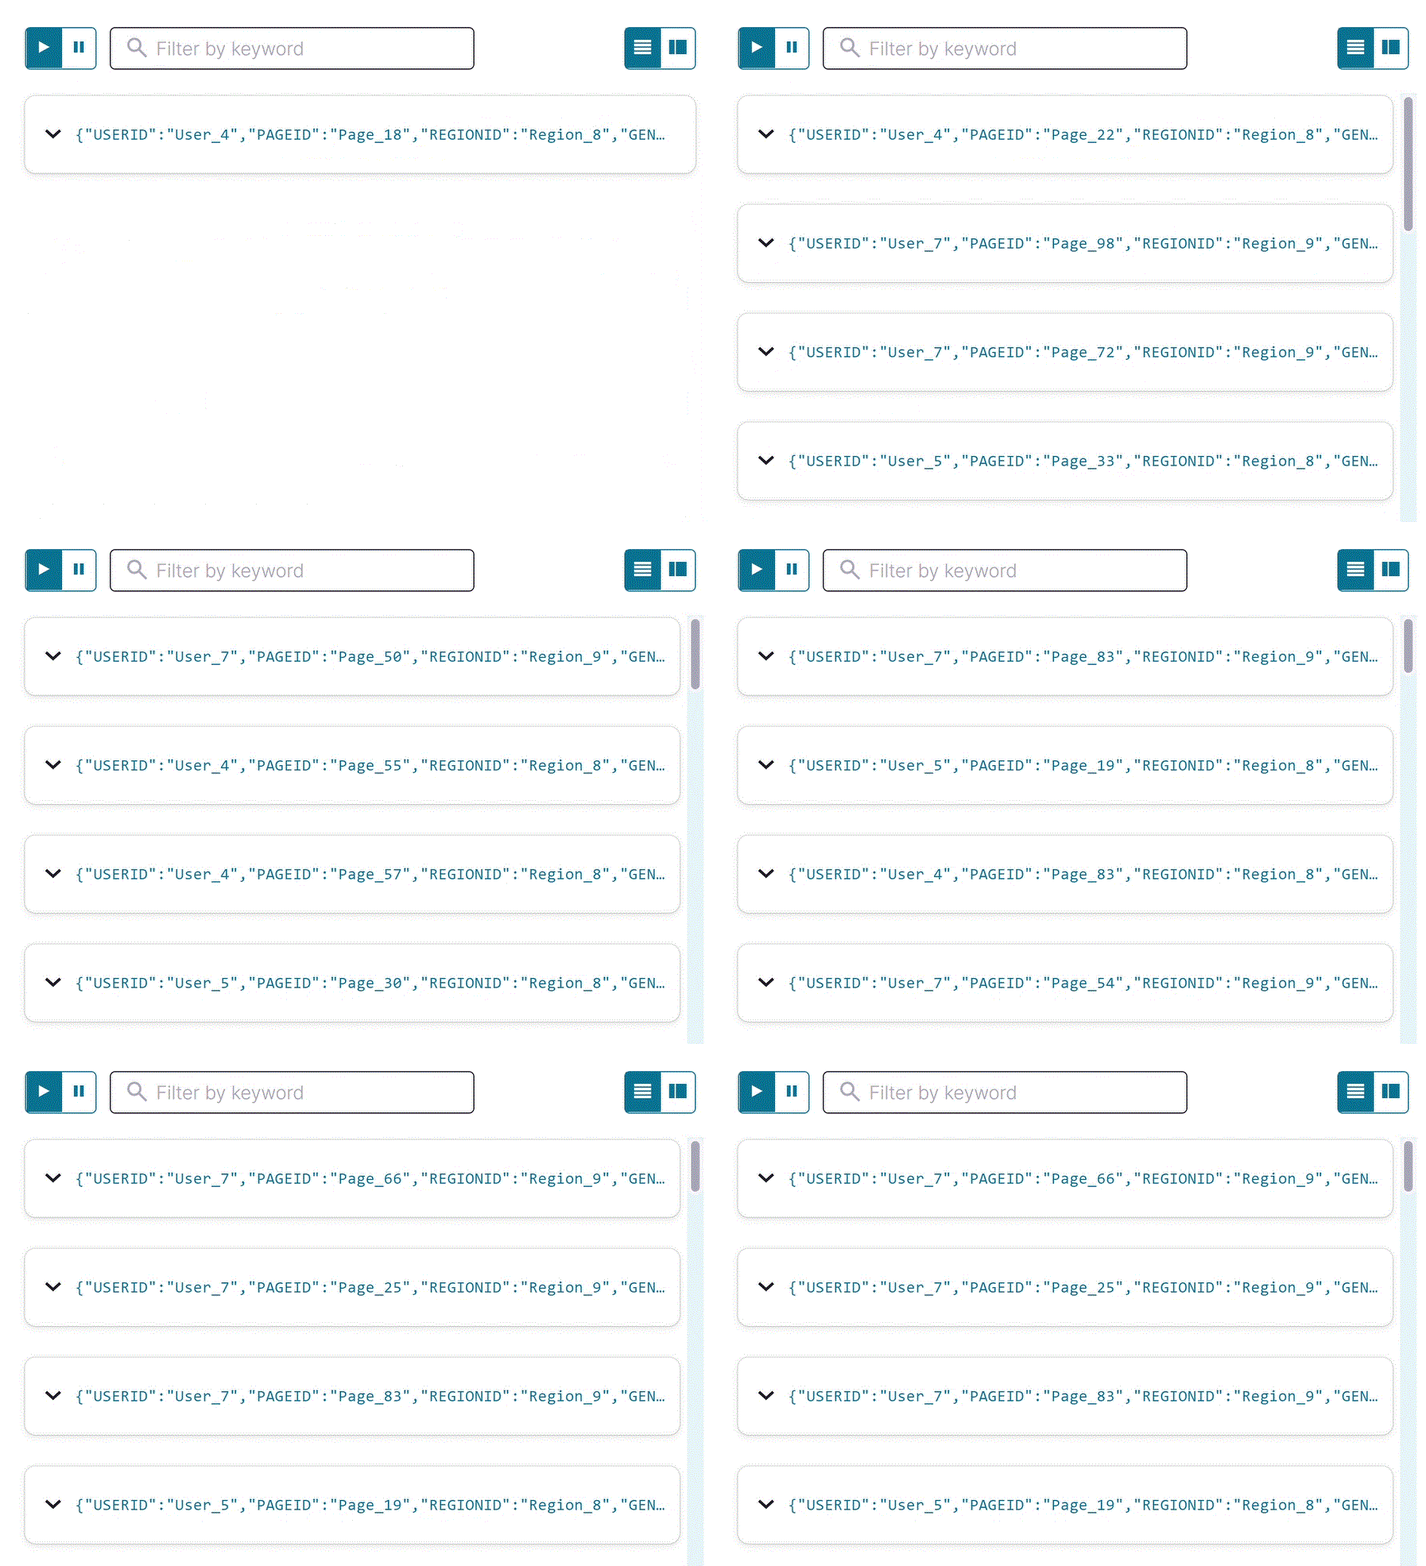
Inspect the filtered output of the
pageviews_region_like_89stream. Copy the following SQL into the editor and click Run query.SELECT * FROM pageviews_region_like_89 EMIT CHANGES;
Your output should resemble:
Create a windowed view
In this step, you create a table named pageviews_per_region_89 that counts the number of pageviews from regions 8 and 9 in a tumbling window with a SIZE of 30 seconds. The query result is an aggregation that counts and groups rows, so the result is a table, instead of a stream.
Copy the following SQL into the editor and click Run query.
CREATE TABLE pageviews_per_region_89 WITH (KEY_FORMAT='JSON')
  AS SELECT userid, gender, regionid, COUNT(*) AS numusers
    FROM pageviews_region_like_89
    WINDOW TUMBLING (SIZE 30 SECOND)
    GROUP BY userid, gender, regionid
    HAVING COUNT(*) > 1
EMIT CHANGES;
Your output should resemble:
{
  "@type": "currentStatus",
  "statementText": "CREATE TABLE PAGEVIEWS_PER_REGION_89 WITH (KAFKA_TOPIC='PAGEVIEWS_PER_REGION_89', KEY_FORMAT='JSON', PARTITIONS=1, REPLICAS=1) AS SELECT\n  PAGEVIEWS_REGION_LIKE_89.GENDER GENDER,\n  PAGEVIEWS_REGION_LIKE_89.REGIONID REGIONID,\n  COUNT(*) NUMUSERS\nFROM PAGEVIEWS_REGION_LIKE_89 PAGEVIEWS_REGION_LIKE_89\nWINDOW TUMBLING ( SIZE 30 SECONDS ) \nGROUP BY PAGEVIEWS_REGION_LIKE_89.GENDER, PAGEVIEWS_REGION_LIKE_89.REGIONID\nHAVING (COUNT(*) > 1)\nEMIT CHANGES;",
  "commandId": "table/`PAGEVIEWS_PER_REGION_89`/create",
  "commandStatus": {
     "status": "SUCCESS",
     "message": "Created query with ID CTAS_PAGEVIEWS_PER_REGION_89_9",
     "queryId": "CTAS_PAGEVIEWS_PER_REGION_89_9"
  },
  "commandSequenceNumber": 10,
  "warnings": []
}
Inspect the windowed output of the
pageviews_per_region_89table. Copy the following SQL into the editor and click Run query.SELECT * FROM pageviews_per_region_89 EMIT CHANGES;
Click the table view button (
 ).
).Your output should resemble:
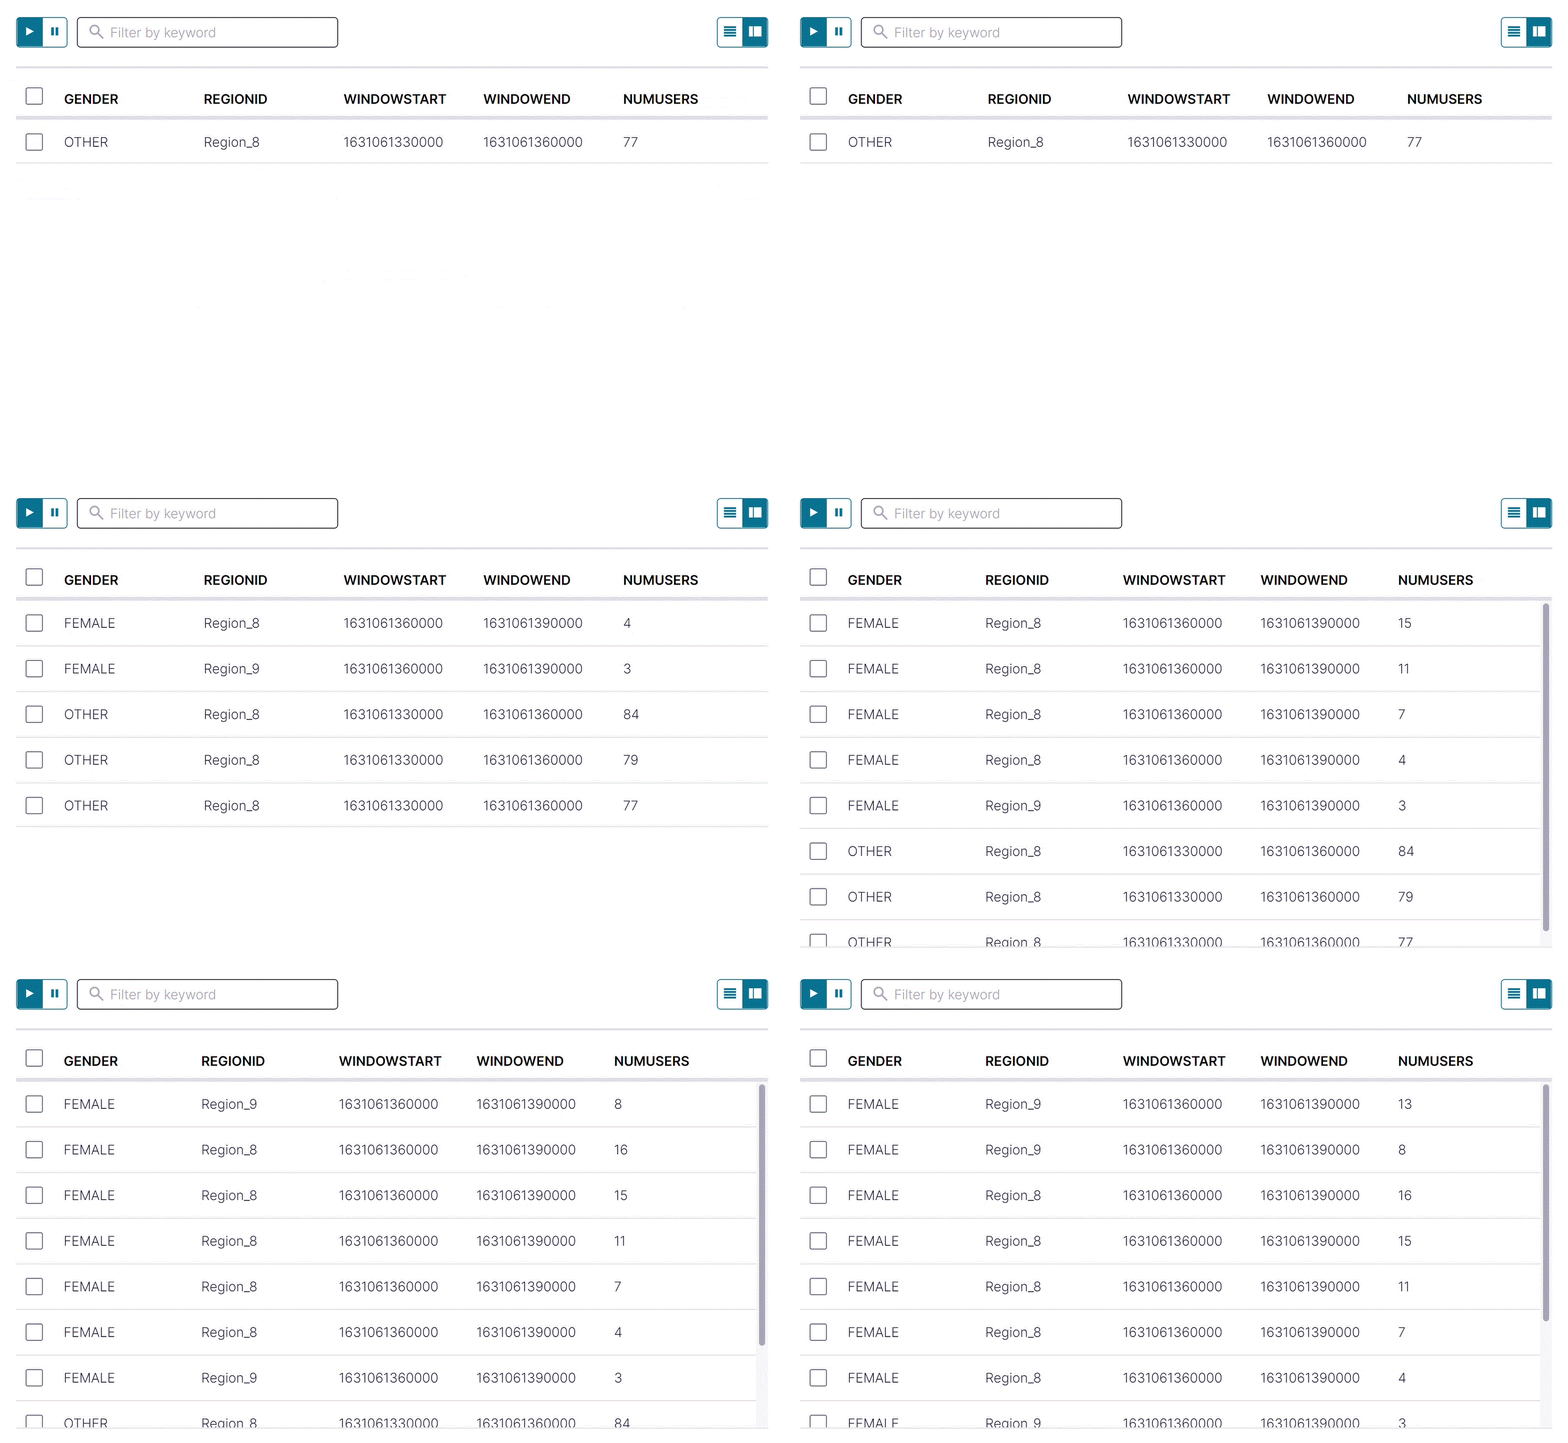
The NUMUSERS column shows the count of users who clicked within each 30-second window.
Snapshot a table by using a pull query
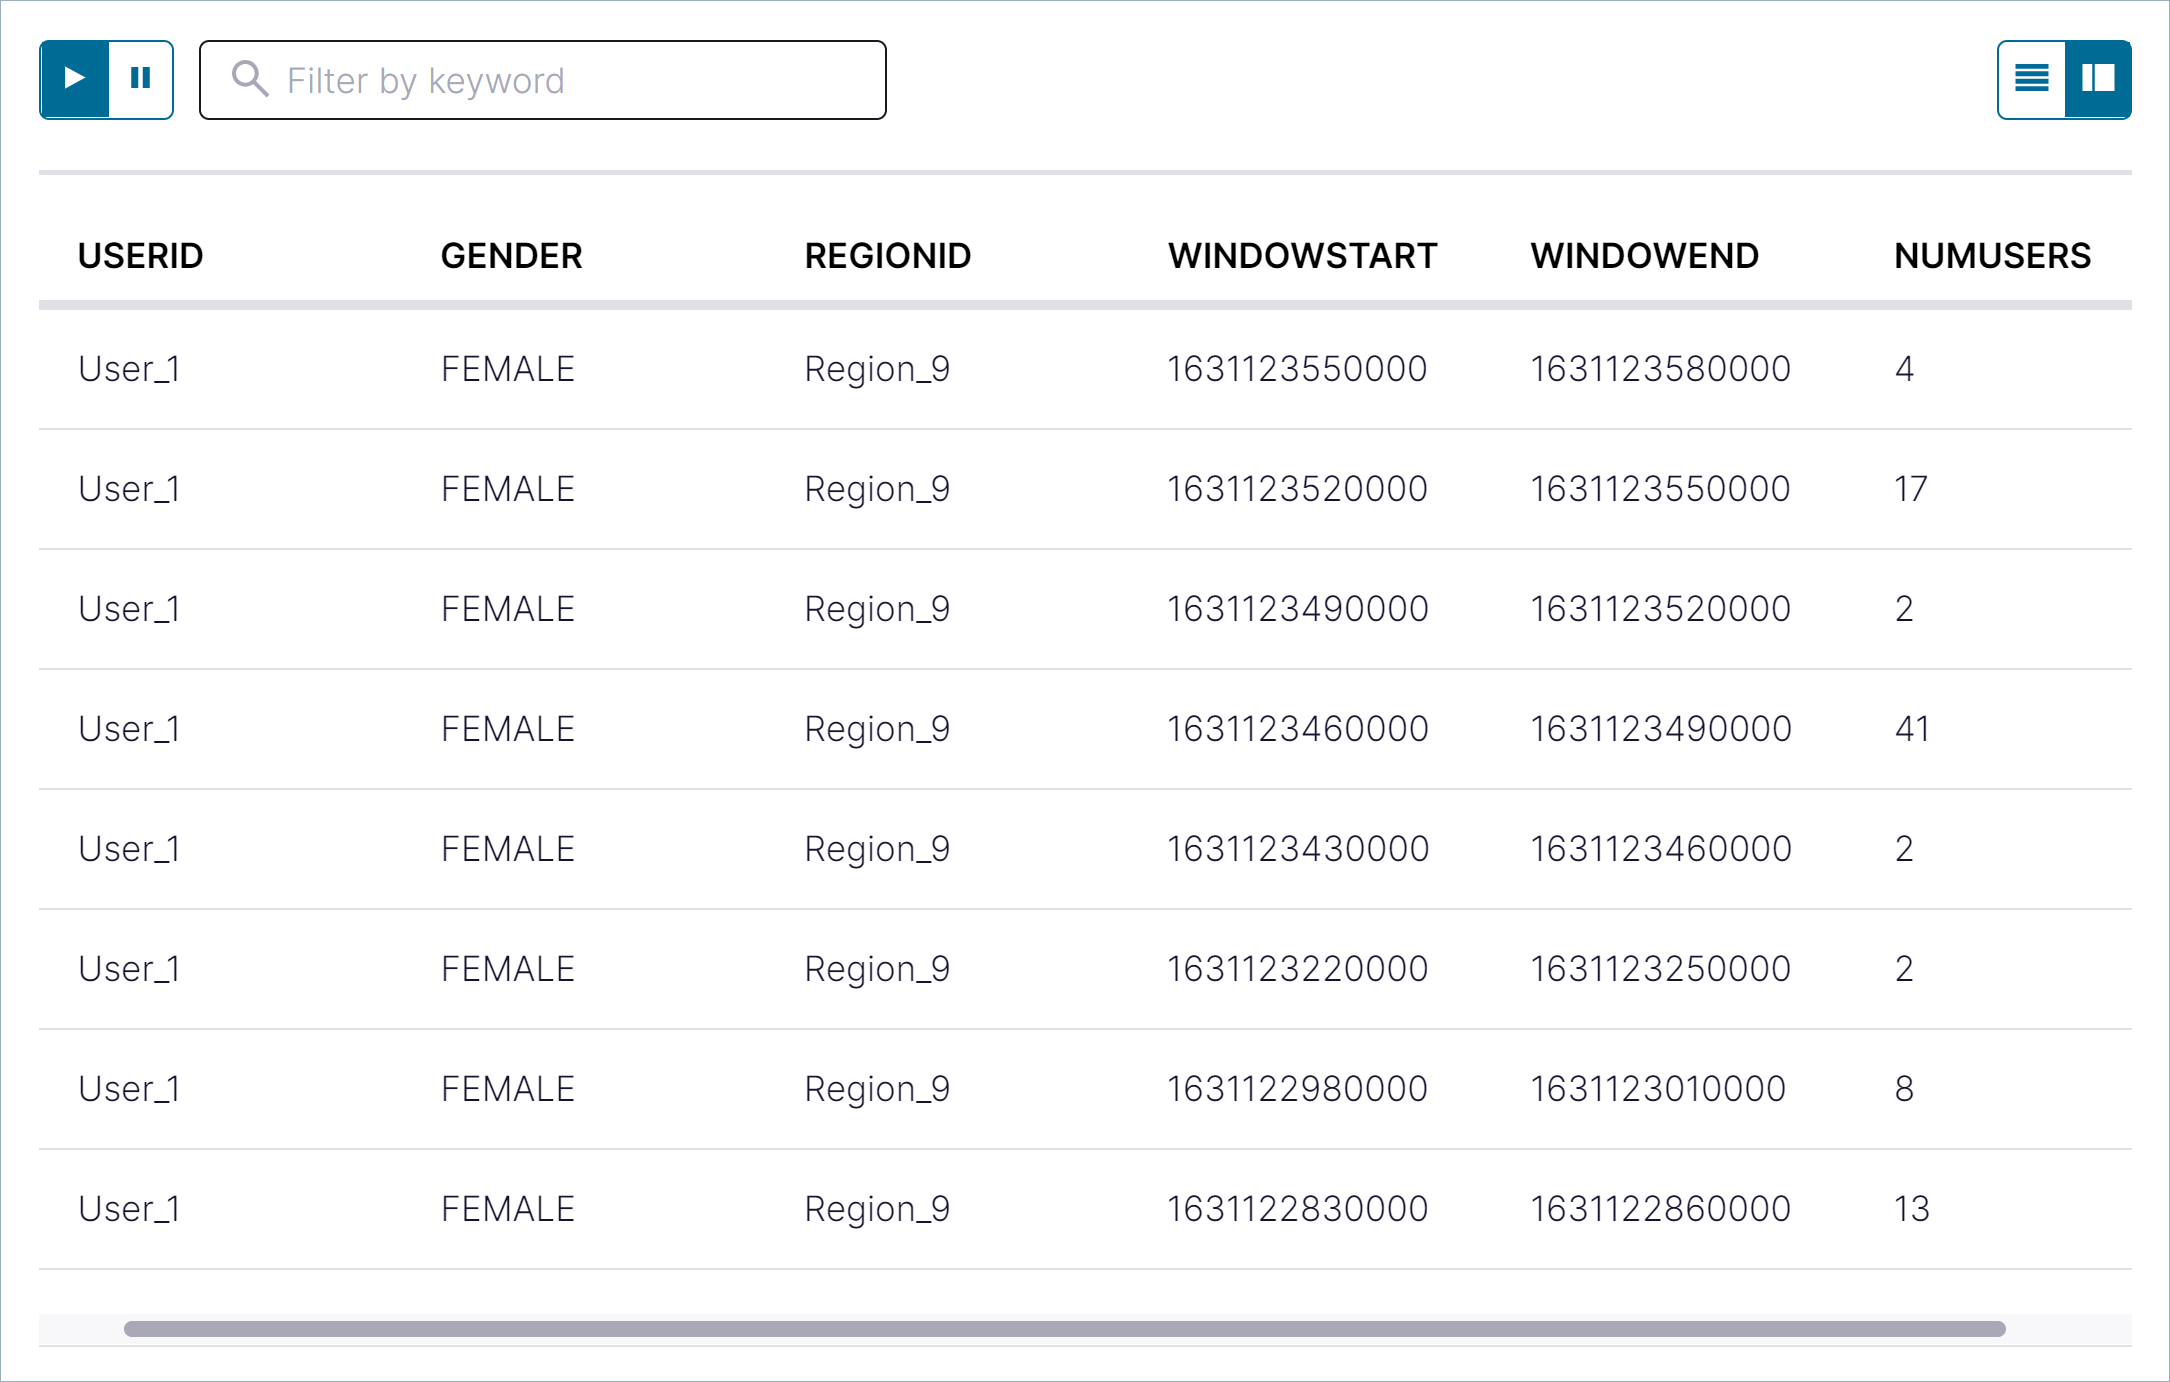
You can get the current state of a table by using a pull query, which returns rows for a specific key at the time you issue the query. A pull query runs once and terminates.
In the step, you query the pageviews_per_region_89 table for all rows that have User_1 in Region_9.
Copy the following SQL into the editor and click Run query.
SELECT * FROM pageviews_per_region_89
  WHERE userid = 'User_1' AND gender='FEMALE' AND regionid='Region_9';
Your output should resemble:
Inspect your streams and tables
In the upper-right corner of the editor, the All available streams and tables pane shows all of the streams and tables that you can access. Click PAGEVIEWS_PER_REGION_89 to see the fields in the
pageviews_per_region_89table.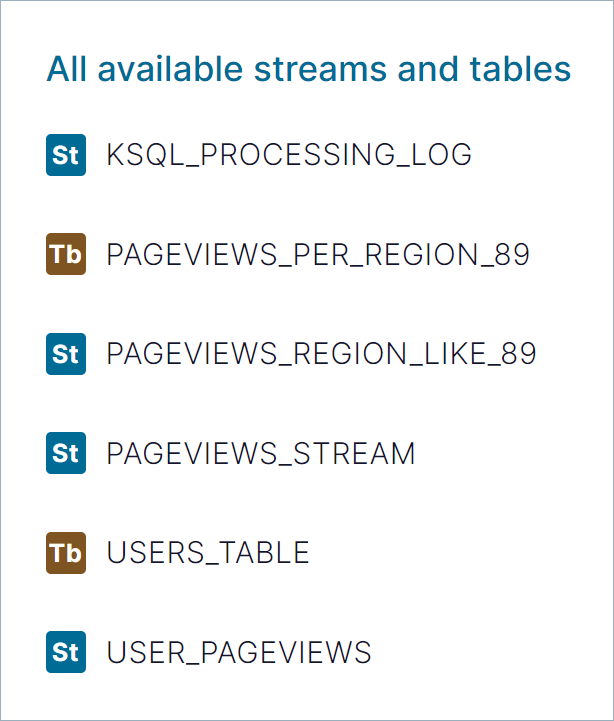
In the All available streams and tables section, click KSQL_PROCESSING_LOG to view the fields in the processing log, including nested data structures. The processing log shows errors that occur when your SQL statements are processed. You can query it like any other stream. For more information, see Processing log
Click Persistent queries to inspect the streams and tables that you’ve created.
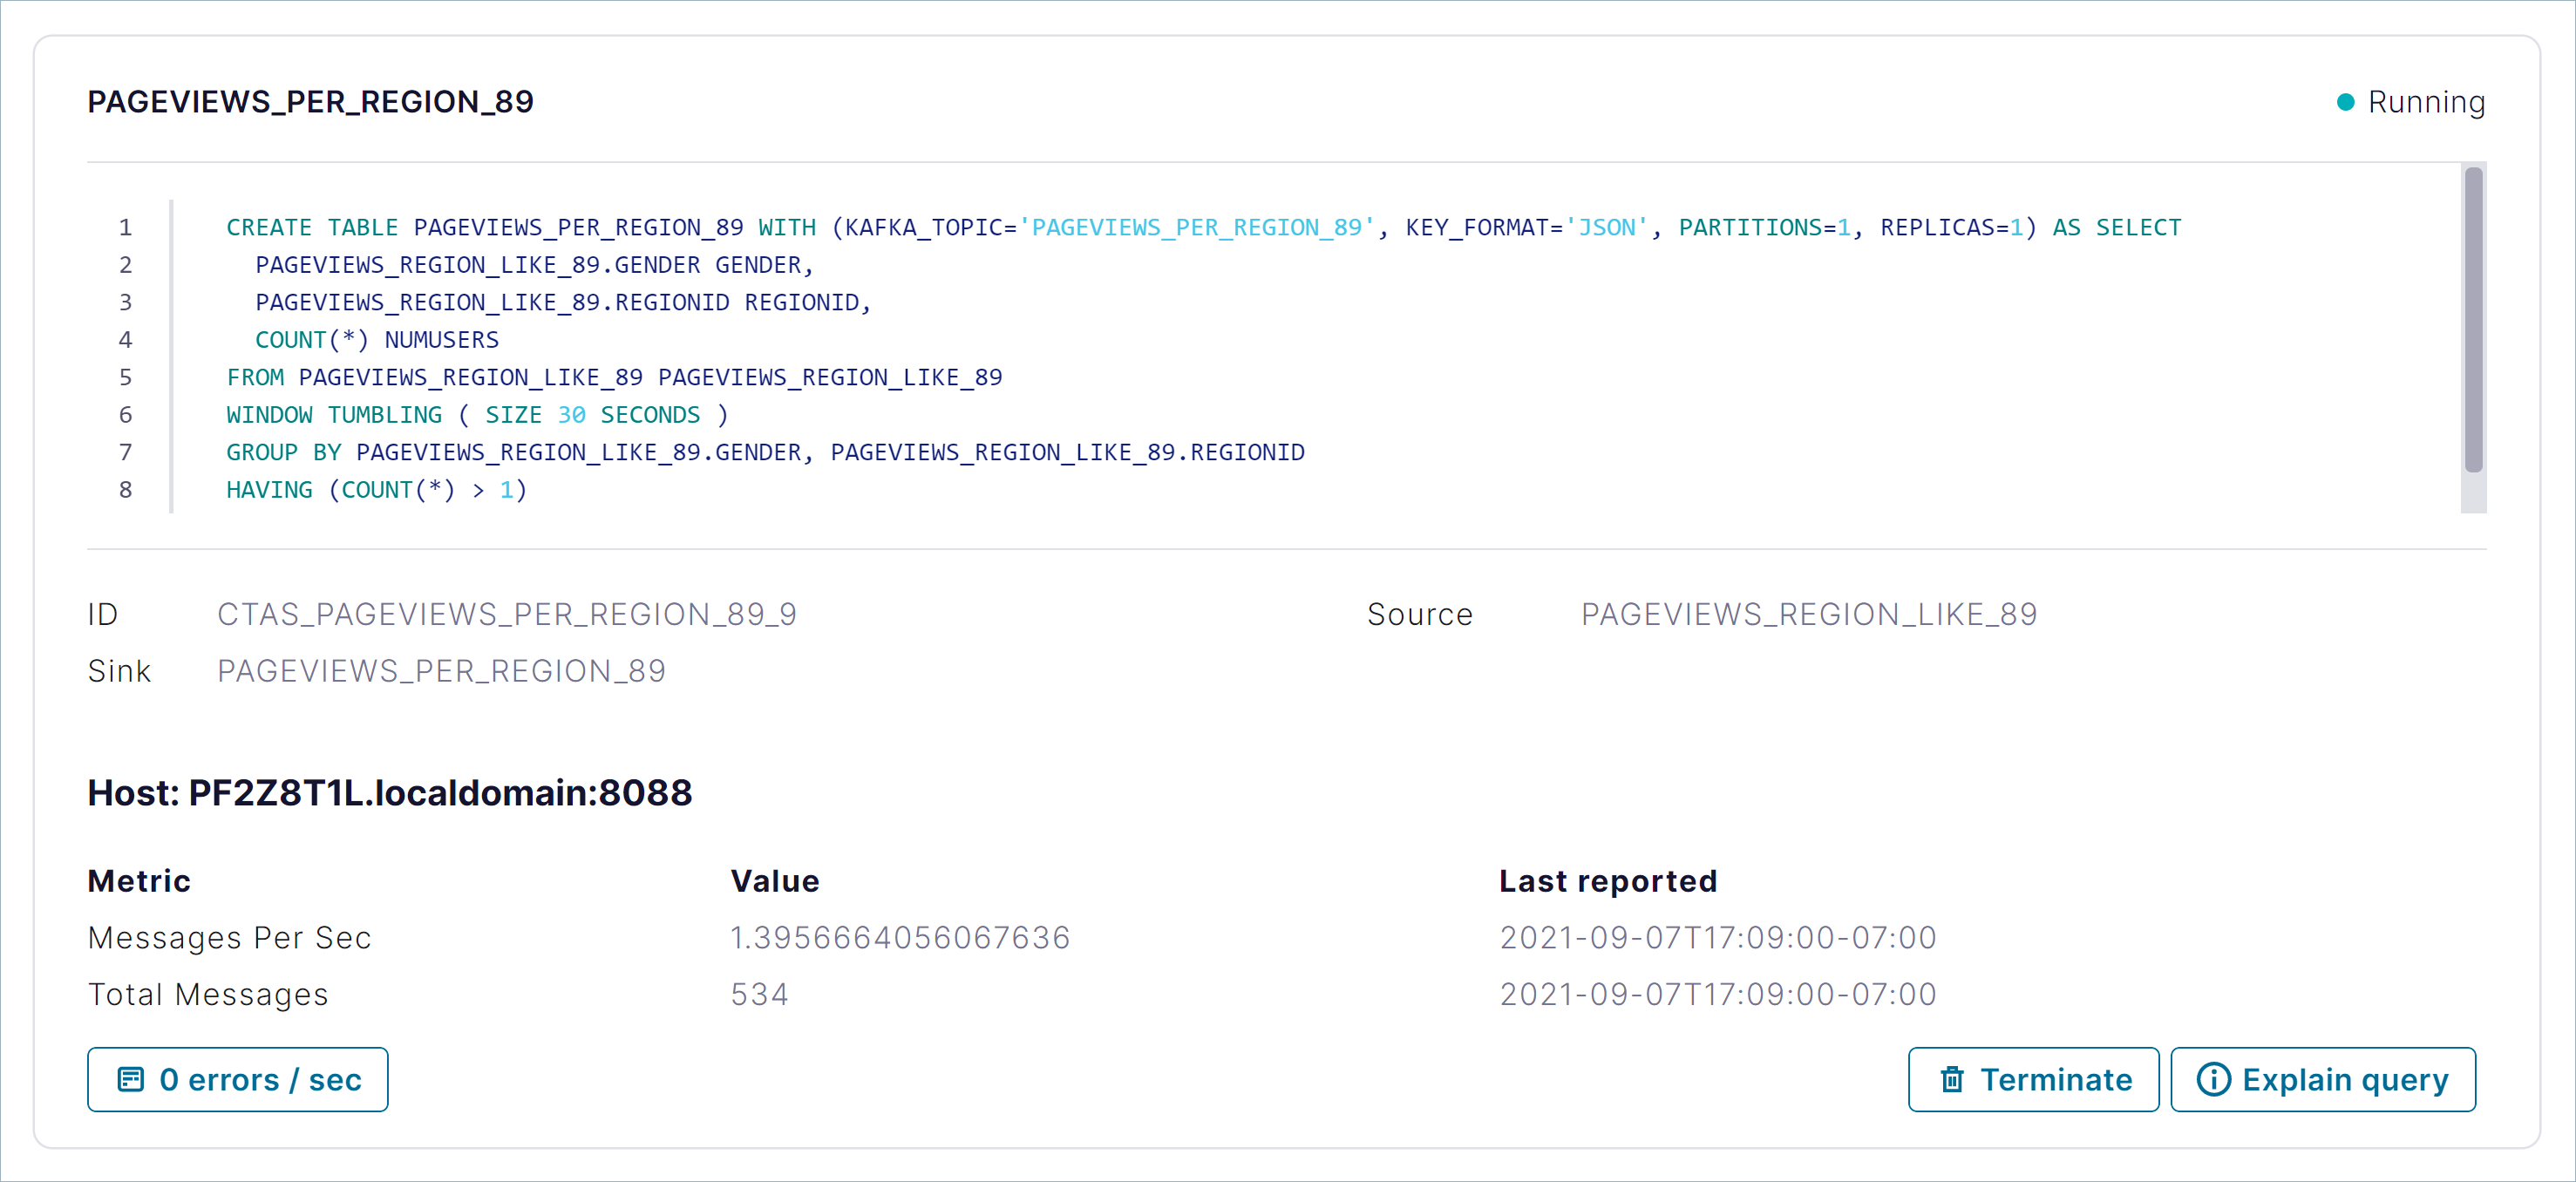
Use this page to check whether your queries are running, to explain a query, and to terminate running queries.
Step 5: Visualize your app’s stream topology
In the streaming application you’ve built, events flow from the Datagen connectors into the pageviews and users topics. Rows are processed with a join and filtered, and in the final step, rows are aggregated in a table view of the streaming data.
You can see an end-to-end view of the whole system by using Flow view.
Step 6: Uninstall and clean up
When you’re done exploring Confluent Platform, you can remove it easily to free storage and other system resources.
When you’re done working with Docker, you can stop and remove Docker containers and images.
Run the following command to stop the Docker containers for Confluent:
docker-compose stopAfter stopping the Docker containers, run the following commands to prune the Docker system. Running these commands deletes containers, networks, volumes, and images, freeing up disk space:
docker system prune -a --volumes --filter "label=io.confluent.docker"
For more information, refer to the official Docker documentation.
