Tutorial: Multi-Region Clusters
Overview
This tutorial describes the Multi-Region Clusters capability that is built directly into Confluent Server.
Multi-Region Clusters allow customers to run a single Apache Kafka® cluster across multiple datacenters. Often referred to as a stretch cluster, Multi-Region Clusters replicate data between datacenters across regional availability zones. You can choose how to replicate data, synchronously or asynchronously, on a per Kafka topic basis. It provides good durability guarantees and makes disaster recovery (DR) much easier.
Benefits:
Supports multi-site deployments of synchronous and asynchronous replication between datacenters
Consumers can leverage data locality for reading Kafka data, which means better performance and lower cost
Ordering of Kafka messages is preserved across datacenters
Consumer offsets are preserved
In event of a disaster in a datacenter, new leaders are automatically elected in the other datacenter for the topics configured for synchronous replication, and applications proceed without interruption, achieving very low RTOs and RPO=0 for those topics.
Concepts
Replicas are brokers assigned to a topic-partition, and they can be a Leader, Follower, or Observer. A Leader is the broker/replica accepting producer messages. A Follower is a broker/replica that can join an ISR list and participate in the calculation of the high watermark (used by the leader when acknowledging messages back to the producer).
An ISR list (in-sync replicas) includes brokers that have a given topic-partition. The data is copied from the leader to every member of the ISR before the producer gets an acknowledgment. The followers in an ISR can become the leader if the current leader fails.
An Observer is a broker/replica that also has a copy of data for a given topic-partition, and consumers are allowed to read from them even though the Observer isn’t the leader–this is known as “Follower Fetching”. However, the data is copied asynchronously from the leader such that a producer doesn’t wait on observers to get back an acknowledgment.

In “non-degraded” steady state, observers don’t participate in the ISR list and won’t become the leader. If a broker in the ISR fails, observers could be promoted to the ISR list in one of two ways: manual changes to leader assignment, or automatically with Automatic Observer Promotion. Automatic Observer Promotion is the process by which an observer is promoted into the ISR in certain “degraded” situations. The qualifications for whether an observer can be automatically promoted into the ISR is controlled by the observerPromotionPolicy field in a topic’s replica placement policy:
under-min-isr: if the number of replicas in the ISR drops below the topic’smin.insync.replicasconfiguration.under-replicated: if the number of replicas in the ISR ISR drops below the configured count of replicas in the topic’s replica placement policy.leader-is-observer: if the current partition leader is an observer.
Tip
For an in-depth explanation of these concepts and configurations, see Multi-Region Clusters.
Configuration
The scenario for this tutorial is as follows:
Three regions:
west,central, andeastBroker naming convention:
broker-[region]-[broker_id]
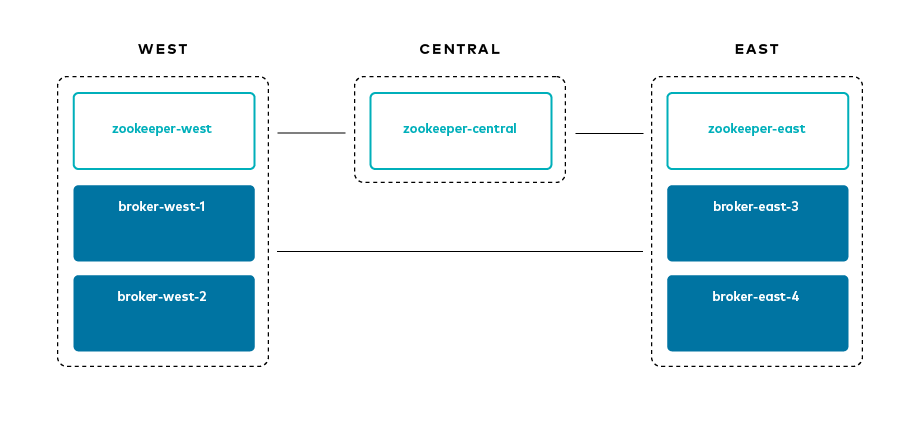
Note that this tutorial uses a dedicated Kafka cluster backing Confluent Control Center (Legacy), which monitors the multi-region cluster.
Here are some relevant configuration parameters at different component levels:
Broker
You can find full broker configurations in the docker-compose.yml file. The most important configuration parameters include:
broker.rack: identifies the location of the broker. For the example, it represents a region, eithereastorwestreplica.selector.class=org.apache.kafka.common.replica.RackAwareReplicaSelector: allows clients to read from followers (in contrast, clients are typically only allowed to read from leaders)confluent.log.placement.constraints: sets the default replica placement constraint configuration for newly created topics.confluent.metrics.reporter.bootstrap.serversandconfluent.monitoring.interceptor.bootstrap.servers: directs metrics to the dedicated metrics cluster.
Client
client.rack: identifies the location of the client. For the example, it represents a region, eithereastorwestreplication.factor: at the topic level, the replication factor is mutually exclusive to replica placement constraints, so for Kafka Streams applications, setreplication.factor=-1to let replica placement constraints take precedencemin.insync.replicas: durability guarantees are driven by replica placement andmin.insync.replicas. The number of followers in each region should be sufficient to meetmin.insync.replicas, for example, ifmin.insync.replicas=3, thenwestshould have 3 replicas andeastshould have 3 replicas.
Topic
--replica-placement <path-to-replica-placement-policy-json>: at topic creation, this argument defines the replica placement policy for a given topic
Prerequisites
Install Docker Desktop (version
4.0.0or later) or Docker Engine (version19.03.0or later) if you don’t already have it.Install the Docker Compose plugin if you don’t already have it. This isn’t necessary if you have Docker Desktop, since it includes Docker Compose.
Start Docker if it’s not already running, either by starting Docker Desktop or, if you manage Docker Engine with
systemd, via systemctl.Verify that Docker is set up properly by ensuring no errors are output when you run
docker infoanddocker compose versionon the command line.
Tip
Earlier versions of Docker did not include Docker Compose, so a separate (hyphenated) docker-compose CLI was required. If your local Docker installation does not support Docker Compose (docker compose version throws an error), then you can either upgrade Docker or install the Compose plugin as documented above; or, if you have the standalone docker-compose CLI installed and you don’t wish to modify your local Docker installation, then you can substitute docker-compose wherever docker compose is used in this tutorial.
Download and run the tutorial
Clone the confluentinc/examples GitHub repository, and check out the
7.4.14-postbranch.git clone https://github.com/confluentinc/examples
cd examples
git checkout 7.4.14-post
Go to the directory with the Multi-Region Clusters by running the following command:
cd multiregion
If you want to manually step through this tutorial, which is advised for new users who want to gain familiarity with Multi-Region Clusters, skip ahead to the next section.
Alternatively, you can run the full tutorial end-to-end with the following script, which automates all the steps in the tutorial:
./scripts/start.sh
The automated demo takes several minutes to run to completion and return your prompt. You can follow the progress by comparing the output with the workflow and code examples in the manual steps. Use Ctl-C if you want to stop the demo early.
Be sure to stop all services and clean up the Docker environment after running this script, as described in Stop the Tutorial and Teardown.
Startup
This Multi-Region Clusters example uses Traffic Control (
tc) to inject latency between the regions and packet loss to simulate the WAN link. Confluent’s ubi-based Docker images do not havetcinstalled, so build custom Docker images withtc../scripts/build_docker_images.sh
Start all the Docker containers
docker compose up -d
You should see the following Docker containers with
docker compose ps:Name Command State Ports ---------------------------------------------------------------------------------------------------------------- broker-ccc /etc/confluent/docker/run Up 0.0.0.0:8098->8098/tcp, 9092/tcp, 0.0.0.0:9098->9098/tcp broker-east-3 /etc/confluent/docker/run Up 0.0.0.0:8093->8093/tcp, 9092/tcp, 0.0.0.0:9093->9093/tcp broker-east-4 /etc/confluent/docker/run Up 0.0.0.0:8094->8094/tcp, 9092/tcp, 0.0.0.0:9094->9094/tcp broker-west-1 /etc/confluent/docker/run Up 0.0.0.0:8091->8091/tcp, 0.0.0.0:9091->9091/tcp, 9092/tcp broker-west-2 /etc/confluent/docker/run Up 0.0.0.0:8092->8092/tcp, 0.0.0.0:9092->9092/tcp control-center /etc/confluent/docker/run Up 0.0.0.0:9021->9021/tcp zookeeper-ccc /etc/confluent/docker/run Up 2181/tcp, 0.0.0.0:2188->2188/tcp, 2888/tcp, 3888/tcp zookeeper-central /etc/confluent/docker/run Up 2181/tcp, 0.0.0.0:2182->2182/tcp, 2888/tcp, 3888/tcp zookeeper-east /etc/confluent/docker/run Up 2181/tcp, 0.0.0.0:2183->2183/tcp, 2888/tcp, 3888/tcp zookeeper-west /etc/confluent/docker/run Up 0.0.0.0:2181->2181/tcp, 2888/tcp, 3888/tcp
Inject latency and packet loss
Here is a diagram of the simulated latency between the regions and the WAN link.
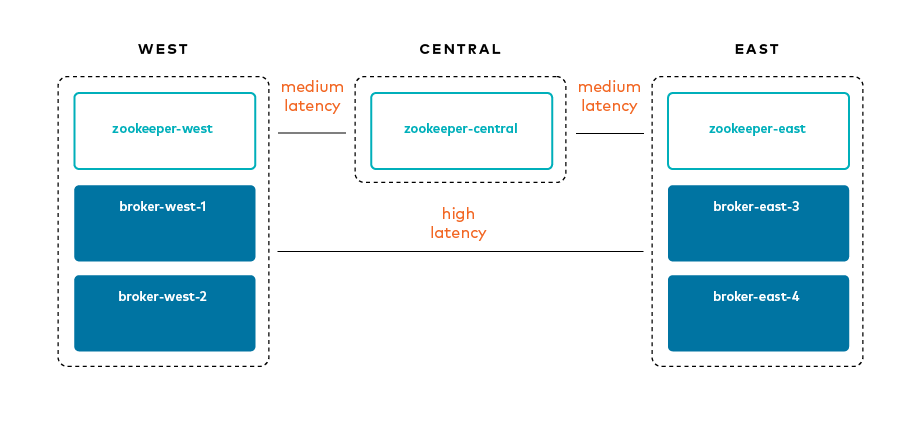
View the IP addresses used by Docker for the example:
docker inspect -f '{{.Name}} - {{range .NetworkSettings.Networks}}{{.IPAddress}}{{end}}' $(docker ps -aq)Run the script latency_docker.sh that configures
tcon the Docker containers:./scripts/latency_docker.sh
Replica Placement
This tutorial demonstrates the principles of Multi-Region Clusters through various topics.
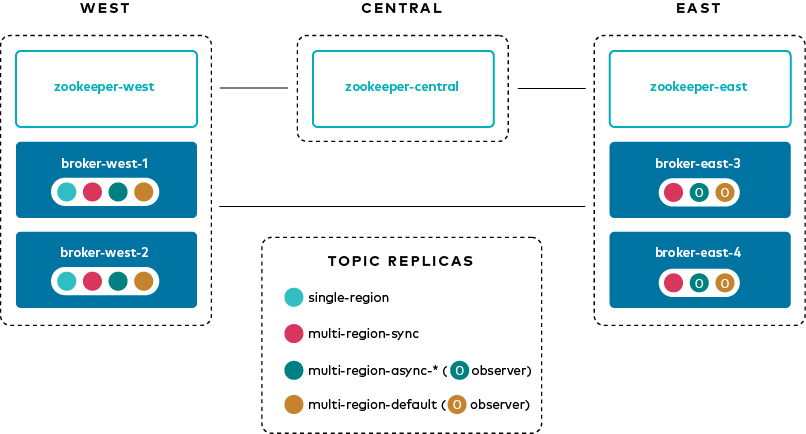
Each topic has a replica placement policy that specifies a set of matching constraints (for example, count and rack for replicas and observers). The replica placement policy file is defined with the argument --replica-placement <path-to-replica-placement-policy-json> mentioned earlier (these files are in the config directory). Each placement also has an associated minimum count that guarantees a certain spread of replicas throughout the cluster.
In this tutorial, you will create the following topics. You could create all the topics by running the script create-topics.sh, but we will step through each topic creation to demonstrate the required arguments.
Topic name | Leader | Followers (sync replicas) | Observers (async replicas) | ISR list | Use default placement constraints | Observer Promotion policy |
|---|---|---|---|---|---|---|
single-region | 1x west | 1x west | n/a | {1,2} | no | none |
multi-region-sync | 1x west | 1x west, 2x east | n/a | {1,2,3,4} | no | none |
multi-region-async | 1x west | 1x west | 2x east | {1,2} | no | none |
multi-region-async-op-under-min-isr | 1x west | 1x west | 2x east | {1,2} | no | under-min-isr |
multi-region-async-op-under-replicated | 1x west | 1x west | 2x east | {1,2} | no | under-replicated |
multi-region-async-op-leader-is-observer | 1x west | 1x west | 2x east | {1,2} | no | leader-is-observer |
multi-region-default | 1x west | 1x west | 2x east | {1,2} | yes | none |
Create the Kafka topic
single-region.docker compose exec broker-west-1 kafka-topics --create \ --bootstrap-server broker-west-1:19091 \ --topic single-region \ --partitions 1 \ --replica-placement /etc/kafka/demo/placement-single-region.json \ --config min.insync.replicas=1
Here is the topic’s replica placement policy placement-single-region.json:
{
    "version": 1,
    "replicas": [
        {
            "count": 2,
            "constraints": {
                "rack": "west"
            }
        }
    ]
}
Create the Kafka topic
multi-region-sync.docker compose exec broker-west-1 kafka-topics --create \ --bootstrap-server broker-west-1:19091 \ --topic multi-region-sync \ --partitions 1 \ --replica-placement /etc/kafka/demo/placement-multi-region-sync.json \ --config min.insync.replicas=1
Here is the topic’s replica placement policy placement-multi-region-sync.json:
{
    "version": 1,
    "replicas": [
        {
            "count": 2,
            "constraints": {
                "rack": "west"
            }
        },
        {
            "count": 2,
            "constraints": {
                "rack": "east"
            }
        }
    ]
}
Create the Kafka topic
multi-region-async.docker compose exec broker-west-1 kafka-topics --create \ --bootstrap-server broker-west-1:19091 \ --topic multi-region-async \ --partitions 1 \ --replica-placement /etc/kafka/demo/placement-multi-region-async.json \ --config min.insync.replicas=1
Here is the topic’s replica placement policy placement-multi-region-async.json:
{
    "version": 1,
    "replicas": [
        {
            "count": 2,
            "constraints": {
                "rack": "west"
            }
        }
    ],
    "observers": [
        {
        "count": 2,
            "constraints": {
                "rack": "east"
            }
        }
    ]
}
Create the Kafka topic
multi-region-async-op-under-min-isr.docker compose exec broker-west-1 kafka-topics \ --create \ --bootstrap-server broker-west-1:19091 \ --topic multi-region-async-op-under-min-isr \ --partitions 1 \ --replica-placement /etc/kafka/demo/placement-multi-region-async-op-under-min-isr.json \ --config min.insync.replicas=2
Here is the topic’s replica placement policy placement-multi-region-async-op-under-min-isr.json:
{
    "version": 2,
    "replicas": [
        {
            "count": 2,
            "constraints": {
                "rack": "west"
            }
        }
    ],
    "observers": [
        {
            "count": 2,
            "constraints": {
                "rack": "east"
            }
        }
    ],
    "observerPromotionPolicy":"under-min-isr"
}
Create the Kafka topic
multi-region-async-op-under-replicated.docker compose exec broker-west-1 kafka-topics \ --create \ --bootstrap-server broker-west-1:19091 \ --topic multi-region-async-op-under-replicated \ --partitions 1 \ --replica-placement /etc/kafka/demo/placement-multi-region-async-op-under-replicated.json \ --config min.insync.replicas=1
Here is the topic’s replica placement policy placement-multi-region-async-op-under-replicated.json:
{
  "version": 2,
  "replicas": [
    {
      "count": 2,
      "constraints": {
        "rack": "west"
      }
    }
  ],
  "observers": [
    {
      "count": 2,
      "constraints": {
        "rack": "east"
      }
    }
  ],
  "observerPromotionPolicy":"under-replicated"
}
Create the Kafka topic
multi-region-async-op-leader-is-observer.docker compose exec broker-west-1 kafka-topics \ --create \ --bootstrap-server broker-west-1:19091 \ --topic multi-region-async-op-leader-is-observer \ --partitions 1 \ --replica-placement /etc/kafka/demo/placement-multi-region-async-op-leader-is-observer.json \ --config min.insync.replicas=1
Here is the topic’s replica placement policy placement-multi-region-async-op-leader-is-observer.json:
{
  "version": 2,
  "replicas": [
    {
      "count": 2,
      "constraints": {
        "rack": "west"
      }
    }
  ],
  "observers": [
    {
      "count": 2,
      "constraints": {
        "rack": "east"
      }
    }
  ],
  "observerPromotionPolicy":"leader-is-observer"
}
Create the Kafka topic
multi-region-default. Note that the--replica-placementargument is not used in order to demonstrate the default placement constraints.docker compose exec broker-west-1 kafka-topics \ --create \ --bootstrap-server broker-west-1:19091 \ --topic multi-region-default \ --config min.insync.replicas=1
View the topic replica placement by running the script describe-topics.sh:
./scripts/describe-topics.sh
You should see output similar to the following:
==> Describe topic: single-region

Topic: single-region    PartitionCount: 1   ReplicationFactor: 2    Configs: min.insync.replicas=1,confluent.placement.constraints={"version":1,"replicas":[{"count":2,"constraints":{"rack":"west"}}],"observers":[]}
   Topic: single-region    Partition: 0    Leader: 2   Replicas: 2,1   Isr: 2,1    Offline:

==> Describe topic: multi-region-sync

Topic: multi-region-sync    PartitionCount: 1   ReplicationFactor: 4    Configs: min.insync.replicas=1,confluent.placement.constraints={"version":1,"replicas":[{"count":2,"constraints":{"rack":"west"}},{"count":2,"constraints":{"rack":"east"}}],"observers":[]}
   Topic: multi-region-sync    Partition: 0    Leader: 1   Replicas: 1,2,3,4   Isr: 1,2,3,4    Offline:

==> Describe topic: multi-region-async

Topic: multi-region-async   PartitionCount: 1   ReplicationFactor: 4    Configs: min.insync.replicas=1,confluent.placement.constraints={"version":1,"replicas":[{"count":2,"constraints":{"rack":"west"}}],"observers":[{"count":2,"constraints":{"rack":"east"}}]}
   Topic: multi-region-async   Partition: 0    Leader: 2   Replicas: 2,1,3,4   Isr: 2,1    Offline:    Observers: 3,4

==> Describe topic: multi-region-async-op-under-min-isr

Topic: multi-region-async-op-under-min-isr     PartitionCount: 1       ReplicationFactor: 4    Configs: min.insync.replicas=2,confluent.placement.constraints={"observerPromotionPolicy":"under-min-isr","version":2,"replicas":[{"count":2,"constraints":{"rack":"west"}}],"observers":[{"count":2,"constraints":{"rack":"east"}}]}
       Topic: multi-region-async-op-under-min-isr      Partition: 0    Leader: 2       Replicas: 2,1,3,4       Isr: 2,1        Offline:        Observers: 3,4

==> Describe topic: multi-region-async-op-under-replicated

Topic: multi-region-async-op-under-replicated  PartitionCount: 1       ReplicationFactor: 4    Configs: min.insync.replicas=1,confluent.placement.constraints={"observerPromotionPolicy":"under-replicated","version":2,"replicas":[{"count":2,"constraints":{"rack":"west"}}],"observers":[{"count":2,"constraints":{"rack":"east"}}]}
       Topic: multi-region-async-op-under-replicated   Partition: 0    Leader: 2       Replicas: 2,1,3,4       Isr: 2,1        Offline:        Observers: 3,4

==> Describe topic: multi-region-async-op-leader-is-observer

Topic: multi-region-async-op-leader-is-observer        PartitionCount: 1       ReplicationFactor: 4    Configs: min.insync.replicas=1,confluent.placement.constraints={"observerPromotionPolicy":"leader-is-observer","version":2,"replicas":[{"count":2,"constraints":{"rack":"west"}}],"observers":[{"count":2,"constraints":{"rack":"east"}}]}
       Topic: multi-region-async-op-leader-is-observer Partition: 0    Leader: 2       Replicas: 2,1,3,4       Isr: 2,1        Offline:        Observers: 3,4

==> Describe topic: multi-region-default

Topic: multi-region-default PartitionCount: 1   ReplicationFactor: 4    Configs: min.insync.replicas=1,confluent.placement.constraints={"version":1,"replicas":[{"count":2,"constraints":{"rack":"west"}}],"observers":[{"count":2,"constraints":{"rack":"east"}}]}
   Topic: multi-region-default Partition: 0    Leader: 2   Replicas: 2,1,3,4   Isr: 2,1    Offline:    Observers: 3,4
View the topic replica placement in Confluent Control Center (Legacy):
Navigate to the Confluent Control Center (Legacy) UI at http://localhost:9021.
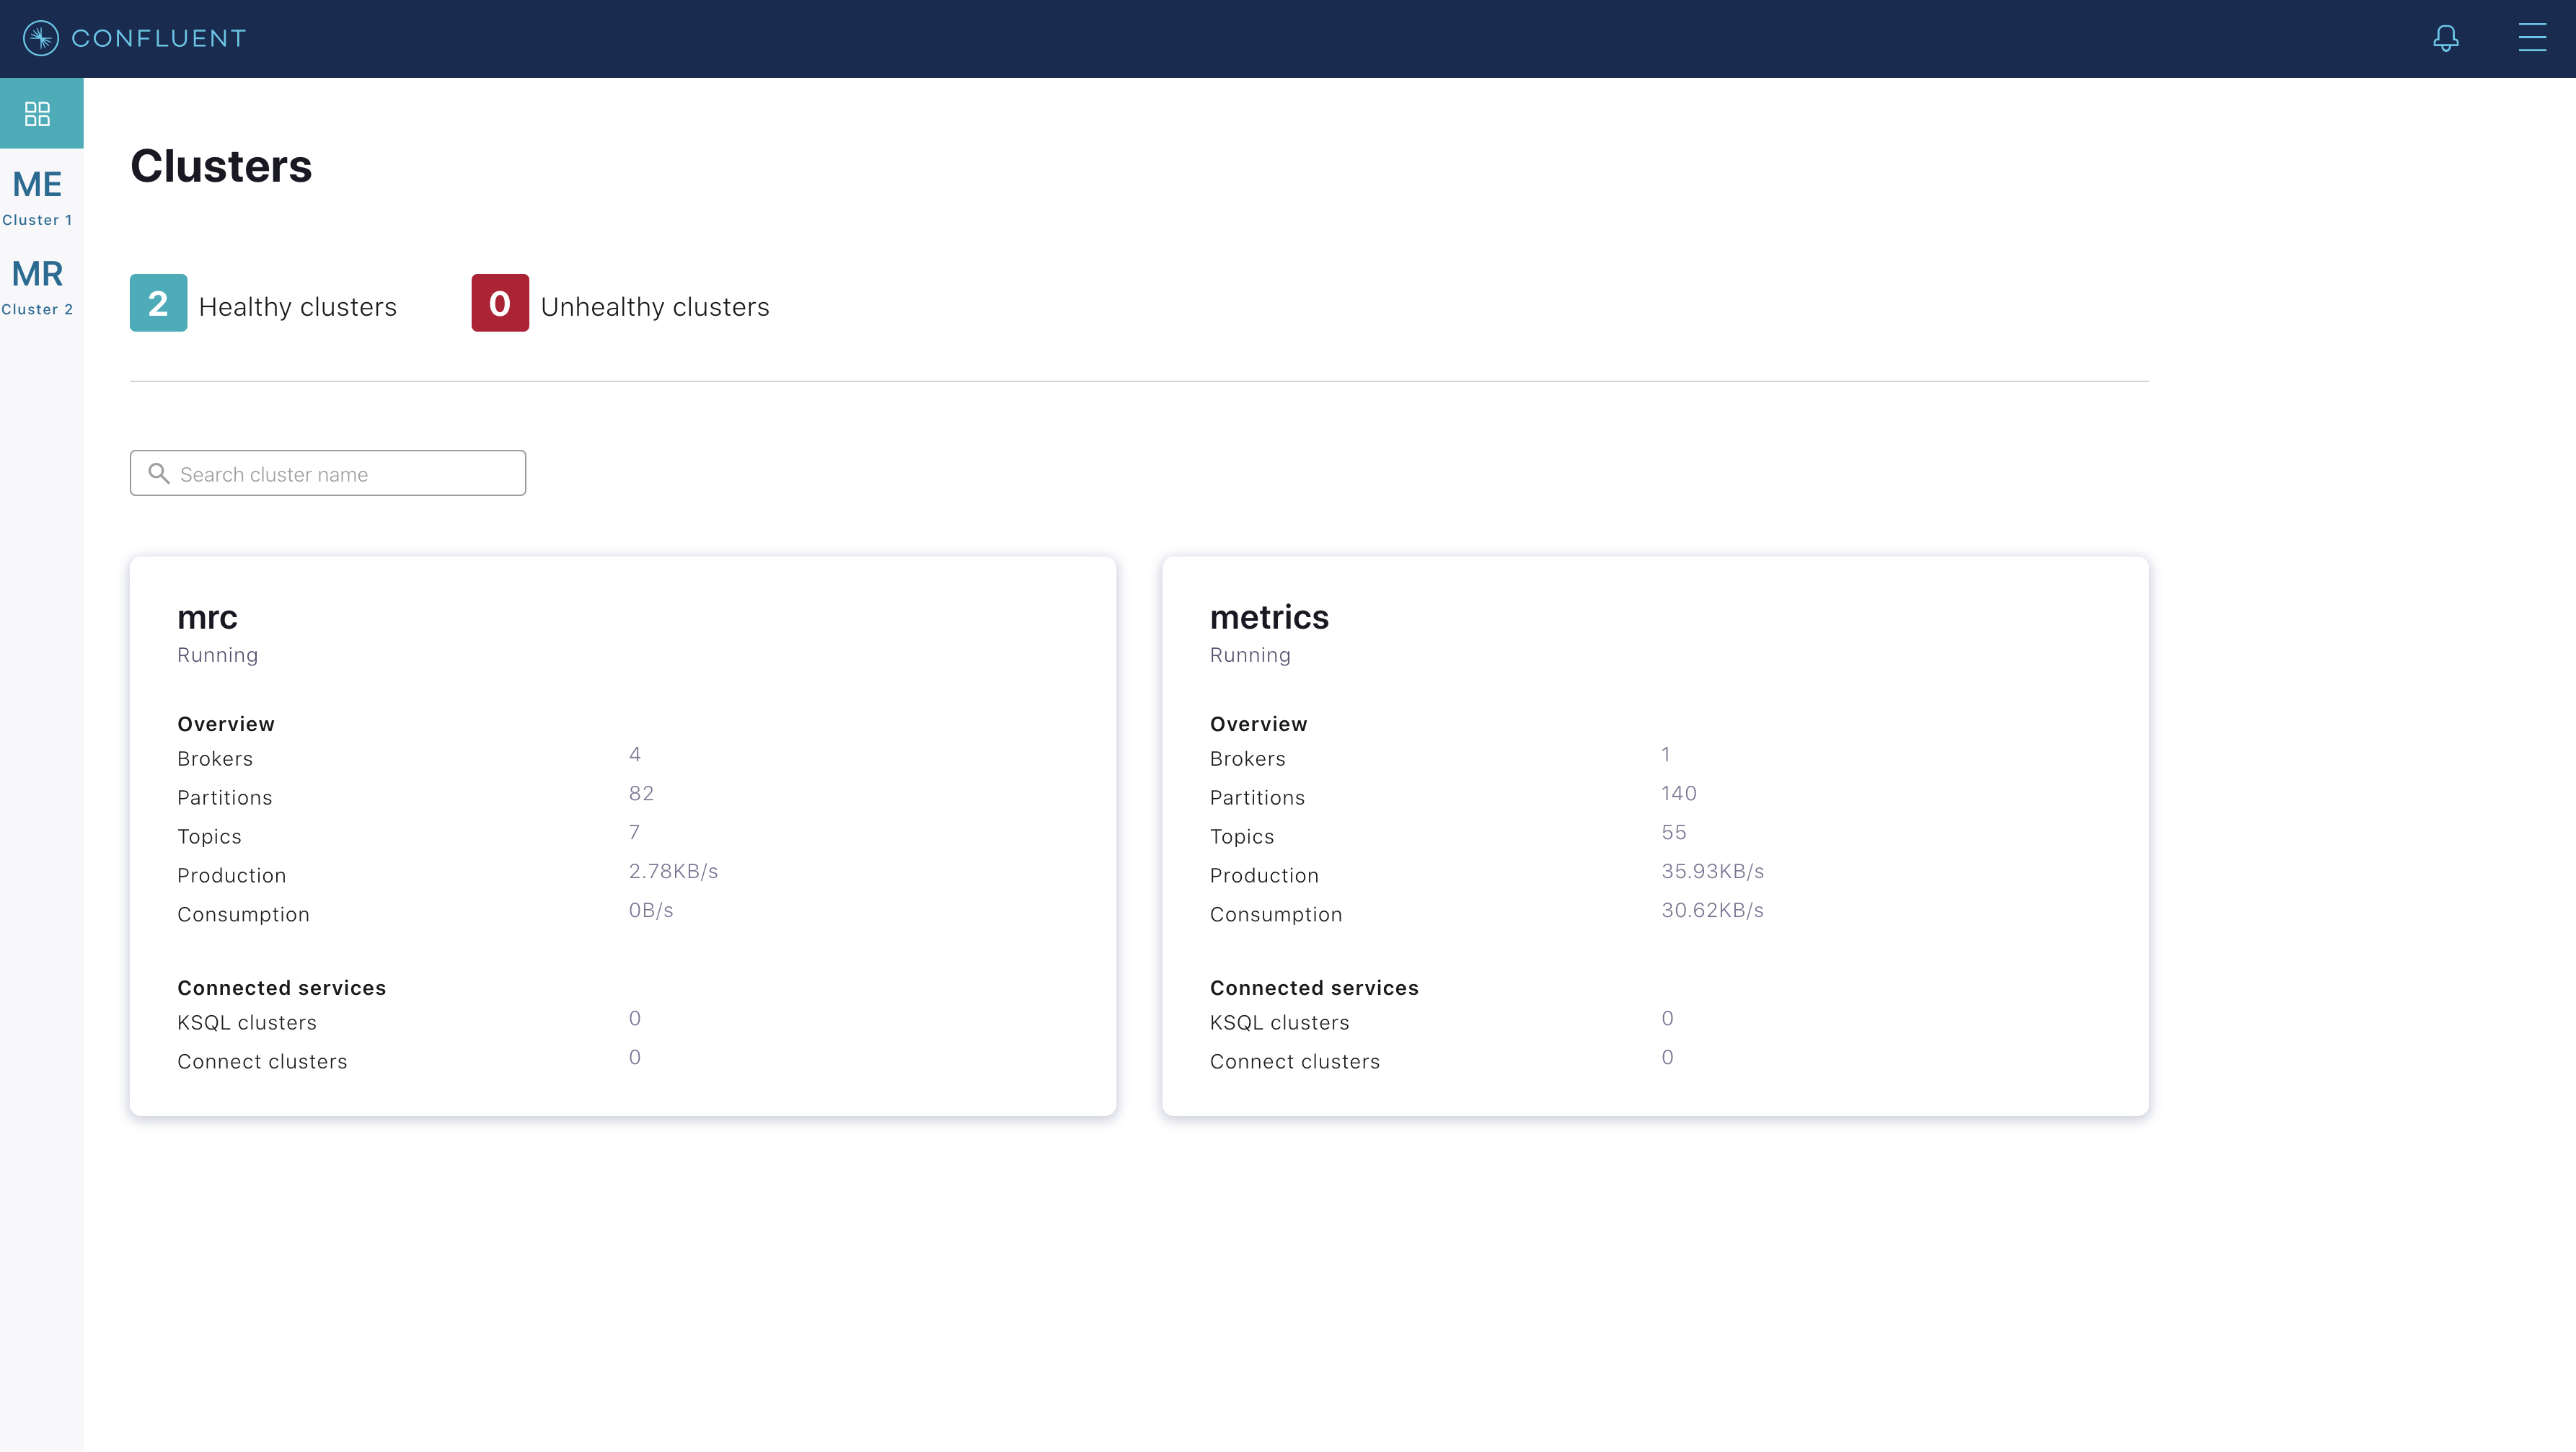
Notice two clusters: “mrc” which is the multiregion cluster, and “metrics” which is a dedicated metrics cluster that runs Confluent Control Center (Legacy). By backing Confluent Control Center (Legacy) to its own Kafka cluster, it has no dependency on the availability of the production cluster it is monitoring. The remainder of this tutorial works on topics within the “mrc” cluster. Click on the “mrc” cluster, then make your way to the “Topics” section.
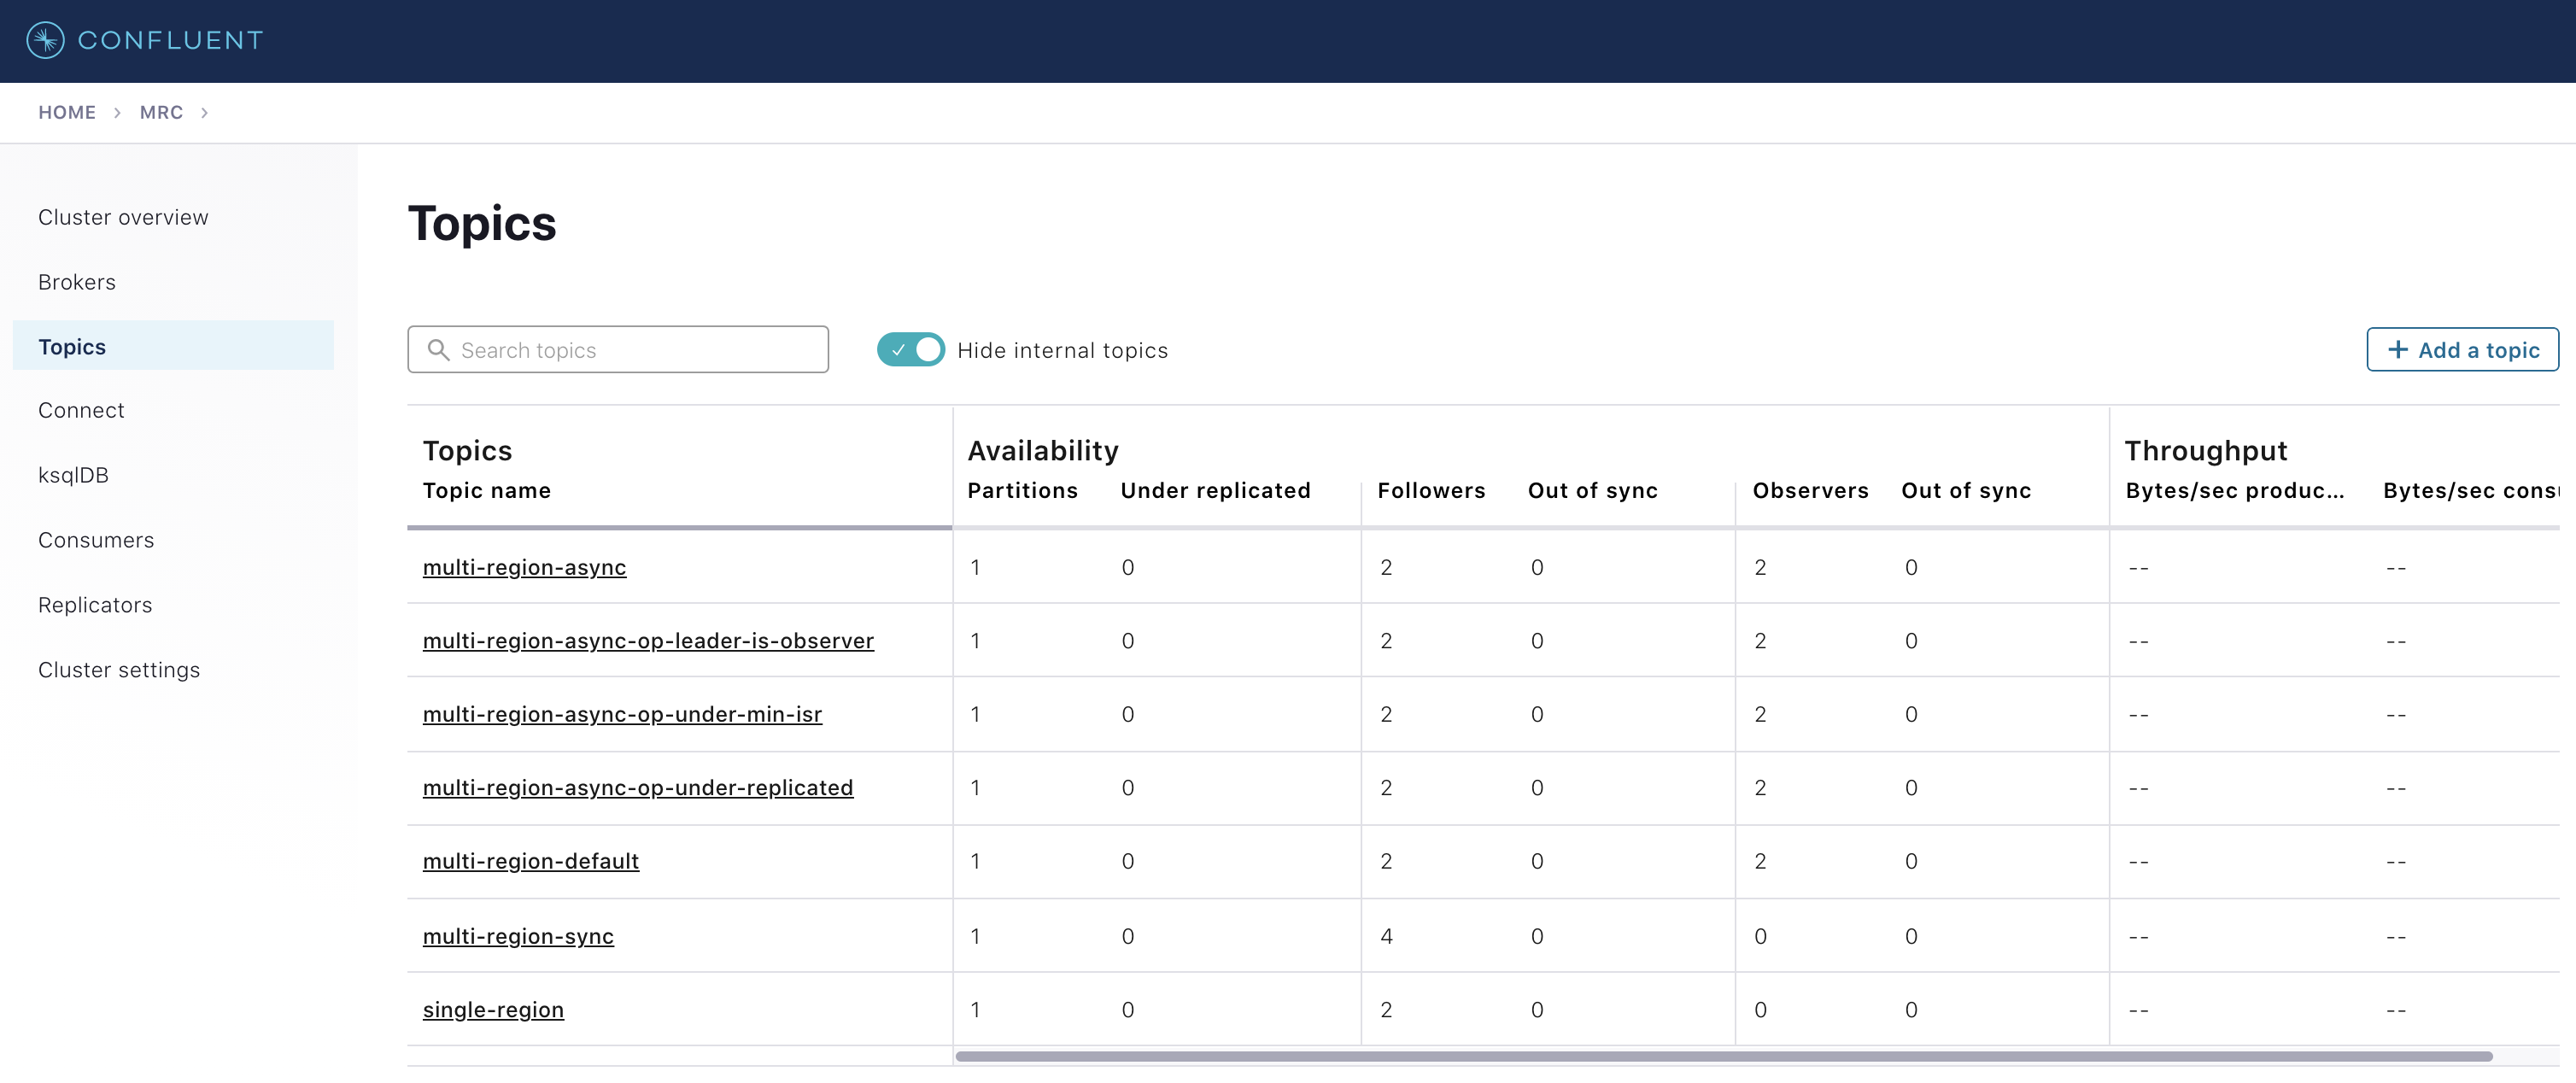
Click on each topic to see details about the replica and observer placement. Confluent Control Center (Legacy) matches the CLI output above. Below is an example of the
multi-region-asynctopic.Observe the following:
The
multi-region-async,multi-region-async-op-under-min-isr,multi-region-async-op-under-replicated,multi-region-async-op-leader-is-observerandmulti-region-defaulttopics have replicas acrosswestandeastregions, but only 1 and 2 are in the ISR, and 3 and 4 are observers. This can be observed via the CLI output or Confluent Control Center (Legacy).
Client Performance
Producer
Run the producer perf test script run-producer.sh:
./scripts/run-producer.sh
Verify that you see performance results similar to the following:
==> Produce: Single-region Replication (topic: single-region)
5000 records sent, 240.453977 records/sec (1.15 MB/sec), 10766.48 ms avg latency, 17045.00 ms max latency, 11668 ms 50th, 16596 ms 95th, 16941 ms 99th, 17036 ms 99.9th.

==> Produce: Multi-region Sync Replication (topic: multi-region-sync)
100 records sent, 2.145923 records/sec (0.01 MB/sec), 34018.18 ms avg latency, 45705.00 ms max latency, 34772 ms 50th, 44815 ms 95th, 45705 ms 99th, 45705 ms 99.9th.

==> Produce: Multi-region Async Replication to Observers (topic: multi-region-async)
5000 records sent, 228.258388 records/sec (1.09 MB/sec), 11296.69 ms avg latency, 18325.00 ms max latency, 11866 ms 50th, 17937 ms 95th, 18238 ms 99th, 18316 ms 99.9th.
Observe the following:
In the first and third cases, the
single-regionandmulti-region-asynctopics have nearly the same throughput performance (for examples,1.15 MB/secand1.09 MB/sec, respectively, in the previous example), because only the replicas in thewestregion need to acknowledge.In the second case for the
multi-region-synctopic, due to the poor network bandwidth between theeastandwestregions and to an ISR made up of brokers in both regions, it took a big throughput hit (for example,0.01 MB/secin the previous example). This is because the producer is waiting for anackfrom all members of the ISR before continuing, including those inwestandeast.The observers in the third case for topic
multi-region-asyncdidn’t affect the overall producer throughput because thewestregion is sending anackback to the producer after it has been replicated twice in thewestregion, and it is not waiting for the async copy to theeastregion.This example doesn’t produce to
multi-region-defaultbecause the behavior is the same asmulti-region-asyncsince the configuration is the same.
Consumer
Run the consumer perf test script run-consumer.sh, where the consumer is in
east:./scripts/run-consumer.sh
Verify that you see performance results similar to the following:
==> Consume from east: Multi-region Async Replication reading from Leader in west (topic: multi-region-async)

start.time, end.time, data.consumed.in.MB, MB.sec, data.consumed.in.nMsg, nMsg.sec, rebalance.time.ms, fetch.time.ms, fetch.MB.sec, fetch.nMsg.sec
2019-09-25 17:10:27:266, 2019-09-25 17:10:53:683, 23.8419, 0.9025, 5000, 189.2721, 1569431435702, -1569431409285, -0.0000, -0.0000


==> Consume from east: Multi-region Async Replication reading from Observer in east (topic: multi-region-async)

start.time, end.time, data.consumed.in.MB, MB.sec, data.consumed.in.nMsg, nMsg.sec, rebalance.time.ms, fetch.time.ms, fetch.MB.sec, fetch.nMsg.sec
2019-09-25 17:10:56:844, 2019-09-25 17:11:02:902, 23.8419, 3.9356, 5000, 825.3549, 1569431461383, -1569431455325, -0.0000, -0.0000
Observe the following:
In the first scenario, the consumer running in
eastreads from the leader inwestand is impacted by the low bandwidth betweeneastandwest. The throughput is lower in this case (for example,0.9025MB per sec in the previous example).In the second scenario, the consumer running in
eastreads from the follower that is also ineast–the throughput of the consumer is higher in this case (for example,3.9356MBps in the previous example).This example doesn’t consume from
multi-region-defaultas the behavior should be the same asmulti-region-asyncsince the configuration is the same.
Monitoring
In Confluent Server there are a few JMX metrics you should monitor for determining the health and state of a topic partition. The tutorial describes the following JMX metrics. For a description of other relevant JMX metrics, see Metrics.
ReplicasCount- In JMX the full object name iskafka.cluster:type=Partition,name=ReplicasCount,topic=<topic-name>,partition=<partition-id>. It reports the number of replicas (sync replicas and observers) assigned to the topic partition.InSyncReplicasCount- In JMX the full object name iskafka.cluster:type=Partition,name=InSyncReplicasCount,topic=<topic-name>,partition=<partition-id>. It reports the number of replicas in the ISR.CaughtUpReplicasCount- In JMX the full object name iskafka.cluster:type=Partition,name=CaughtUpReplicasCount,topic=<topic-name>,partition=<partition-id>. It reports the number of replicas that are consider caught up to the topic partition leader. Note that this may be greater than the size of the ISR as observers may be caught up but are not part of ISR.ObserversInIsrCount- In JMX the full object name iskafka.cluster:type=Partition,name=ObserversInIsrCount,topic=<topic-name>,partition=<partition-id>. It reports the number of observers that are currently promoted to the ISR.
There is a script you can run to collect the JMX metrics from the command line, but the general form is:
docker compose exec broker-west-1 kafka-run-class kafka.tools.JmxTool --jmx-url service:jmx:rmi:///jndi/rmi://localhost:8091/jmxrmi --object-name kafka.cluster:type=Partition,name=<METRIC>,topic=<TOPIC>,partition=0 --one-time true
Run the script jmx_metrics.sh to get the JMX metrics for
ReplicasCount,InSyncReplicasCount,CaughtUpReplicasCount, andObserversInIsrCountfrom each of the brokers:./scripts/jmx_metrics.sh
Verify you see output similar to the following:
==> JMX metric: ReplicasCount

single-region: 2
multi-region-sync: 4
multi-region-async: 4
multi-region-async-op-under-min-isr: 4
multi-region-async-op-under-replicated: 4
multi-region-async-op-leader-is-observer: 4
multi-region-default: 4


==> JMX metric: InSyncReplicasCount

single-region: 2
multi-region-sync: 4
multi-region-async: 2
multi-region-async-op-under-min-isr: 2
multi-region-async-op-under-replicated: 2
multi-region-async-op-leader-is-observer: 2
multi-region-default: 2


==> JMX metric: CaughtUpReplicasCount

single-region: 2
multi-region-sync: 4
multi-region-async: 4
multi-region-async-op-under-min-isr: 4
multi-region-async-op-under-replicated: 4
multi-region-async-op-leader-is-observer: 4
multi-region-default: 4

==> JMX metric: ObserversInIsrCount

single-region: 0
multi-region-sync: 0
multi-region-async: 0
multi-region-async-op-under-min-isr: 0
multi-region-async-op-under-replicated: 0
multi-region-async-op-leader-is-observer: 0
multi-region-default: 0
Degraded Region
In this section, you will simulate a single broker failure in the west region.
Run the following command to stop one of the broker Docker containers in the
westregion:docker compose stop broker-west-1
Verify the new topic replica placement by running the script describe-topics.sh:
./scripts/describe-topics.sh
You should see output similar to the following:
==> Describe topic: single-region

Topic: single-region      PartitionCount: 1       ReplicationFactor: 2    Configs: min.insync.replicas=1,confluent.placement.constraints={"version":1,"replicas":[{"count":2,"constraints":{"rack":"west"}}],"observers":[]}
  Topic: single-region    Partition: 0    Leader: 2       Replicas: 1,2   Isr: 2  Offline: 1

==> Describe topic: multi-region-sync

Topic: multi-region-sync  PartitionCount: 1       ReplicationFactor: 4    Configs: min.insync.replicas=1,confluent.placement.constraints={"version":1,"replicas":[{"count":2,"constraints":{"rack":"west"}},{"count":2,"constraints":{"rack":"east"}}],"observers":[]}
  Topic: multi-region-sync        Partition: 0    Leader: 2       Replicas: 1,2,3,4       Isr: 2,3,4      Offline: 1

==> Describe topic: multi-region-async

Topic: multi-region-async PartitionCount: 1       ReplicationFactor: 4    Configs: min.insync.replicas=1,confluent.placement.constraints={"version":1,"replicas":[{"count":2,"constraints":{"rack":"west"}}],"observers":[{"count":2,"constraints":{"rack":"east"}}]}
  Topic: multi-region-async       Partition: 0    Leader: 2       Replicas: 1,2,4,3       Isr: 2  Offline: 1      Observers: 4,3

==> Describe topic: multi-region-async-op-under-min-isr

Topic: multi-region-async-op-under-min-isr        PartitionCount: 1       ReplicationFactor: 4    Configs: min.insync.replicas=2,confluent.placement.constraints={"observerPromotionPolicy":"under-min-isr","version":2,"replicas":[{"count":2,"constraints":{"rack":"west"}}],"observers":[{"count":2,"constraints":{"rack":"east"}}]}
  Topic: multi-region-async-op-under-min-isr      Partition: 0    Leader: 2       Replicas: 2,1,3,4       Isr: 2,4        Offline: 1      Observers: 3,4

==> Describe topic: multi-region-async-op-under-replicated

Topic: multi-region-async-op-under-replicated     PartitionCount: 1       ReplicationFactor: 4    Configs: min.insync.replicas=1,confluent.placement.constraints={"observerPromotionPolicy":"under-replicated","version":2,"replicas":[{"count":2,"constraints":{"rack":"west"}}],"observers":[{"count":2,"constraints":{"rack":"east"}}]}
  Topic: multi-region-async-op-under-replicated   Partition: 0    Leader: 2       Replicas: 2,1,3,4       Isr: 2,4        Offline: 1      Observers: 3,4

==> Describe topic: multi-region-async-op-leader-is-observer

Topic: multi-region-async-op-leader-is-observer   PartitionCount: 1       ReplicationFactor: 4    Configs: min.insync.replicas=1,confluent.placement.constraints={"observerPromotionPolicy":"leader-is-observer","version":2,"replicas":[{"count":2,"constraints":{"rack":"west"}}],"observers":[{"count":2,"constraints":{"rack":"east"}}]}
  Topic: multi-region-async-op-leader-is-observer Partition: 0    Leader: 2       Replicas: 2,1,3,4       Isr: 2  Offline: 1      Observers: 3,4

==> Describe topic: multi-region-default

Topic: multi-region-default       PartitionCount: 1       ReplicationFactor: 4    Configs: min.insync.replicas=1,confluent.placement.constraints={"version":1,"replicas":[{"count":2,"constraints":{"rack":"west"}}],"observers":[{"count":2,"constraints":{"rack":"east"}}]}
  Topic: multi-region-default     Partition: 0    Leader: 2       Replicas: 1,2,3,4       Isr: 2  Offline: 1      Observers: 3,4
Verify similar replica placement in Confluent Control Center (Legacy). Note that it may take up to 5 minutes it to properly report the new topic stats.
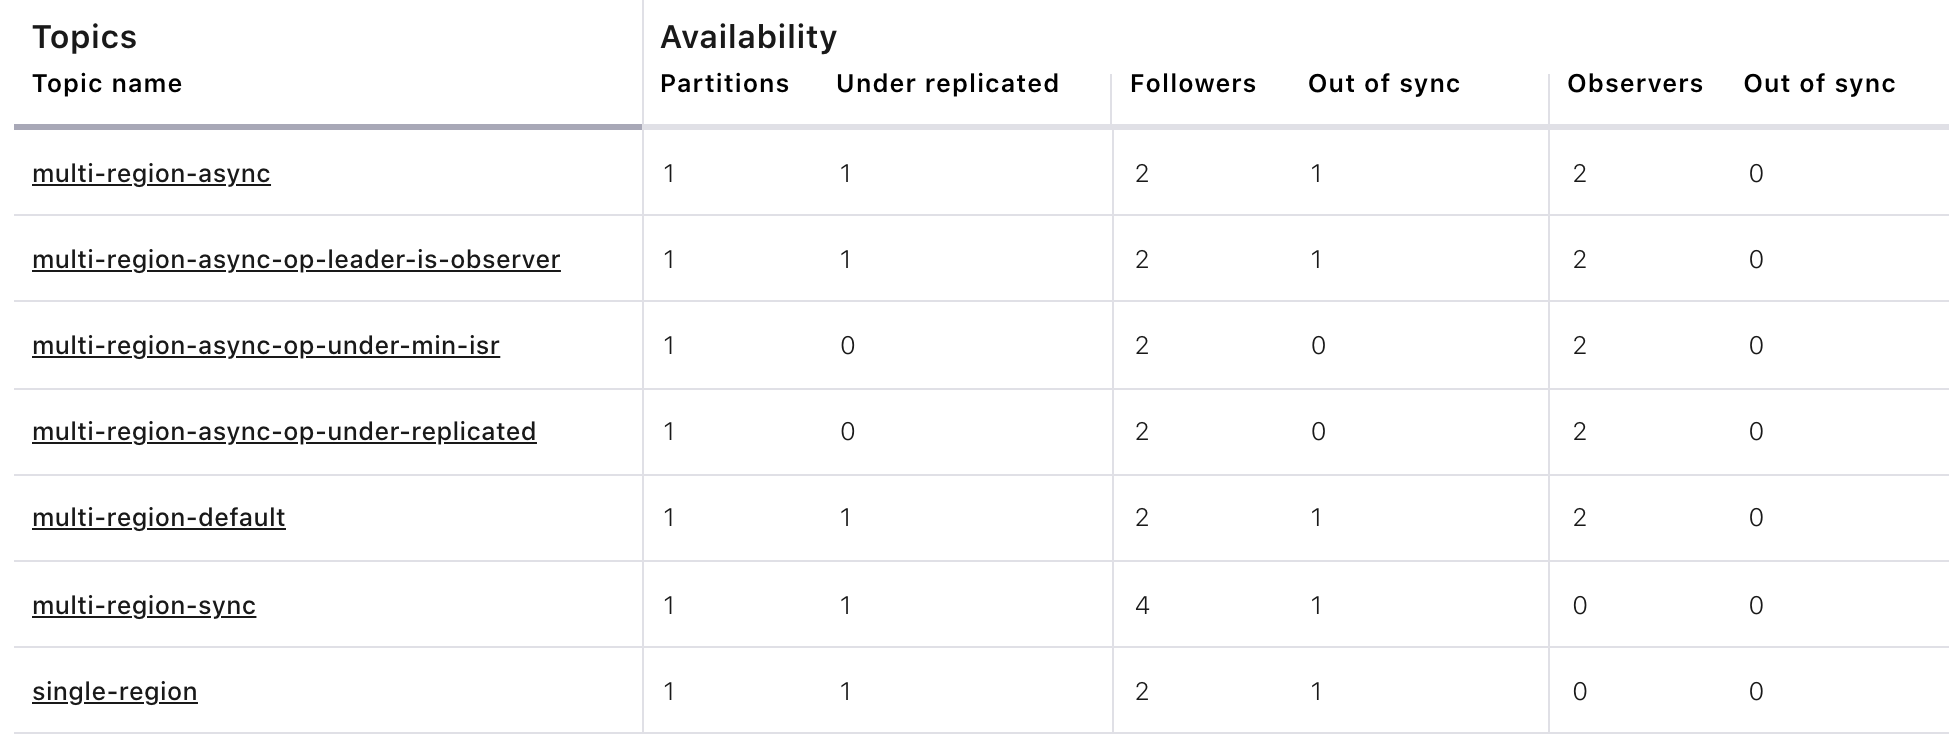
Observe the following:
In all topics except
multi-region-async-op-under-min-isr,multi-region-syncandmulti-region-async-op-under-replicatedthere is only 1 replica in the ISR. This is because replica placement dictated all replicas were in thewestregion which has only 1 remaining live broker.In the second scenario, the
multi-region-synctopic maintained an ISR of 3 brokers. This is because its placement policy always allows for brokers from east to join the ISR.The
multi-region-async-op-under-min-israndmulti-region-async-op-under-replicatedtopics have placement policies that allow observers to be automatically promoted into the ISR. In the case ofmulti-region-async-op-under-min-isrthe number of non-observer replicas (1) is less than themin.insync.replicasvalue (2). Observers are promoted to the ISR to meet themin.insync.replicasrequirement. In the case ofmulti-region-async-op-under-replicatedthe number of online replicas (1) is less than the intended number of non-observer replicas from the replica placement (2). An observer is promoted to fulfill this requirement.
Run the script jmx_metrics.sh to get the JMX metrics for
ReplicasCount,InSyncReplicasCount,CaughtUpReplicasCount, andObserversInIsrCountfrom each of the brokers:./scripts/jmx_metrics.sh
Verify you see output similar to the following:
==> JMX metric: ReplicasCount

single-region: 2
multi-region-sync: 4
multi-region-async: 4
multi-region-async-op-under-min-isr: 4
multi-region-async-op-under-replicated: 4
multi-region-async-op-leader-is-observer: 4
multi-region-default: 4


==> JMX metric: InSyncReplicasCount

single-region: 1
multi-region-sync: 3
multi-region-async: 1
multi-region-async-op-under-min-isr: 2
multi-region-async-op-under-replicated: 2
multi-region-async-op-leader-is-observer: 1
multi-region-default: 1


==> JMX metric: CaughtUpReplicasCount

single-region: 1
multi-region-sync: 4
multi-region-async: 3
multi-region-async-op-under-min-isr: 3
multi-region-async-op-under-replicated: 4
multi-region-async-op-leader-is-observer: 4
multi-region-default: 3


==> JMX metric: ObserversInIsrCount

single-region: 0
multi-region-sync: 0
multi-region-async: 0
multi-region-async-op-under-min-isr: 1
multi-region-async-op-under-replicated: 1
multi-region-async-op-leader-is-observer: 0
multi-region-default: 0
Failover
Fail Region
In this section, you will simulate a region failure by bringing down the west region.
Run the following command to stop the Docker containers corresponding to the
westregion:docker compose stop broker-west-1 broker-west-2 zookeeper-west
Verify the new topic replica placement by running the script describe-topics.sh:
./scripts/describe-topics.sh
You should see output similar to the following:
==> Describe topic: single-region

Topic: single-region    PartitionCount: 1   ReplicationFactor: 2    Configs: min.insync.replicas=1,confluent.placement.constraints={"version":1,"replicas":[{"count":2,"constraints":{"rack":"west"}}],"observers":[]}
   Topic: single-region    Partition: 0    Leader: none    Replicas: 2,1   Isr: 1  Offline: 2,1

==> Describe topic: multi-region-sync

Topic: multi-region-sync    PartitionCount: 1   ReplicationFactor: 4    Configs: min.insync.replicas=1,confluent.placement.constraints={"version":1,"replicas":[{"count":2,"constraints":{"rack":"west"}},{"count":2,"constraints":{"rack":"east"}}],"observers":[]}
   Topic: multi-region-sync    Partition: 0    Leader: 3   Replicas: 1,2,3,4   Isr: 3,4    Offline: 1,2

==> Describe topic: multi-region-async

Topic: multi-region-async   PartitionCount: 1   ReplicationFactor: 4    Configs: min.insync.replicas=1,confluent.placement.constraints={"version":1,"replicas":[{"count":2,"constraints":{"rack":"west"}}],"observers":[{"count":2,"constraints":{"rack":"east"}}]}
   Topic: multi-region-async   Partition: 0    Leader: none    Replicas: 2,1,3,4   Isr: 1  Offline: 2,1    Observers: 3,4

==> Describe topic: multi-region-async-op-under-min-isr

Topic: multi-region-async-op-under-min-isr        PartitionCount: 1       ReplicationFactor: 4    Configs: min.insync.replicas=2,confluent.placement.constraints={"observerPromotionPolicy":"under-min-isr","version":2,"replicas":[{"count":2,"constraints":{"rack":"west"}}],"observers":[{"count":2,"constraints":{"rack":"east"}}]}
  Topic: multi-region-async-op-under-min-isr      Partition: 0    Leader: 4       Replicas: 2,1,4,3       Isr: 4,3        Offline: 2,1    Observers: 4,3

==> Describe topic: multi-region-async-op-under-replicated

Topic: multi-region-async-op-under-replicated     PartitionCount: 1       ReplicationFactor: 4    Configs: min.insync.replicas=1,confluent.placement.constraints={"observerPromotionPolicy":"under-replicated","version":2,"replicas":[{"count":2,"constraints":{"rack":"west"}}],"observers":[{"count":2,"constraints":{"rack":"east"}}]}
  Topic: multi-region-async-op-under-replicated   Partition: 0    Leader: 4       Replicas: 1,2,3,4       Isr: 4,3        Offline: 1,2    Observers: 3,4

==> Describe topic: multi-region-async-op-leader-is-observer

Topic: multi-region-async-op-leader-is-observer   PartitionCount: 1       ReplicationFactor: 4    Configs: min.insync.replicas=1,confluent.placement.constraints={"observerPromotionPolicy":"leader-is-observer","version":2,"replicas":[{"count":2,"constraints":{"rack":"west"}}],"observers":[{"count":2,"constraints":{"rack":"east"}}]}
  Topic: multi-region-async-op-leader-is-observer Partition: 0    Leader: none    Replicas: 1,2,4,3       Isr: 2  Offline: 1,2    Observers: 4,3

==> Describe topic: multi-region-default

Topic: multi-region-default PartitionCount: 1   ReplicationFactor: 4    Configs: min.insync.replicas=1,confluent.placement.constraints={"version":1,"replicas":[{"count":2,"constraints":{"rack":"west"}}],"observers":[{"count":2,"constraints":{"rack":"east"}}]}
   Topic: multi-region-default Partition: 0    Leader: none    Replicas: 2,1,3,4   Isr: 1  Offline: 2,1    Observers: 3,4
After the Confluent Control Center (Legacy) cluster metrics stabilize in about five minutes, you should see output similar to below.
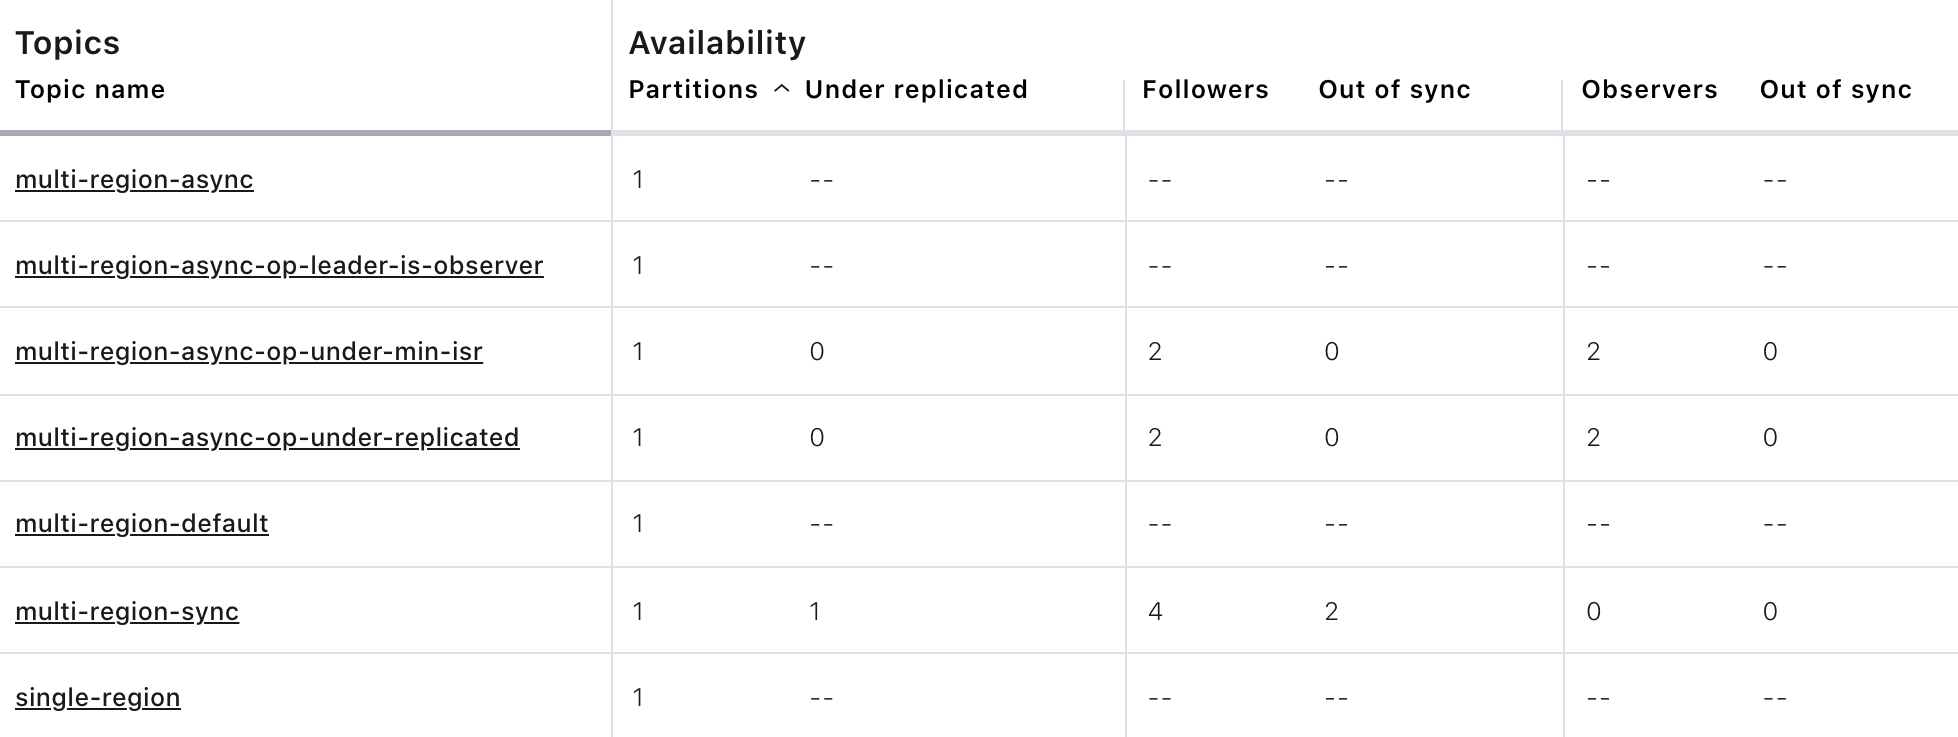
Observe the following:
In the first scenario, the
single-regiontopic has no leader, because it had only two replicas in the ISR, both of which were in thewestregion and are now down.In the second scenario, the
multi-region-synctopic automatically elected a new leader ineast(for example, replica 3 in the previous output). Clients can failover to those replicas in theeastregion.The
multi-region-async,multi-region-defaultandmulti-region-async-op-leader-is-observertopics have no leader, because they had only two replicas in the ISR, both of which were in thewestregion and are now down. The observers in theeastregion are not eligible to become leaders automatically because they were not in the ISR.The
multi-region-async-op-under-min-israndmulti-region-async-op-under-replicatedtopics have promoted observers into the ISR and an observer has become the leader. This is because their replica placement policy has setobserverPromotionPolicyto allow this.
Run the script jmx_metrics.sh to get the JMX metrics for
ReplicasCount,InSyncReplicasCount,CaughtUpReplicasCount, andObserversInIsrCountfrom each of the brokers:./scripts/jmx_metrics.sh
Verify you see output similar to the following:
==> JMX metric: ReplicasCount

single-region: 0
multi-region-sync: 4
multi-region-async: 0
multi-region-async-op-under-min-isr: 4
multi-region-async-op-under-replicated: 4
multi-region-async-op-leader-is-observer: 0
multi-region-default: 0


==> JMX metric: InSyncReplicasCount

single-region: 0
multi-region-sync: 2
multi-region-async: 0
multi-region-async-op-under-min-isr: 2
multi-region-async-op-under-replicated: 2
multi-region-async-op-leader-is-observer: 0
multi-region-default: 0


==> JMX metric: CaughtUpReplicasCount

single-region: 0
multi-region-sync: 2
multi-region-async: 0
multi-region-async-op-under-min-isr: 2
multi-region-async-op-under-replicated: 2
multi-region-async-op-leader-is-observer: 0
multi-region-default: 0


==> JMX metric: ObserversInIsrCount

single-region: 0
multi-region-sync: 0
multi-region-async: 0
multi-region-async-op-under-min-isr: 2
multi-region-async-op-under-replicated: 2
multi-region-async-op-leader-is-observer: 0
multi-region-default: 0
Failover Observers
To explicitly fail over the observers in the multi-region-async and multi-region-default topics to the east region, complete the following steps:
Trigger unclean leader election (note:
uncleanleader election may result in data loss):docker compose exec broker-east-4 kafka-leader-election --bootstrap-server broker-east-4:19094 --election-type UNCLEAN --topic multi-region-async --partition 0 docker compose exec broker-east-4 kafka-leader-election --bootstrap-server broker-east-4:19094 --election-type UNCLEAN --topic multi-region-default --partition 0
Describe the topics again with the script describe-topics.sh.
./scripts/describe-topics.sh
You should see output similar to the following:
...
==> Describe topic: multi-region-async

Topic: multi-region-async   PartitionCount: 1   ReplicationFactor: 4    Configs: min.insync.replicas=1,confluent.placement.constraints={"version":1,"replicas":[{"count":2,"constraints":{"rack":"west"}}],"observers":[{"count":2,"constraints":{"rack":"east"}}]}
   Topic: multi-region-async   Partition: 0    Leader: 3   Replicas: 2,1,3,4   Isr: 3,4    Offline: 2,1    Observers: 3,4

...
==> Describe topic: multi-region-default

Topic: multi-region-default PartitionCount: 1   ReplicationFactor: 4    Configs: min.insync.replicas=1,confluent.placement.constraints={"version":1,"replicas":[{"count":2,"constraints":{"rack":"west"}}],"observers":[{"count":2,"constraints":{"rack":"east"}}]}
   Topic: multi-region-default Partition: 0    Leader: 3   Replicas: 2,1,3,4   Isr: 3,4    Offline: 2,1    Observers: 3,4
View the changes in the unclean leader election in Confluent Control Center (Legacy) under the “Topics” section.
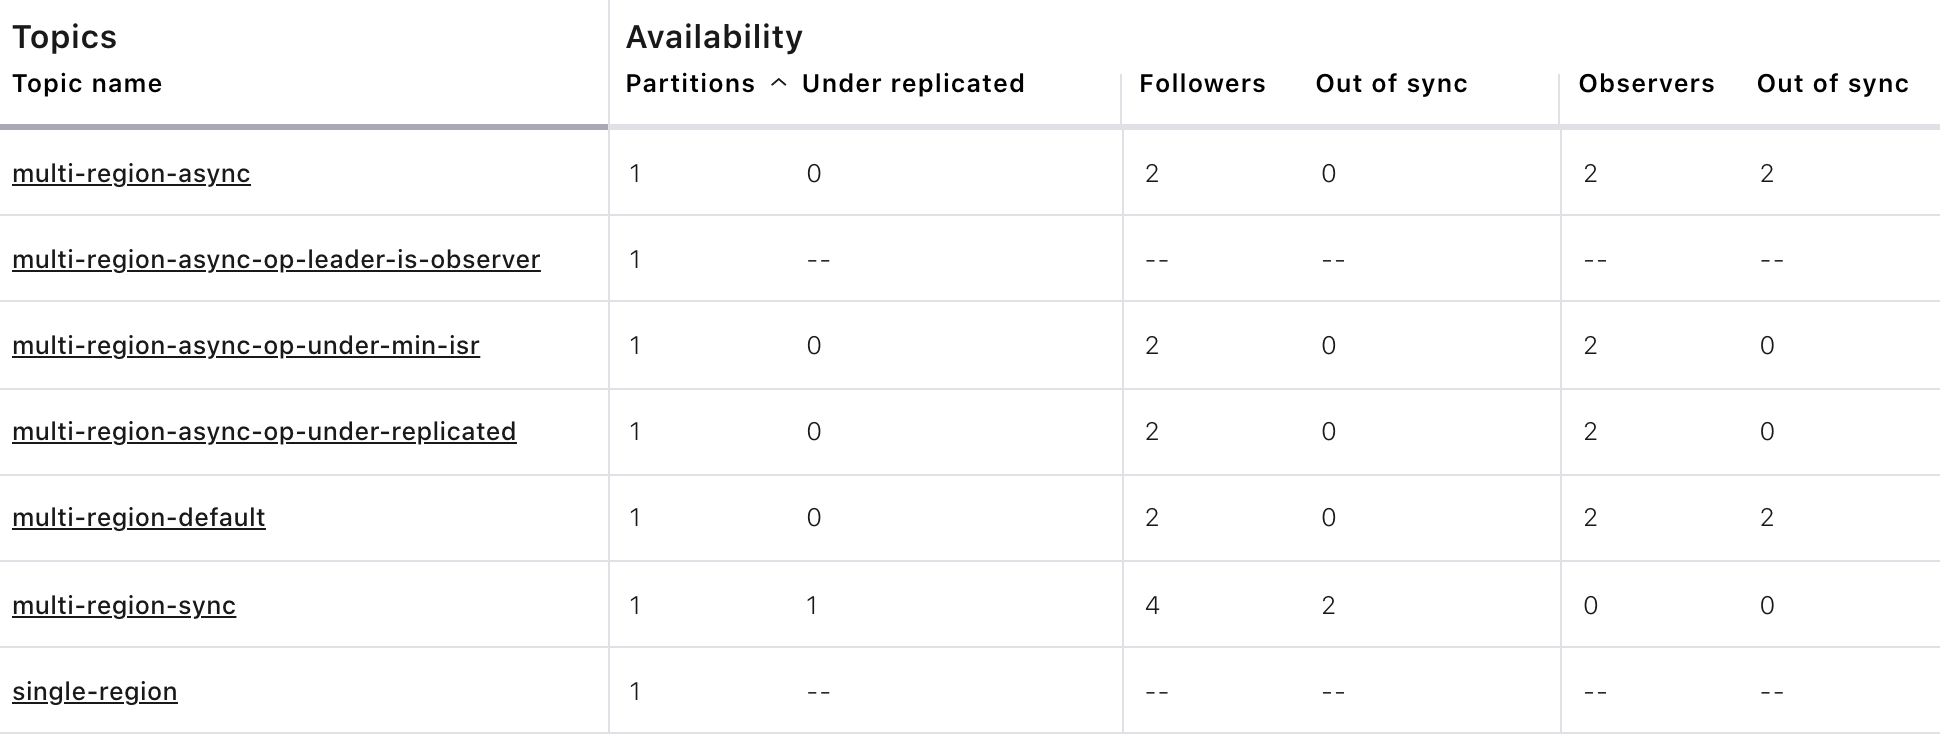
Observe the following:
The topics
multi-region-asyncandmulti-region-defaulthave leaders again (for example, replica 3 in the CLI output)The topics
multi-region-asyncandmulti-region-defaulthad observers that are now in the ISR list (for example, replicas 3,4 in the CLI output)
Run the script jmx_metrics.sh to get the JMX metrics for
ReplicasCount,InSyncReplicasCount,CaughtUpReplicasCount, andObserversInIsrCountfrom each of the brokers:./scripts/jmx_metrics.sh
Verify you see output similar to the following:
==> JMX metric: ReplicasCount

single-region: 0
multi-region-sync: 4
multi-region-async: 4
multi-region-async-op-under-min-isr: 4
multi-region-async-op-under-replicated: 4
multi-region-async-op-leader-is-observer: 0
multi-region-default: 4


==> JMX metric: InSyncReplicasCount

single-region: 0
multi-region-sync: 2
multi-region-async: 2
multi-region-async-op-under-min-isr: 2
multi-region-async-op-under-replicated: 2
multi-region-async-op-leader-is-observer: 0
multi-region-default: 2


==> JMX metric: CaughtUpReplicasCount

single-region: 0
multi-region-sync: 2
multi-region-async: 2
multi-region-async-op-under-min-isr: 2
multi-region-async-op-under-replicated: 2
multi-region-async-op-leader-is-observer: 0
multi-region-default: 2


==> JMX metric: ObserversInIsrCount

single-region: 0
multi-region-sync: 0
multi-region-async: 2
multi-region-async-op-under-min-isr: 2
multi-region-async-op-under-replicated: 2
multi-region-async-op-leader-is-observer: 0
multi-region-default: 2
Permanent Failover
At this point in the example, if the brokers in the west region come back online, the leaders for the multi-region-async and multi-region-default topics will automatically be elected back to a replica in west–that is, replica 1 or 2. This may be desirable in some circumstances, but if you don’t want the leaders to automatically failback to the west region, change the topic placement constraints configuration and replica assignment by completing the following steps:
For the topic
multi-region-default, view a modified replica placement policy placement-multi-region-default-reverse.json:{ "version": 1, "replicas": [ { "count": 2, "constraints": { "rack": "east" } } ], "observers": [ { "count": 2, "constraints": { "rack": "west" } } ] }Change the replica placement constraints configuration and replica assignment for
multi-region-default, by running the script permanent-failover.sh../scripts/permanent-failover.sh
The script uses
kafka-configsto change the replica placement policy and then it runsconfluent-rebalancerto move the replicas.echo -e "\n==> Switching replica placement constraints for multi-region-default\n" docker compose exec broker-east-3 kafka-configs \ --bootstrap-server broker-east-3:19093 \ --alter \ --topic multi-region-default \ --replica-placement /etc/kafka/demo/placement-multi-region-default-reverse.json echo -e "\n==> Running Confluent Rebalancer on multi-region-default\n" docker compose exec broker-east-3 confluent-rebalancer execute \ --metrics-bootstrap-server broker-ccc:19098 \ --bootstrap-server broker-east-3:19093 \ --replica-placement-only \ --topics multi-region-default \ --force \ --throttle 10000000 docker compose exec broker-east-3 confluent-rebalancer finish \ --bootstrap-server broker-east-3:19093
Describe the topics again with the script describe-topics.sh.
./scripts/describe-topics.sh
You should see output similar to the following:
...
==> Describe topic: multi-region-default

Topic: multi-region-default PartitionCount: 1   ReplicationFactor: 4    Configs: min.insync.replicas=1,confluent.placement.constraints={"version":1,"replicas":[{"count":2,"constraints":{"rack":"east"}}],"observers":[{"count":2,"constraints":{"rack":"west"}}]}
   Topic: multi-region-async   Partition: 0    Leader: 3   Replicas: 3,4,2,1   Isr: 3,4    Offline: 2,1    Observers: 2,1
...
See similar leader placement by clicking on the
multi-region-defaulttopic and referencing thePartitionsandReplica Placementsection.
Observe the following:
For topic
multi-region-default, replicas 2 and 1, which were previously sync replicas, are now observers and are still offlineFor topic
multi-region-default, replicas 3 and 4, which were previously observers, are now sync replicas.
Run the script jmx_metrics.sh to get the JMX metrics for
ReplicasCount,InSyncReplicasCount,CaughtUpReplicasCount, andObserversInIsrCountfrom each of the brokers:./scripts/jmx_metrics.sh
Verify you see output similar to the following:
==> JMX metric: ReplicasCount

single-region: 0
multi-region-sync: 4
multi-region-async: 4
multi-region-async-op-under-min-isr: 4
multi-region-async-op-under-replicated: 4
multi-region-async-op-leader-is-observer: 0
multi-region-default: 4


==> JMX metric: InSyncReplicasCount

single-region: 0
multi-region-sync: 2
multi-region-async: 2
multi-region-async-op-under-min-isr: 2
multi-region-async-op-under-replicated: 2
multi-region-async-op-leader-is-observer: 0
multi-region-default: 2


==> JMX metric: CaughtUpReplicasCount

single-region: 0
multi-region-sync: 2
multi-region-async: 2
multi-region-async-op-under-min-isr: 2
multi-region-async-op-under-replicated: 2
multi-region-async-op-leader-is-observer: 0
multi-region-default: 2


==> JMX metric: ObserversInIsrCount

single-region: 0
multi-region-sync: 0
multi-region-async: 2
multi-region-async-op-under-min-isr: 2
multi-region-async-op-under-replicated: 2
multi-region-async-op-leader-is-observer: 0
multi-region-default: 0
Failback
Now you will bring region west back online and restore configuration to the same as in the steady state.
Run the following command to bring the
westregion back online:docker compose start broker-west-1 broker-west-2 zookeeper-west
Wait for 5 minutes–the default duration for
leader.imbalance.check.interval.seconds–until the leadership election restores the preferred replicas. You can also trigger it withdocker compose exec broker-east-4 kafka-leader-election --bootstrap-serverbroker-east-4:19094 --election-type PREFERRED --all-topic-partitions.Verify the new topic replica placement is restored with the script describe-topics.sh.
./scripts/describe-topics.sh
You should see output similar to the following:
Topic: single-region    PartitionCount: 1   ReplicationFactor: 2    Configs: min.insync.replicas=1,confluent.placement.constraints={"version":1,"replicas":[{"count":2,"constraints":{"rack":"west"}}],"observers":[]}
   Topic: single-region    Partition: 0    Leader: 2   Replicas: 2,1   Isr: 1,2    Offline:

==> Describe topic: multi-region-sync

Topic: multi-region-sync    PartitionCount: 1   ReplicationFactor: 4    Configs: min.insync.replicas=1,confluent.placement.constraints={"version":1,"replicas":[{"count":2,"constraints":{"rack":"west"}},{"count":2,"constraints":{"rack":"east"}}],"observers":[]}
   Topic: multi-region-sync    Partition: 0    Leader: 1   Replicas: 1,2,3,4   Isr: 3,4,2,1    Offline:

==> Describe topic: multi-region-async

Topic: multi-region-async   PartitionCount: 1   ReplicationFactor: 4    Configs: min.insync.replicas=1,confluent.placement.constraints={"version":1,"replicas":[{"count":2,"constraints":{"rack":"west"}}],"observers":[{"count":2,"constraints":{"rack":"east"}}]}
   Topic: multi-region-async   Partition: 0    Leader: 2   Replicas: 2,1,3,4   Isr: 2,1    Offline:    Observers: 3,4

==> Describe topic: multi-region-async-op-under-min-isr

Topic: multi-region-async-op-under-min-isr        PartitionCount: 1       ReplicationFactor: 4    Configs: min.insync.replicas=2,confluent.placement.constraints={"observerPromotionPolicy":"under-min-isr","version":2,"replicas":[{"count":2,"constraints":{"rack":"west"}}],"observers":[{"count":2,"constraints":{"rack":"east"}}]}
  Topic: multi-region-async-op-under-min-isr      Partition: 0    Leader: 2       Replicas: 2,1,3,4       Isr: 1,2        Offline:        Observers: 3,4

==> Describe topic: multi-region-async-op-under-replicated

Topic: multi-region-async-op-under-replicated     PartitionCount: 1       ReplicationFactor: 4    Configs: min.insync.replicas=1,confluent.placement.constraints={"observerPromotionPolicy":"under-replicated","version":2,"replicas":[{"count":2,"constraints":{"rack":"west"}}],"observers":[{"count":2,"constraints":{"rack":"east"}}]}
  Topic: multi-region-async-op-under-replicated   Partition: 0    Leader: 2       Replicas: 2,1,3,4       Isr: 1,2        Offline:        Observers: 3,4

==> Describe topic: multi-region-async-op-leader-is-observer

Topic: multi-region-async-op-leader-is-observer   PartitionCount: 1       ReplicationFactor: 4    Configs: min.insync.replicas=1,confluent.placement.constraints={"observerPromotionPolicy":"leader-is-observer","version":2,"replicas":[{"count":2,"constraints":{"rack":"west"}}],"observers":[{"count":2,"constraints":{"rack":"east"}}]}
  Topic: multi-region-async-op-leader-is-observer Partition: 0    Leader: 2       Replicas: 2,1,3,4       Isr: 2,1        Offline:        Observers: 3,4

==> Describe topic: multi-region-default

Topic: multi-region-default PartitionCount: 1   ReplicationFactor: 4    Configs: min.insync.replicas=1,confluent.placement.constraints={"version":1,"replicas":[{"count":2,"constraints":{"rack":"east"}}],"observers":[{"count":2,"constraints":{"rack":"west"}}]}
   Topic: multi-region-async   Partition: 0    Leader: 3   Replicas: 3,4,2,1   Isr: 3,4    Offline:    Observers: 2,1
Observe the following:
All topics have leaders again, in particular
single-regionwhich lost its leader when thewestregion failed.The leaders for
multi-region-syncandmulti-region-asyncare restored to thewestregion. If they are not, then wait a full 5 minutes (duration ofleader.imbalance.check.interval.seconds).The leader for
multi-region-defaultstayed in theeastregion because you performed a permanent failover.Any observers automatically promoted in
multi-region-async-op-under-min-israndmulti-region-async-op-under-replicatedare automatically demoted once thewestregion is restored. Leader election is not required for this demotion process, it will happen as soon as the failed region is restored.The Confluent Control Center (Legacy) topics page is the same as it was at the start of this tutorial.
Note
On failback from a failover to observers, any data that wasn’t replicated to observers will be lost because logs are truncated before catching up and joining the ISR.
Run the script jmx_metrics.sh to get the JMX metrics for
ReplicasCount,InSyncReplicasCount,CaughtUpReplicasCount, andObserversInIsrCountfrom each of the brokers:./scripts/jmx_metrics.sh
Verify you see output similar to the following, which should exactly match the output from the start of the tutorial at steady state:
==> JMX metric: ReplicasCount

single-region: 2
multi-region-sync: 4
multi-region-async: 4
multi-region-async-op-under-min-isr: 4
multi-region-async-op-under-replicated: 4
multi-region-async-op-leader-is-observer: 4
multi-region-default: 4


==> JMX metric: InSyncReplicasCount

single-region: 2
multi-region-sync: 4
multi-region-async: 2
multi-region-async-op-under-min-isr: 2
multi-region-async-op-under-replicated: 2
multi-region-async-op-leader-is-observer: 2
multi-region-default: 2


==> JMX metric: CaughtUpReplicasCount

single-region: 2
multi-region-sync: 4
multi-region-async: 4
multi-region-async-op-under-min-isr: 4
multi-region-async-op-under-replicated: 4
multi-region-async-op-leader-is-observer: 4
multi-region-default: 4


==> JMX metric: ObserversInIsrCount

single-region: 0
multi-region-sync: 0
multi-region-async: 0
multi-region-async-op-under-min-isr: 0
multi-region-async-op-under-replicated: 0
multi-region-async-op-leader-is-observer: 0
multi-region-default: 0
Stop the Tutorial and Teardown
To stop the example environment and all Docker containers, run the following command:
./scripts/stop.sh
To stop the application manually, run the following command:
docker compose down
If you ran either the automated or manual demo to completion, and just want to clean up the Docker environment after the application is stopped, here are some useful commands to do so.
Stop containers:
docker stop $(docker ps -a -q)Remove containers:
docker rm $(docker ps -a -q)Remove images:
docker rmi $(docker images -q)(Optional)
Troubleshooting
Demo fails on startup
The demo application pulls resources from various sites, including OS packages and Docker images. If network connectivity is unreliable or these sites are unavailable, the demo can error out while attempting to pull the needed resources.
If this happens, run the following command, and then retry the download and start scripts:
docker compose down
Containers fail to ping each other
If containers fail to ping each other (for example, failures when running the script validate_connectivity.sh), complete the following steps:
Stop the example.
./scripts/stop.sh
Clean up the Docker environment.
docker compose down -v --remove-orphans

# More aggressive cleanup
docker volume prune
Restart the example.
./scripts/start.sh
If the containers still fail to ping each other, restart Docker and run again.
No detectable latency and jitter
If there is no performance difference between the sync replication for the multi-region-sync and the other topics, it is possible Docker networking not working or cleaning up properly between runs.
Restart Docker. You can restart it via the UI, or:
If you are running macOS:
osascript -e 'quit app "Docker"' && open -a Docker
If you are running Docker Toolbox:
docker-machine restart
