Important
You are viewing documentation for an older version of Confluent Platform. For the latest, click here.
Hybrid Kafka Clusters from Self-Hosted to Confluent Cloud
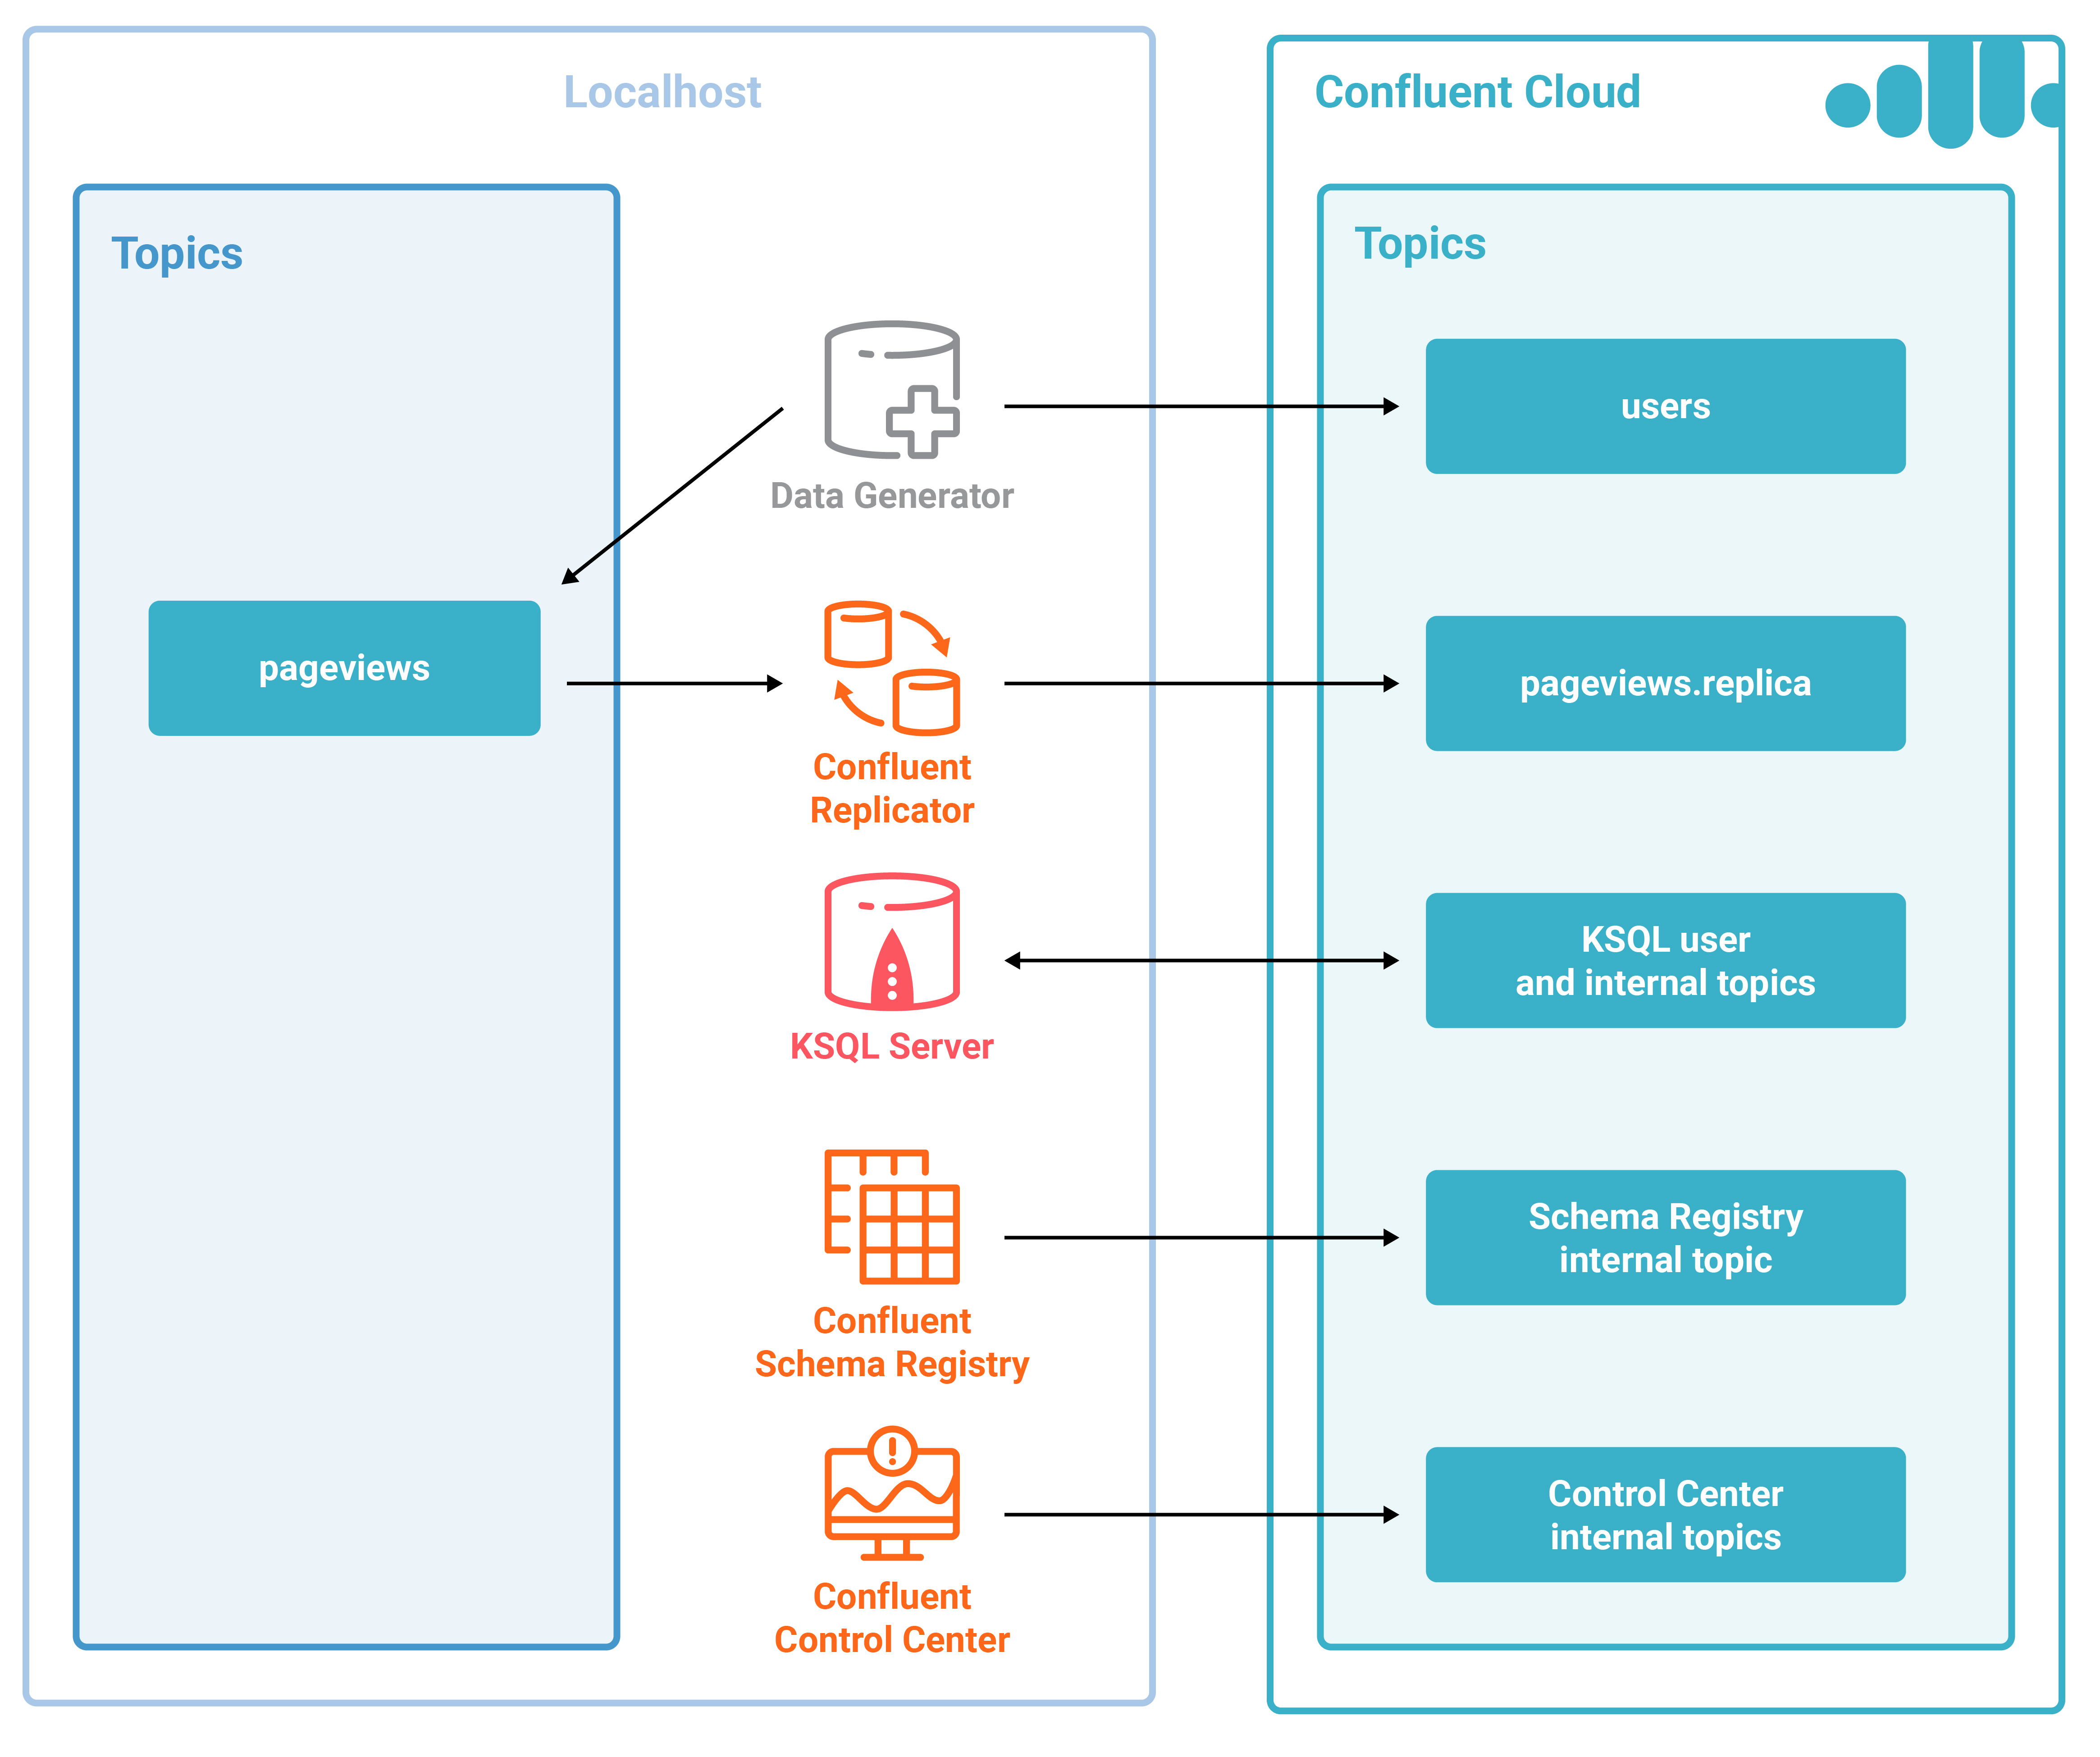
This Confluent Cloud demo showcases Hybrid Kafka Clusters from Self-Hosted to Confluent Cloud. This automated demo is an expansion of the KSQL Tutorial. Instead of the Kafka cluster backing the KSQL stream processing running on your local machine, it runs on your Confluent Cloud cluster. There are also additional Confluent Platform components including Confluent Control Center and Confluent Replicator.
Contents
Overview
This Confluent Cloud demo showcases Hybrid Kafka Clusters from Self-Hosted to Confluent Cloud. This automated demo is an expansion of the KSQL Tutorial , but instead of KSQL stream processing running on your local install, it runs on your Confluent Cloud cluster.
You can monitor the KSQL streams in Confluent Control Center. This demo also showcases the Confluent Replicator executable for self-hosted Confluent to Confluent Cloud. Confluent Replicator can be used to transfer data from another cluster into Confluent Cloud, or it can be used for Disaster Recovery scenarios. In this case demo, Replicator is used to bootstrap the Kafka topic pageviews.replica which is used for KSQL stream processing.
Note
This is a demo environment and has many services running on one host. Do not use this demo in production, and do not use confluent cli in production. This is meant exclusively to easily demo the Confluent Platform and Confluent Cloud with KSQL.
Run demo
Demo validated with:
- Confluent Platform 4.1
- Confluent Cloud
- Confluent Cloud CLI
- Java version 1.8.0_162
- MacOS 10.12
Clone the quickstart-demos GitHub repository.
$ git clone https://github.com/confluentinc/quickstart-demos
Change directory to the Confluent Cloud demo.
$ cd quickstart-demos/ccloudStart the entire demo by running a single command that brings up the local self-hosted Confluent Platform using `confluent cli, Confluent Replicator, and the KSQL streaming application. This will take less than 5 minutes to complete.
$ ./start.sh
Use Google Chrome to view the Confluent Control Center GUI at http://localhost:9021 . Click on the top-right button that shows the current date, and change
Last 4 hourstoLast 30 minutes.
Playbook
Confluent Cloud
You must have access to an initialized, working Confluent Cloud cluster. To sign up for the service, go to Confluent Cloud page. Validate you have a configuration file for your Confluent Cloud cluster.
$ cat ~/.ccloud/config
You must have locally installed Confluent Cloud CLI. To install the CLI, follow these steps. Validate you can list topics in your cluster.
$ ccloud topic list
Get familar with the Confluent Cloud CLI. For example, create a new topic called test, produce some messages to that topic, and then consume from that topic.
$ ccloud topic create test
Topic "test" created.
$ ccloud produce -t test
a
b
c
^C
$ ccloud consume -b -t test
a
b
c
^CProcessed a total of 3 messages.
Confluent Control Center
View the Confluent Control Center configuration file.
# Control Center servers point to Confluent Cloud
$ cat `confluent current | tail -1`/control-center/control-center-ccloud.properties
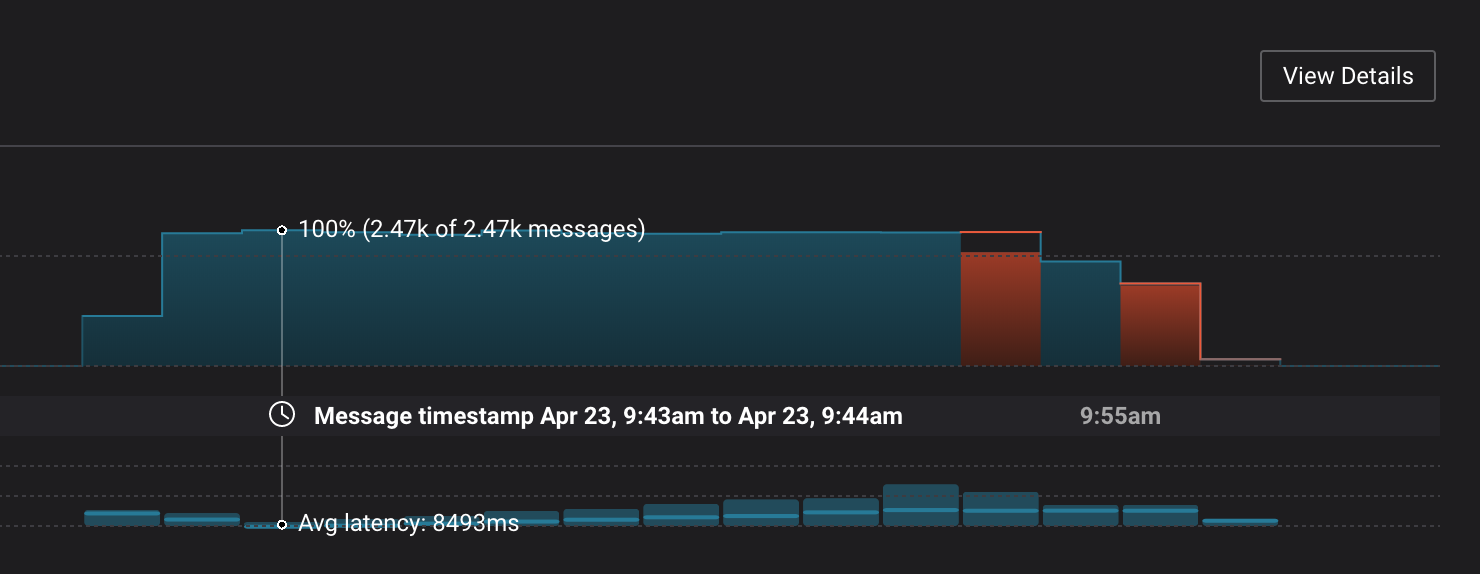
Monitoring –> Data Streams –> Message Delivery: hover over any chart to see number of messages and average latency within a minute time interval.
Management –> Kafka Connect: Confluent Control Center uses the Kafka Connect API to manage Kafka connectors, and more specifically for this demo, Confluent Replicator.
Kafka Connect Sources tab shows the connector
replicator. ClickEditto see the details of the connector configuration.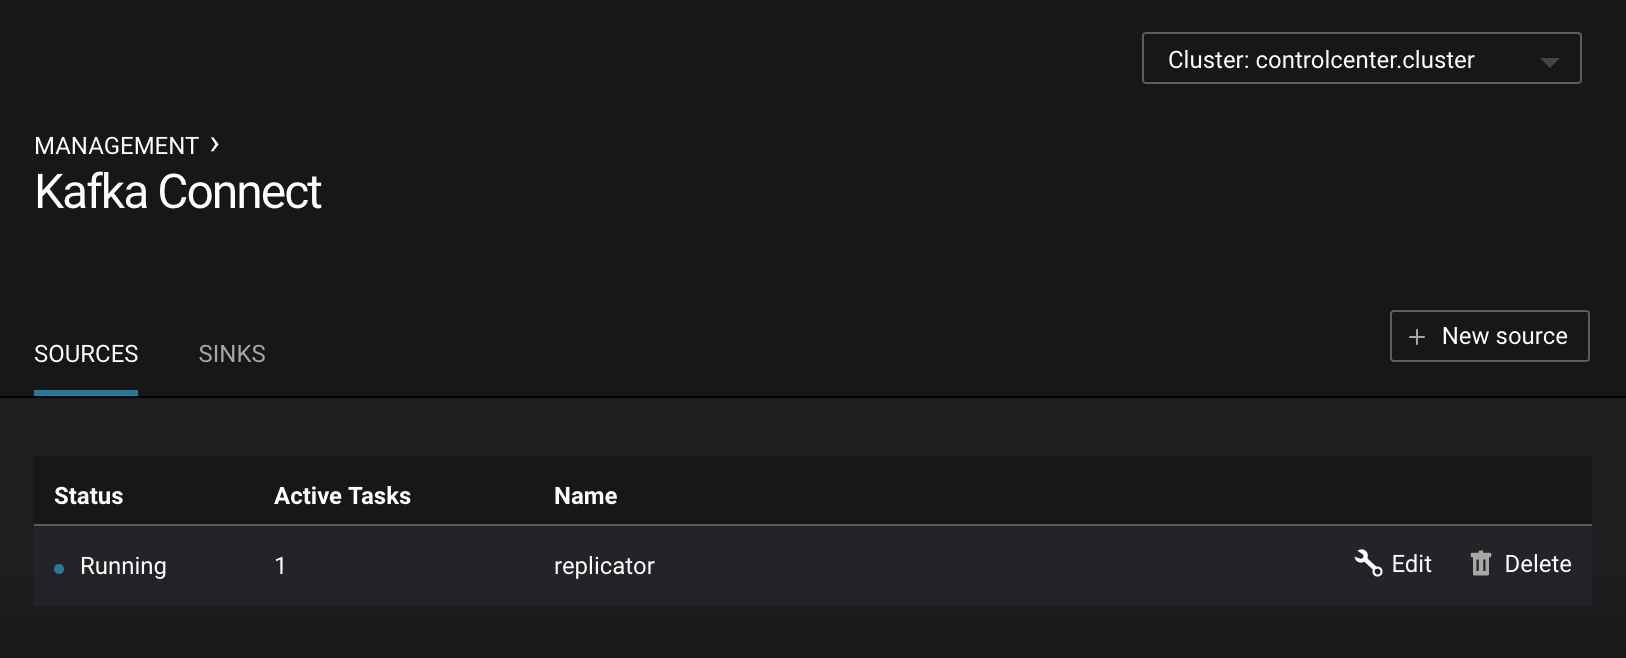
Management –> Topics –> Topic Information: For a given topic, click on the three dots
...next to the topic name and click onView details. View which brokers are leaders for which partitions and the number of consumer groups currently consuming from this topic. Click on the boxed consumer group count to select a consumer group for which to monitor its data streams and jump to it.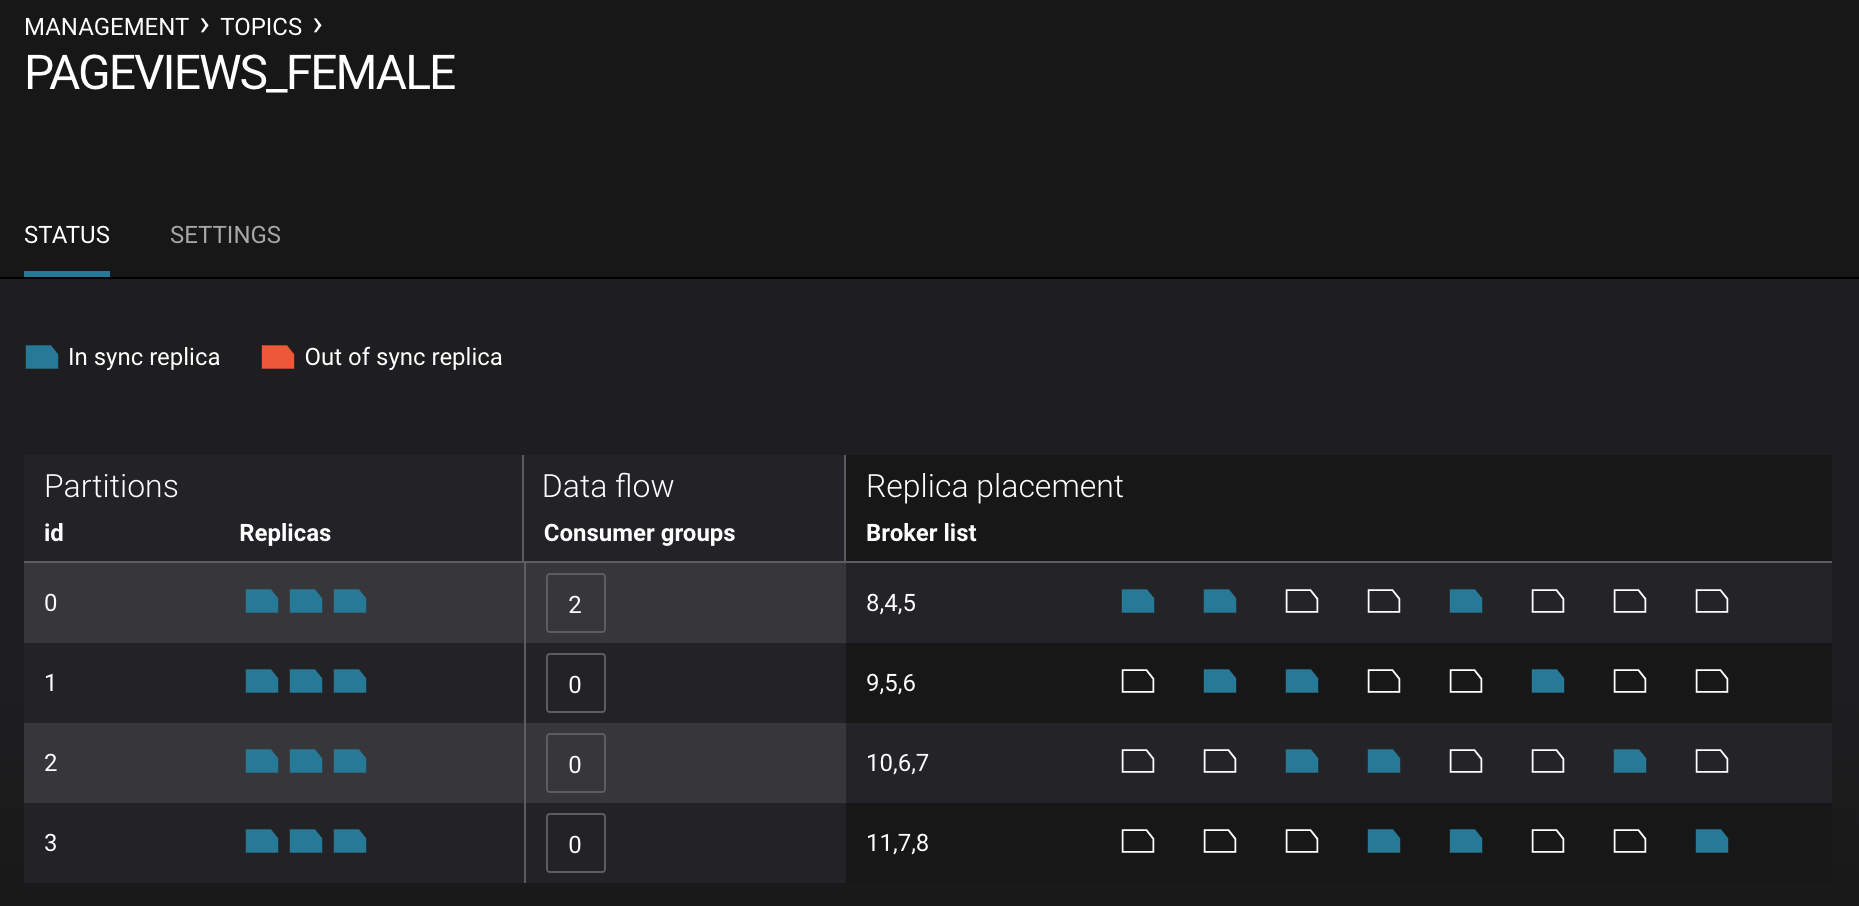
Note
There will not be any details on the Confluent Control Center System Health pages about brokers or topics because Confluent Cloud does not provide the Confluent Metrics Reporter instrumentation outside of the Confluent Cloud. Therefore, you should expect to see the following graphic on the System Health page.
KSQL
View the KSQL server configuration file.
# KSQL bootstrap servers point to Confluent Cloud
$ cat `confluent current | tail -1`/ksql-server/ksql-server-ccloud.properties
The KSQL server that is connected to Confluent Cloud is listening on port 8089 for KSQL CLI connections. You have two options for interfacing with KSQL.
Run KSQL CLI to get to the KSQL CLI prompt.
$ ksql http://localhost:8089
Run the preview KSQL web interface. Navigate your browser to
http://localhost:8089/index.html
At the KSQL prompt, view the configured KSQL properties that were set with the KSQL server configuration file shown earlier.
ksql> SHOW PROPERTIES;View the existing KSQL streams and describe one of those streams called
WIKIPEDIABOT.ksql> SHOW STREAMS; Stream Name | Kafka Topic | Format -------------------------------------------------------------- PAGEVIEWS_ORIGINAL | pageviews.replica | AVRO PAGEVIEWS_FEMALE | PAGEVIEWS_FEMALE | AVRO PAGEVIEWS_FEMALE_LIKE_89 | pageviews_enriched_r8_r9 | AVRO -------------------------------------------------------------- ksql> DESCRIBE PAGEVIEWS_FEMALE_LIKE_89; Field | Type -------------------------------------- ROWTIME | BIGINT (system) ROWKEY | VARCHAR(STRING) (system) USERID | VARCHAR(STRING) (key) PAGEID | VARCHAR(STRING) REGIONID | VARCHAR(STRING) GENDER | VARCHAR(STRING) -------------------------------------- For runtime statistics and query details run: DESCRIBE EXTENDED <Stream,Table>;
View the existing KSQL tables and describe one of those tables called
EN_WIKIPEDIA_GT_1.ksql> SHOW TABLES; Table Name | Kafka Topic | Format | Windowed ----------------------------------------------------------- PAGEVIEWS_REGIONS | PAGEVIEWS_REGIONS | AVRO | true USERS_ORIGINAL | users | AVRO | false ----------------------------------------------------------- ksql> DESCRIBE PAGEVIEWS_REGIONS; Field | Type -------------------------------------- ROWTIME | BIGINT (system) ROWKEY | VARCHAR(STRING) (system) GENDER | VARCHAR(STRING) (key) REGIONID | VARCHAR(STRING) (key) NUMUSERS | BIGINT -------------------------------------- For runtime statistics and query details run: DESCRIBE EXTENDED <Stream,Table>;
View the existing KSQL queries, which are continuously running, and explain one of those queries called
CSAS_WIKIPEDIABOT.ksql> SHOW QUERIES; Query ID | Kafka Topic | Query String ---------------------------------------------------------------------------------------------------------- CTAS_PAGEVIEWS_REGIONS | PAGEVIEWS_REGIONS | CREATE TABLE pageviews_regions WITH (value_format='avro') AS SELECT gender, regionid , COUNT(*) AS numusers FROM pageviews_female WINDOW TUMBLING (size 30 second) GROUP BY gender, regionid HAVING COUNT(*) > 1; CSAS_PAGEVIEWS_FEMALE | PAGEVIEWS_FEMALE | CREATE STREAM pageviews_female AS SELECT users_original.userid AS userid, pageid, regionid, gender FROM pageviews_original LEFT JOIN users_original ON pageviews_original.userid = users_original.userid WHERE gender = 'FEMALE'; CSAS_PAGEVIEWS_FEMALE_LIKE_89 | pageviews_enriched_r8_r9 | CREATE STREAM pageviews_female_like_89 WITH (kafka_topic='pageviews_enriched_r8_r9', value_format='AVRO') AS SELECT * FROM pageviews_female WHERE regionid LIKE '%_8' OR regionid LIKE '%_9'; ---------------------------------------------------------------------------------------------------------- ksql> EXPLAIN CSAS_PAGEVIEWS_FEMALE_LIKE_89; Type : QUERY SQL : CREATE STREAM pageviews_female_like_89 WITH (kafka_topic='pageviews_enriched_r8_r9', value_format='AVRO') AS SELECT * FROM pageviews_female WHERE regionid LIKE '%_8' OR regionid LIKE '%_9'; Local runtime statistics ------------------------ messages-per-sec: 0 total-messages: 43 last-message: 4/23/18 10:28:29 AM EDT failed-messages: 0 failed-messages-per-sec: 0 last-failed: n/a (Statistics of the local KSQL server interaction with the Kafka topic pageviews_enriched_r8_r9)
At the KSQL prompt, view three messages from different KSQL streams and tables.
ksql> SELECT * FROM PAGEVIEWS_FEMALE_LIKE_89 LIMIT 3;
ksql> SELECT * FROM USERS_ORIGINAL LIMIT 3;
In this demo, KSQL is run with Confluent Monitoring Interceptors configured which enables Confluent Control Center Data Streams to monitor KSQL queries. The consumer group names
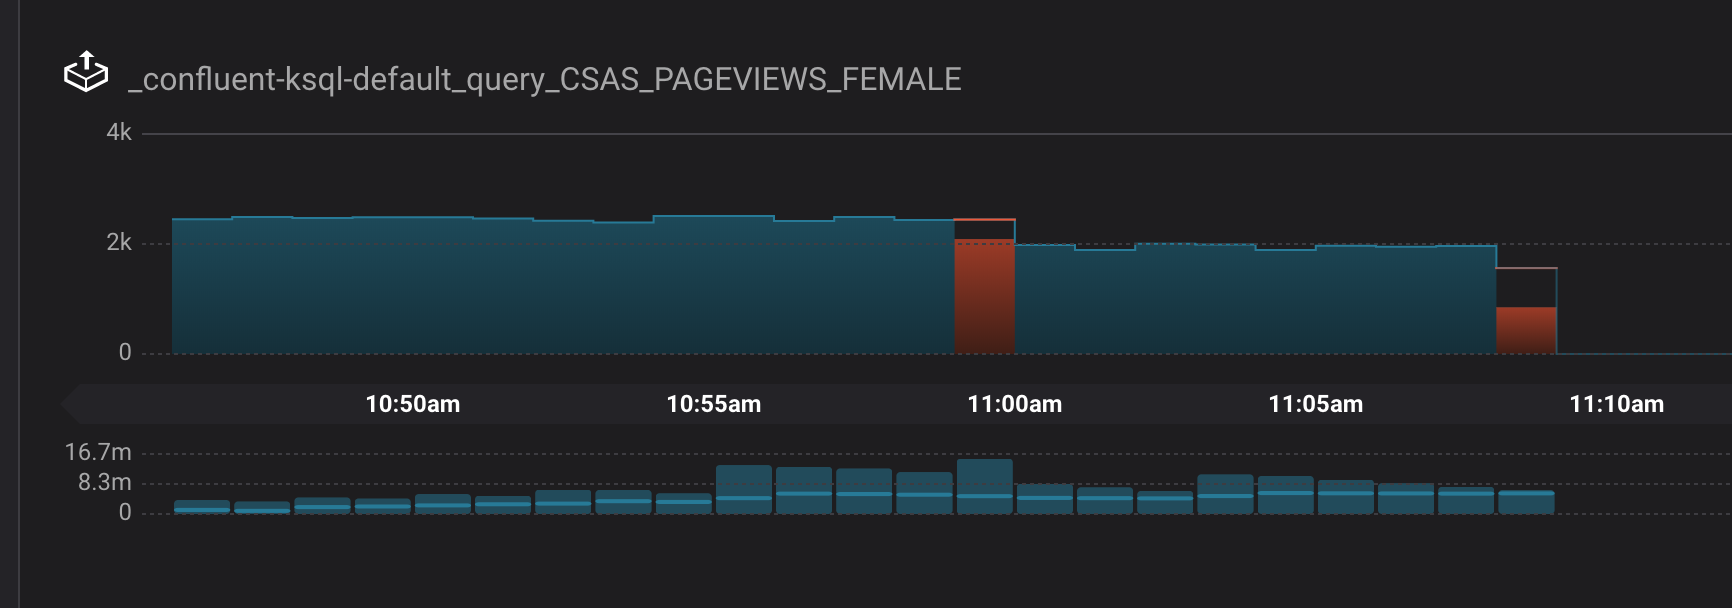
_confluent-ksql-default_query_correlate to the KSQL query names shown above, and Confluent Control Center is showing the records that are incoming to each query.
For example, view throughput and latency of the incoming records for the persistent KSQL “Create Stream As Select” query CSAS_PAGEVIEWS_FEMALE, which is displayed as _confluent-ksql-default_query_CSAS_PAGEVIEWS_FEMALE in Confluent Control Center.
Replicator
Confluent Replicator copies data from a source Kafka cluster to a destination Kafka cluster. In this demo, the source cluster is a local install that represents a self-hosted cluster, and the destination cluster is Confluent Cloud.
View the Confluent Replicator configuration files. Note that in this demo, Replicator is run as a standalone binary.
# Replicator's consumer points to the local cluster
$ cat `confluent current | tail -1`/connect/replicator-to-ccloud-consumer.properties
bootstrap.servers=localhost:9092

# Replicator's producer points to the |ccloud| cluster and configures Confluent Monitoring Interceptors for Control Center stream monitoring to work
$ cat `confluent current | tail -1`/connect/replicator-to-ccloud-producer.properties
ssl.endpoint.identification.algorithm=https
confluent.monitoring.interceptor.ssl.endpoint.identification.algorithm=https
sasl.mechanism=PLAIN
confluent.monitoring.interceptor.sasl.mechanism=PLAIN
security.protocol=SASL_SSL
confluent.monitoring.interceptor.security.protocol=SASL_SSL
retry.backoff.ms=500
bootstrap.servers=<broker1>,<broker2>,<broker3>
confluent.monitoring.interceptor.bootstrap.servers=<broker1>,<broker2>,<broker3>
sasl.jaas.config=org.apache.kafka.common.security.plain.PlainLoginModule required username="<username>" password="<password>";
confluent.monitoring.interceptor.sasl.jaas.config=org.apache.kafka.common.security.plain.PlainLoginModule required username="<username>" password="<password>";

# General Replicator properties define the replication policy
$ cat `confluent current | tail -1`/connect/replicator-to-ccloud.properties
topic.whitelist=pageviews
topic.rename.format=${topic}.replica
View topics pageviews in the local cluster
$ kafka-topics --zookeeper localhost:2181  --describe --topic pageviews
Topic:pageviews    PartitionCount:12       ReplicationFactor:1     Configs:
        Topic: pageviews   Partition: 0    Leader: 0       Replicas: 0     Isr: 0
        Topic: pageviews   Partition: 1    Leader: 0       Replicas: 0     Isr: 0
        Topic: pageviews   Partition: 2    Leader: 0       Replicas: 0     Isr: 0
        Topic: pageviews   Partition: 3    Leader: 0       Replicas: 0     Isr: 0
        Topic: pageviews   Partition: 4    Leader: 0       Replicas: 0     Isr: 0
        Topic: pageviews   Partition: 5    Leader: 0       Replicas: 0     Isr: 0
        Topic: pageviews   Partition: 6    Leader: 0       Replicas: 0     Isr: 0
        Topic: pageviews   Partition: 7    Leader: 0       Replicas: 0     Isr: 0
        Topic: pageviews   Partition: 8    Leader: 0       Replicas: 0     Isr: 0
        Topic: pageviews   Partition: 9    Leader: 0       Replicas: 0     Isr: 0
        Topic: pageviews   Partition: 10   Leader: 0       Replicas: 0     Isr: 0
        Topic: pageviews   Partition: 11   Leader: 0       Replicas: 0     Isr: 0
View the replicated topics pageviews.replica in the Confluent Cloud cluster. In Confluent Control Center, for a given topic listed in Management –> Topics, click on the three dots
...next to the topic name and click onView details. View which brokers are leaders for which partitions and the number of consumer groups currently consuming from this topic. Click on the boxed consumer group count to select a consumer group for which to monitor its data streams and jump to it.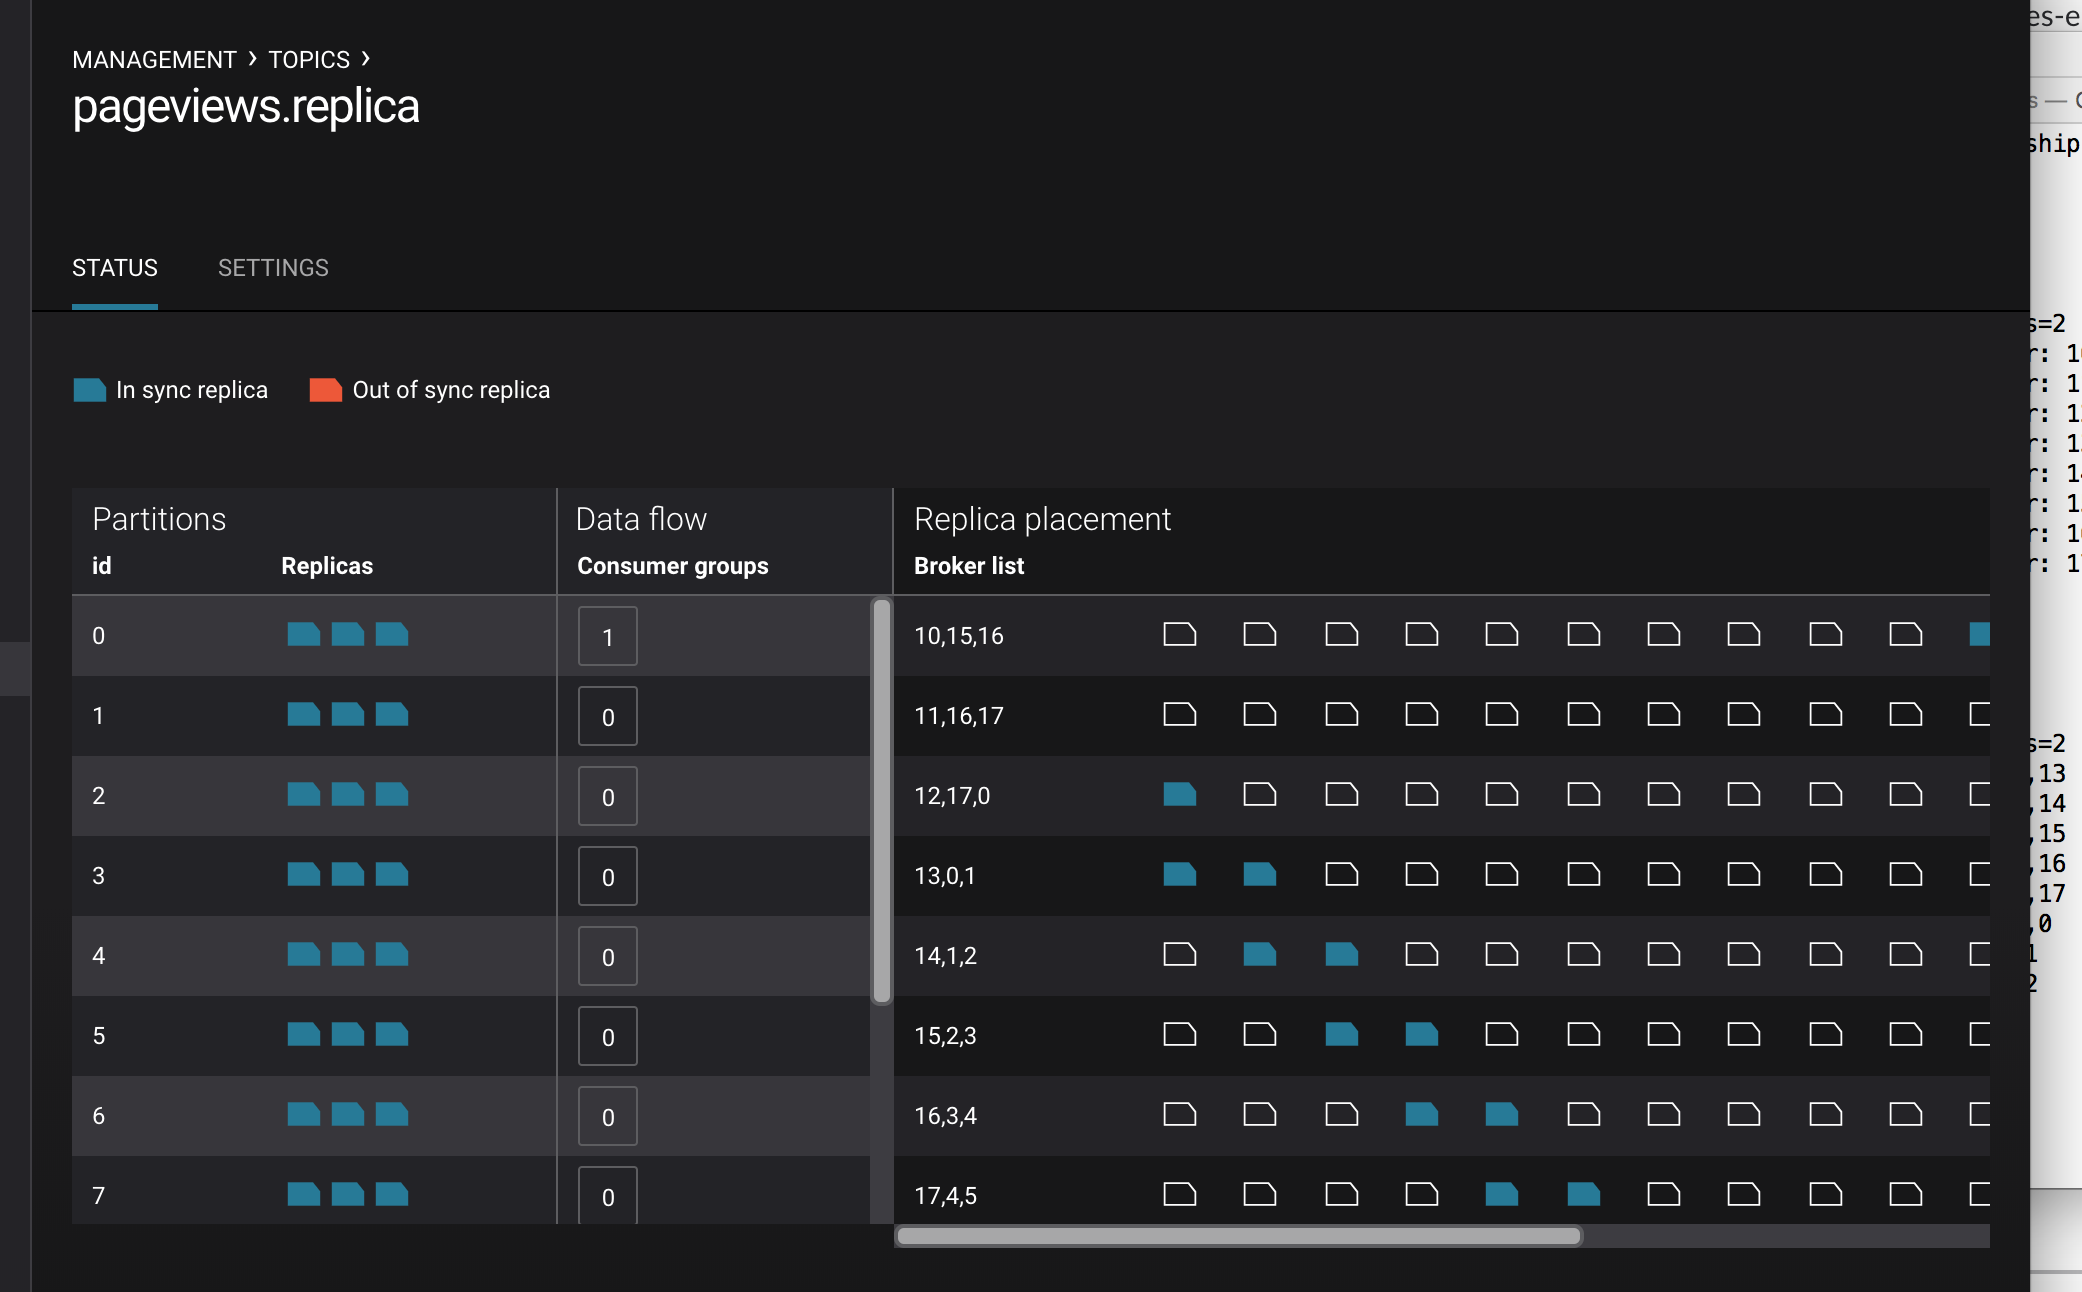
You can manage Confluent Replicator in the Management –> Kafka Connect page. The Sources tab shows the connector
replicator. ClickEditto see the details of the connector configuration.
Confluent Cloud Configurations
This demo uses Confluent CLI (for development and demos only!) and saves all modified configuration files and log files in the respective component subfolders in the current Confluent CLI temp directory.
View your Confluent Cloud configuration file
$ cat $HOME/.ccloud/configGenerate the per-component delta configuration parameters, automatically derived from your Confluent Cloud cluster configuration:
$ ./ccloud-generate-cp-configs.sh
View the full configuration file for the KSQL server that connects to your Confluent Cloud cluster (requires demo to be actively running):
$ cat `confluent current | tail -1`/ksql-server/ksql-server-ccloud.properties
View the full configuration file for Confluent Replicator that copies data from your local cluster to your Confluent Cloud cluster (requires demo to be actively running):
$ cat `confluent current | tail -1`/connect/replicator-to-ccloud-consumer.properties
$ cat `confluent current | tail -1`/connect/replicator-to-ccloud-producer.properties
$ cat `confluent current | tail -1`/connect/replicator-to-ccloud.properties
View the full configuration file for Confluent control Center that connects to your Confluent Cloud cluster (requires demo to be actively running):
$ cat `confluent current | tail -1`/control-center/control-center-ccloud.properties
View the full configuration file for Confluent Schema Registry that connects to your Confluent Cloud cluster (requires demo to be actively running):
$ cat `confluent current | tail -1`/schema-registry/schema-registry-ccloud.properties
Troubleshooting the demo
If you can’t run the demo due to error messages such as “‘ccloud’ is not found” or “‘ccloud’ is not initialized”, validate that you have access to an initialized, working Confluent Cloud cluster and you have locally installed Confluent Cloud CLI.
To view log files, look in the current Confluent CLI temp director (requires demo to be actively running):
$ ls `confluent current | tail -1`
Teardown
Stop the demo, destroy all local components created by Confluent CLI, delete topics backing KSQL queries.
$ ./stop.sh
Delete all Confluent Platform internal topics in CCloud, including topics used for Confluent Control Center, Kafka Connect, KSQL, and Confluent Schema Registry.
$ ./ccloud-delete-all-topics.sh

