
Monitor and Track Metrics in Docker with JMX in Confluent Platform
You can monitor Confluent Platform deployments by using Java Management Extensions (JMX) and MBeans.
Note
Confluent offers some alternatives to using JMX monitoring.
Health+: Consider monitoring and managing your environment with Monitor Confluent Platform with Health+. Ensure the health of your clusters and minimize business disruption with intelligent alerts, monitoring, and proactive support based on best practices created by the inventors of Kafka.
Confluent Control Center: You can deploy Confluent Control Center for out-of-the-box Kafka cluster monitoring so you don’t have to build your own monitoring system.
Configure JMX environment variables
JMX is enabled for Apache Kafka® by default. To expose JMX on a Kafka container, set KAFKA_JMX_PORT and KAFKA_JMX_HOSTNAME in your Compose file, Dockerfile, or docker run command. For a complete example, see Run Kafka with JMX enabled.
KAFKA_JMX_PORTThe JMX Port.
KAFKA_JMX_HOSTNAMEThe hostname associated with locally created remote objects.
KAFKA_JMX_OPTSJMX options. Use this variable to override the default JMX options such as whether authentication is enabled. A JMX client must be able to connect to the
java.rmi.server.hostnamespecified in theKAFKA_JMX_OPTS.The default options are set as follows:
-Djava.rmi.server.hostname=127.0.0.1 -Dcom.sun.management.jmxremote=true -Dcom.sun.management.jmxremote.authenticate=false -Dcom.sun.management.jmxremote.ssl=false
The default for a bridged network is the bridged IP address, which means that you can only connect to it from another Docker container. For the host network, this is the IP that the hostname on the host resolves to. Use
hostname -ito see what the hostname is set to in the Docker container. If you have more than one network configured for the container,hostname -igives you all the IPs, and the default is the first IP address.
Available JMX MBeans
For the list of JMX MBeans you can monitor on Kafka, see Monitor Kafka with JMX in Confluent Platform.
Configure security
Password authentication and TLS/SSL are disabled for JMX by default in Kafka, however in a production environment, you should enable authentication and TLS/SSL to prevent unauthorized users from accessing your brokers.
You override the default JMX settings to enable authentication and SSL.
To learn about how to secure JMX, follow the TLS/SSL and authentication sections in Monitoring and Management Using JMX Technology.
Run Kafka with JMX enabled
To expose JMX on a Kafka container, add KAFKA_JMX_PORT and KAFKA_JMX_HOSTNAME to your docker run command or Compose file.
The following Docker run command starts Kafka with JMX configured:
docker run -d \
--name=kafka-jmx \
-h kafka-jmx \
-p 9101:9101 \
-e KAFKA_NODE_ID=1 \
-e KAFKA_LISTENER_SECURITY_PROTOCOL_MAP='CONTROLLER:PLAINTEXT,PLAINTEXT:PLAINTEXT,PLAINTEXT_HOST:PLAINTEXT' \
-e KAFKA_ADVERTISED_LISTENERS='PLAINTEXT://kafka-jmx:29092,PLAINTEXT_HOST://localhost:9092' \
-e KAFKA_JMX_PORT=9101 \
-e KAFKA_JMX_HOSTNAME=localhost \
-e KAFKA_PROCESS_ROLES='broker,controller' \
-e KAFKA_OFFSETS_TOPIC_REPLICATION_FACTOR=1 \
-e KAFKA_CONTROLLER_QUORUM_VOTERS='1@kafka-jmx:29093' \
-e KAFKA_LISTENERS='PLAINTEXT://kafka-jmx:29092,CONTROLLER://kafka-jmx:29093,PLAINTEXT_HOST://0.0.0.0:9092' \
-e KAFKA_INTER_BROKER_LISTENER_NAME='PLAINTEXT' \
-e KAFKA_CONTROLLER_LISTENER_NAMES='CONTROLLER' \
-e CLUSTER_ID='MkU3OEVBNTcwNTJENDM2Qk' \
confluentinc/cp-kafka:8.3.0
View MBeans with JConsole
To confirm you have successfully configured JMX monitoring with a Docker container, you can start JConsole, a command-line utility provided with Java.
To start JConsole, use the jconsole command, and connect to the Kafka process.
For this example, the JMX settings for a Docker container running locally might look like the following:
KAFKA_JMX_PORT: 9101
KAFKA_JMX_HOSTNAME: localhost
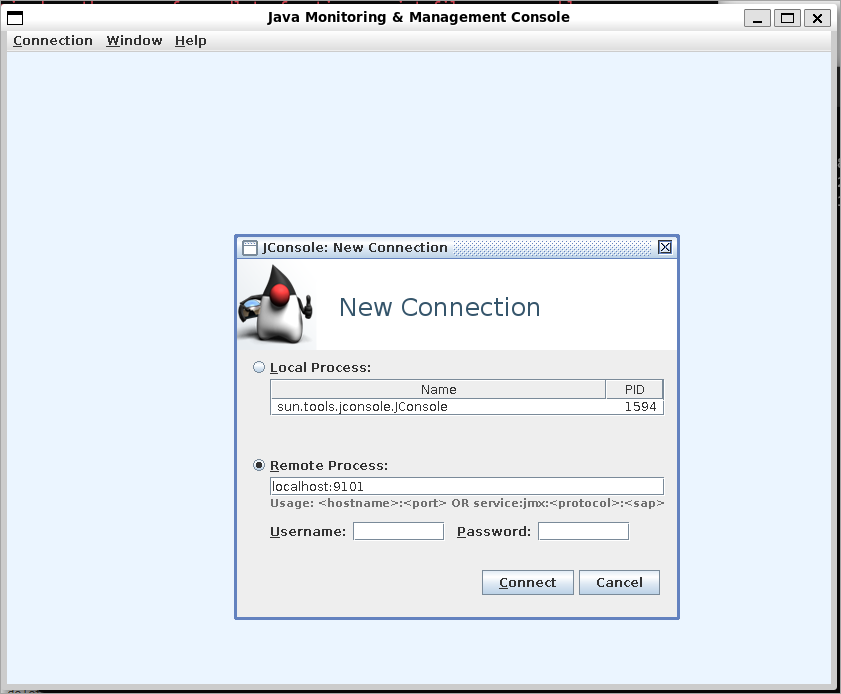
After JConsole starts, under Remote Process, enter the hostname and port you specified in your JMX configuration, and click Connect.
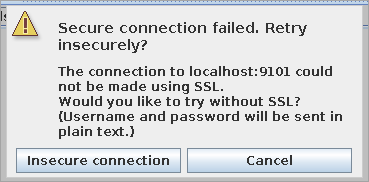
If you have not configured authentication, you may be prompted to make an Insecure connection.
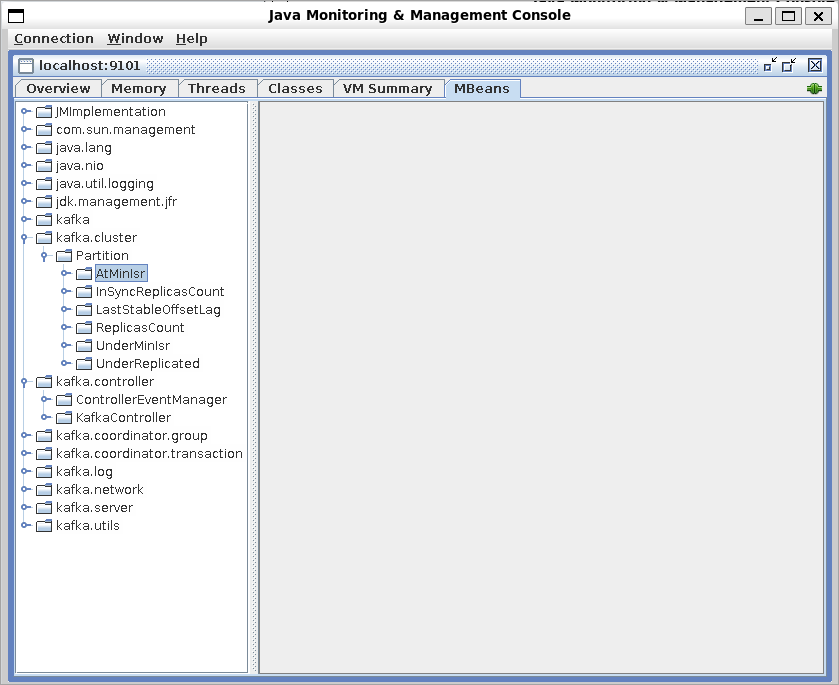
After JConsole is running, you can select the MBeans tab and expand the folders to see the JMX events and attributes for those events.
Configure other Confluent Platform components
Use the following environment variables to override the default JMX options such as authentication settings for other Confluent Platform components.
Component | Environment Variable |
|---|---|
Confluent Control Center | CONTROL_CENTER_JMX_OPTS |
REST Proxy | KAFKAREST_JMX_OPTS |
ksqlDB | KSQL_JMX_OPTS |
Rebalancer | REBALANCER_JMX_OPTS |
Schema Registry | SCHEMA_REGISTRY_JMX_OPTS |