
Monitor and Manage Flink SQL Statements in Confluent Cloud for Apache Flink
You start a stream-processing application on Confluent Cloud for Apache Flink® by running a SQL statement. After a statement is running, you can monitor its progress by using the Confluent Cloud Console. You can also set up integrations with monitoring services such as Prometheus and Datadog.
View and monitor statements in Cloud Console
Cloud Console shows details about your statements on the Flink page.
If you don’t have running statements currently, run a SQL query like INSERT INTO FROM SELECT in the Flink SQL shell or in a workspace.
Log in to the Confluent Cloud Console.
Navigate to the Environments page.
Click the tile that has the environment where your Flink compute pools run.
Click Flink, and in the Flink page, click Flink statements.
The Statements list opens.
You can use the Filter options on the page to identify the statements you want to view.
The following information is available in the Flink statements table to help you monitor your statements.
Field
Description
Flink Statement Name
The name of the statement. The name is populated automatically when a statement is submitted. You can set the name by using the SET command.
Status
The statement status represents what is currently happening with the statement. These are the status values:
Pending: The statement has been submitted and Flink is preparing to start running the statement.
Running: Flink is actively running the statement.
Completed: The statement has completed all of its work.
Deleting: The statement is being deleted.
Failed: The statement has encountered an error and is no longer running.
Degraded: The statement appears unhealthy, for example, no transactions have been committed for a long time, or the statement has been restarting frequently.
Stopping: The statement is about to be stopped.
Stopped: The statement has been stopped and is no longer running.
Statement Type
The type of SQL function that is used in the statement.
Statement CFU
The number of CFUs that the statement is consuming.
State size (GB)
The size of the state used by the statement, in gigabytes.
Created
Indicates when the statement started running. If you stop and resume the statement, the Created date shows the date when the statement was first submitted.
Messages Behind
The Consumer Lag of the statement. You are also shown an indicator of whether the back pressure is increasing, decreasing, or if the back pressure is being maintained at a stable rate. Ideally, the Messages Behind metric should be as close to zero as possible. A low, close-to-zero consumer lag is the best indicator that your statement is running smoothly and keeping up with all of its inputs. A growing consumer lag indicates there is a problem.
Messages in
The count of Messages in per minute which represents the rate at which records are read. You also have a watermark for the messages read. The watermark displayed in the Flink statements table is the minimum watermark from the source(s) in the query.
Messages out
The count of Messages out per minute which represents the rate at which records are written. You also have a watermark for the messages written. The watermark displayed in the Flink statements table is the minimum watermark from the sink(s) in the query.
Account
The name of the user account or service account the statement is running with.
When you click on a particular statement, a detailed side panel opens. The panel provides detailed information on the statement at a more granular level, showing how the statement reads messages from sources and writes them to sinks. The panel shows watermarks for each individual source and sink table, along with the statement’s catalog, database, local time zone, and Scaling status.
The SQL Content section shows the code used to generate the statement.
The panel also contains visual interactive graphs of statement’s performance over time. There are charts for # Messages behind, Messages in per minute, and Messages out per minute.
Manage statements in Cloud Console
Cloud Console gives you actions to manage your statements on the Flink page.
In the statement list, click the checkbox next to one of your statements to select it.
Click Actions.
A menu opens, showing options for managing the statement’s status. You can select Stop statement, Resume statement, or Delete statement.
Flink metrics integrations
Confluent Cloud for Apache Flink supports metrics integrations with services such as Prometheus and Datadog.
If you don’t have running statements currently, run a SQL query such as INSERT INTO FROM SELECT in the Flink SQL shell or in a workspace.
Log in to the Confluent Cloud Console.
Open the Administration menu (
 ) and select Metrics to open the Metrics integration page.
In the Explore available metrics section, click the Metric dropdown.
Scroll until you find the Flink compute pool and Flink statement metrics, for example, Messages behind. This list doesn’t include all available metrics. For a full list of available metrics, see Metrics API Reference.
Click the Resource dropdown and select the corresponding compute pool or statement that you want to monitor.
A graph showing the most recent data for your selected Flink metric displays.
Click New integration to export your metrics to a monitoring service. For more information, see Integrate Confluent Cloud Metrics API with Third-Party Monitoring Tools.
For an introductory example of setting up monitoring with Grafana and Prometheus, see the Flink Monitoring repository.
Error handling and recovery
When errors occur during the runtime of a statement, Confluent Cloud for Apache Flink handles them differently depending on the type of error:
Statement failures: When a statement encounters an error that prevents it from continuing, it moves to the FAILED state. FAILED statements do not consume any CFUs. You see an error message in the statement details explaining what went wrong.
Common causes of statement failures include:
Data format issues (deserialization errors).
Query logic problems (division by zero, invalid operations).
Missing or inaccessible topics.
Insufficient permissions.
For deserialization errors, you can use custom error handling rules to skip problematic records or send them to a dead letter queue instead of failing the entire statement.
You can resume FAILED statements, but you must fix the underlying issue first to prevent the statement from failing again immediately. For more information on evolving statements, see Schema and Statement Evolution.
Statement degradation: When a statement encounters issues but could continue running, it can enter the DEGRADED state. For more information, see Degraded statements.
Degraded statements
When a statement enters the DEGRADED state, it means the statement is unable to make consistent progress. There are two scenarios that can cause this:
Query-related issues: When inefficient query logic or insufficient compute resources cause the degradation, you see an error message like:
Your Flink statement has entered a Degraded state because it is unable to make consistent progress. This can be caused by inefficient query logic or insufficient compute resources. Please review your statement for performance bottlenecks. If the issue persists, consider scaling your compute pool or contacting Confluent support for assistance.
System-related issues: When an unknown or internal system error causes the degradation, you see this error message:
An internal system error has been detected that requires attention from our
engineering team. We are actively working to resolve this issue. No action
is required on your part at this time. If the issue persists, please contact
Confluent support for further assistance.
DEGRADED statements continue to consume CFUs. For query-related issues, see Resolve Common Statement Problems for a troubleshooting guide. You can also use the Query Profiler to diagnose performance issues on degraded statements.
Custom error handling rules
Confluent Cloud for Apache Flink supports custom error handling for deserialization errors using the error-handling.mode table property. You can choose to fail, ignore, or log problematic records to a Dead Letter Queue (DLQ). When set to log, Flink sends errors to a DLQ table.
Note
When configuring a DLQ, ensure you have the necessary RBAC roles and ACL permissions for both the source and DLQ tables. For more information, see Dead Letter Queue permissions.
For detailed setup instructions, including how to pre-create a DLQ with custom topic configuration, see Configure a Dead Letter Queue.
Notifications
Confluent Cloud for Apache Flink integrates with Notifications for Confluent Cloud. The following notifications are available for Flink statements. They apply only to background Data Manipulation Language (DML) statements such as INSERT INTO, EXECUTE STATEMENT SET, or CREATE TABLE AS.
Statement failure: This notification fires when a statement transitions from
RUNNINGtoFAILED. A statement transitions toFAILEDon exceptions that Confluent classifies asUSER, as opposed toSYSTEMexceptions.Statement degraded: This notification fires when a statement transitions from
RUNNINGtoDEGRADED.Statement stuck in pending: This notification fires when a newly submitted statement stays in
PENDINGfor a long time. The time period for a statement to be considered stuck in thePENDINGstate depends on the cloud provider that’s running your Flink statements:AWS: 10 minutes
Azure: 30 minutes
Google Cloud: 10 minutes
Statement auto-stopped: This notification fires when a statement moves into
STOPPEDbecause a user deleted the compute pool it is using.State size limit reached: This notification fires when a statement reaches 80% of its soft or hard limit for state size. For more information, see Limits on state size.
Best practices for alerting
Use the Metrics API and Notifications for Confluent Cloud to monitor your compute pools and statements over time. You should monitor and configure alerts for the following conditions:
- Per user-created compute pool.
Alert on exhausted compute pools by comparing the current CFUs (
io.confluent.flink/compute_pool_utilization/current_cfus) to the maximum CFUs of the pool (io.confluent.flink/compute_pool_utilization/cfu_limit).Flink statement stuck in pending notifications also indicate compute-pool exhaustion.
These metrics apply to user-created compute pools with configured CFU limits. For more information about user-created pools, see Compute Pools in Confluent Cloud for Apache Flink.
- Per statement.
Alert on statement failures (see Notifications).
Alert on statement degradation (see Notifications).
Alert on an increase of “Messages Behind”/”Consumer Lag” (metric name:
io.confluent.flink/pending_records) over an extended period of time, for example > 10 minutes; your mileage might vary. Confluent Cloud for Apache Flink does not appear as a consumer in the regular consumer lag monitoring feature in Confluent Cloud, because it uses theassign()method.(Optional) Alert on an increase of the difference between the output (
io.confluent.flink/current_output_watermark_ms) and input watermark (io.confluent.flink/current_input_watermark_ms). The input watermark corresponds to the time up to which the input data is complete, and the output watermark corresponds to the time up to which the output data is complete. This difference can be considered as a measure of the amount of data that’s currently “in-flight”. Depending on the logic of the statement, different patterns are expected. For example, for a tumbling event-time window, expect an increasing difference until the window is fired, at which point the difference drops to zero and starts increasing again.
Statement logging
Confluent Cloud for Apache Flink supports event logging for statements in Confluent Cloud Console.
The following screenshot shows the event log for a statement that failed due to a division by zero error. The event log is available in the Logs tab of the statement details page.
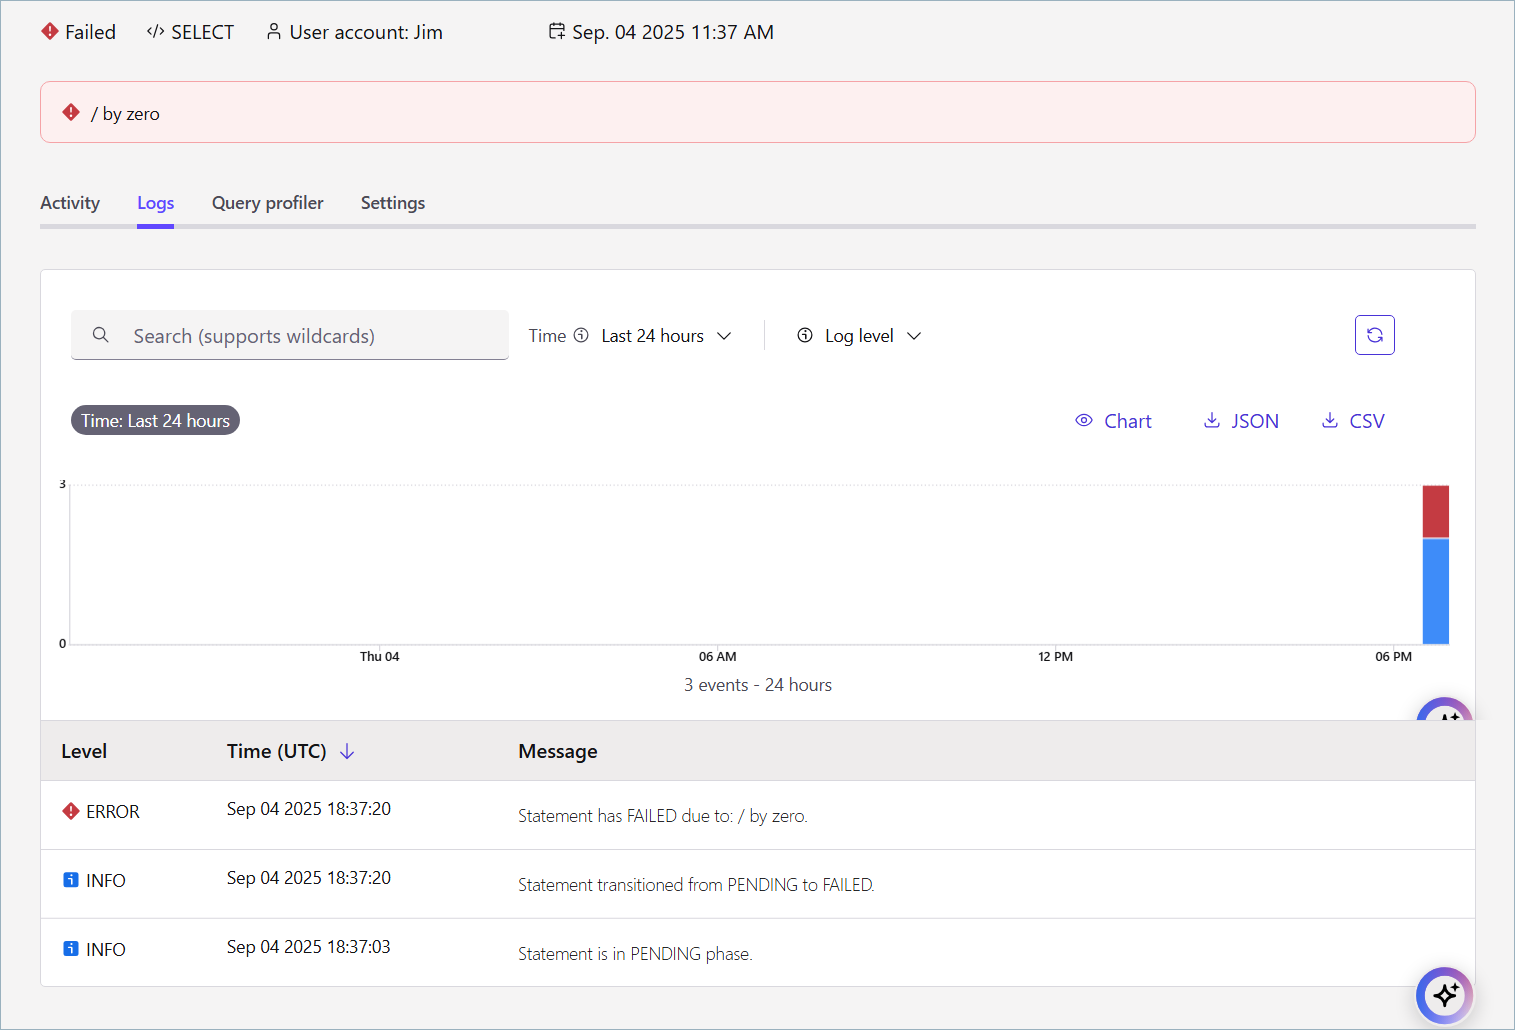
The statement event log page provides logs for the following events:
Changes of lifecycle, for example, PENDING or RUNNING. For more information, see Statement lifecycle.
Scaling status changes, for example, OK or Pending Scale Up. For more information, see Scaling status.
Autopilot scaling decisions, for example, Autopilot is requesting to scale the statement to [New CFU Value] CFUs. or Autopilot is unable to scale up the statement because the compute pool’s CFU limit has been reached.
Errors and warnings.
The Cloud Console enables the following operations:
Search: Search for specific log messages. Wildcards are supported.
Time range: Select the time range for the log events.
Log level: Filter logs events by severity: Error, Warning, Info.
Chart: View the log events in a chart.
Download: Save log events as a CSV or JSON file.
UDF logging
The statement log page also shows log messages from user-defined functions (UDFs). For more information, see Log Debug Messages in UDFs.