
Manage Custom Connectors for Confluent Cloud
To manage running connectors, refer to the following sections.
Search for a custom connector
To find a custom connector, first show all connectors, and then select Cloud custom in the Filter by: Deployment dropdown list.
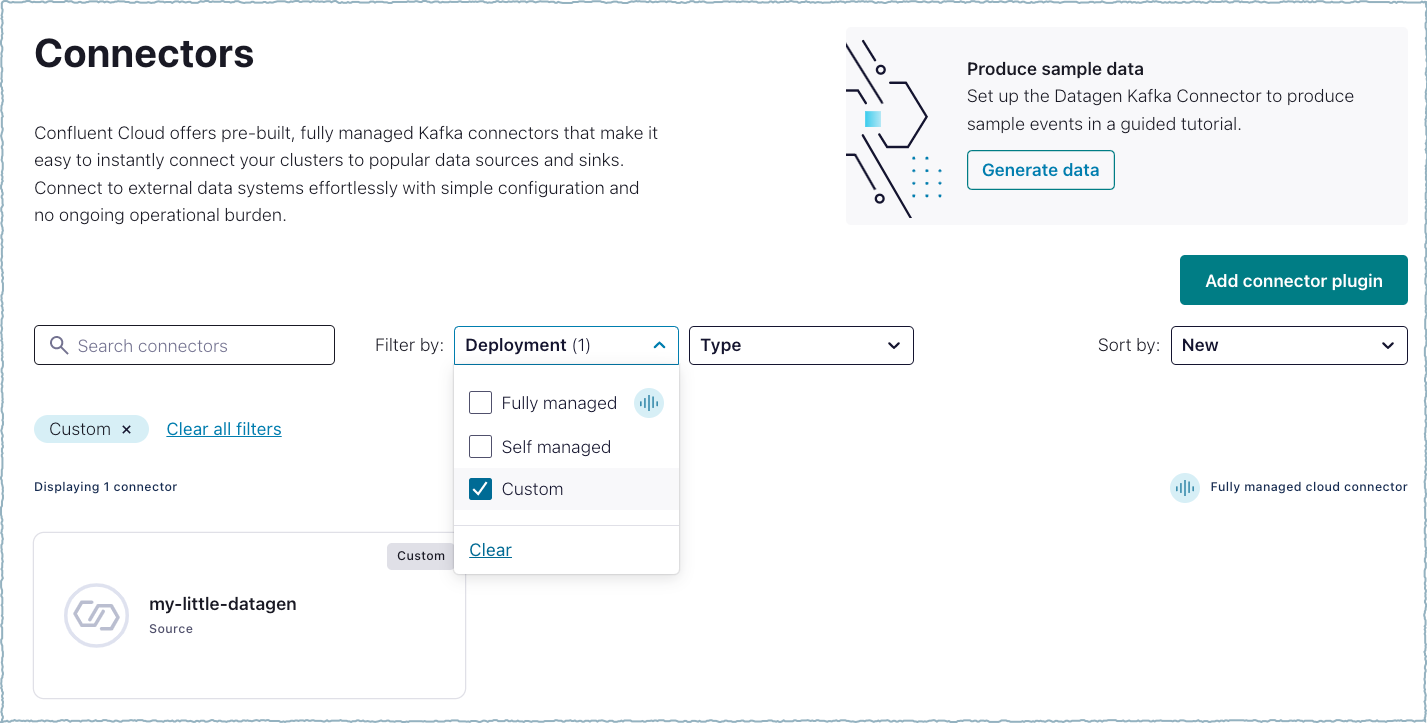
Filter by deployment
Get notifications
Confluent Cloud provides out-of-the-box notification capability. You can be notified when a connector status changes to RUNNING or FAILED. For more information, see Notifications for Confluent Cloud.
Modify a custom connector configuration
Complete the following steps to modify a custom connector configuration.
Open the connector Overview page.
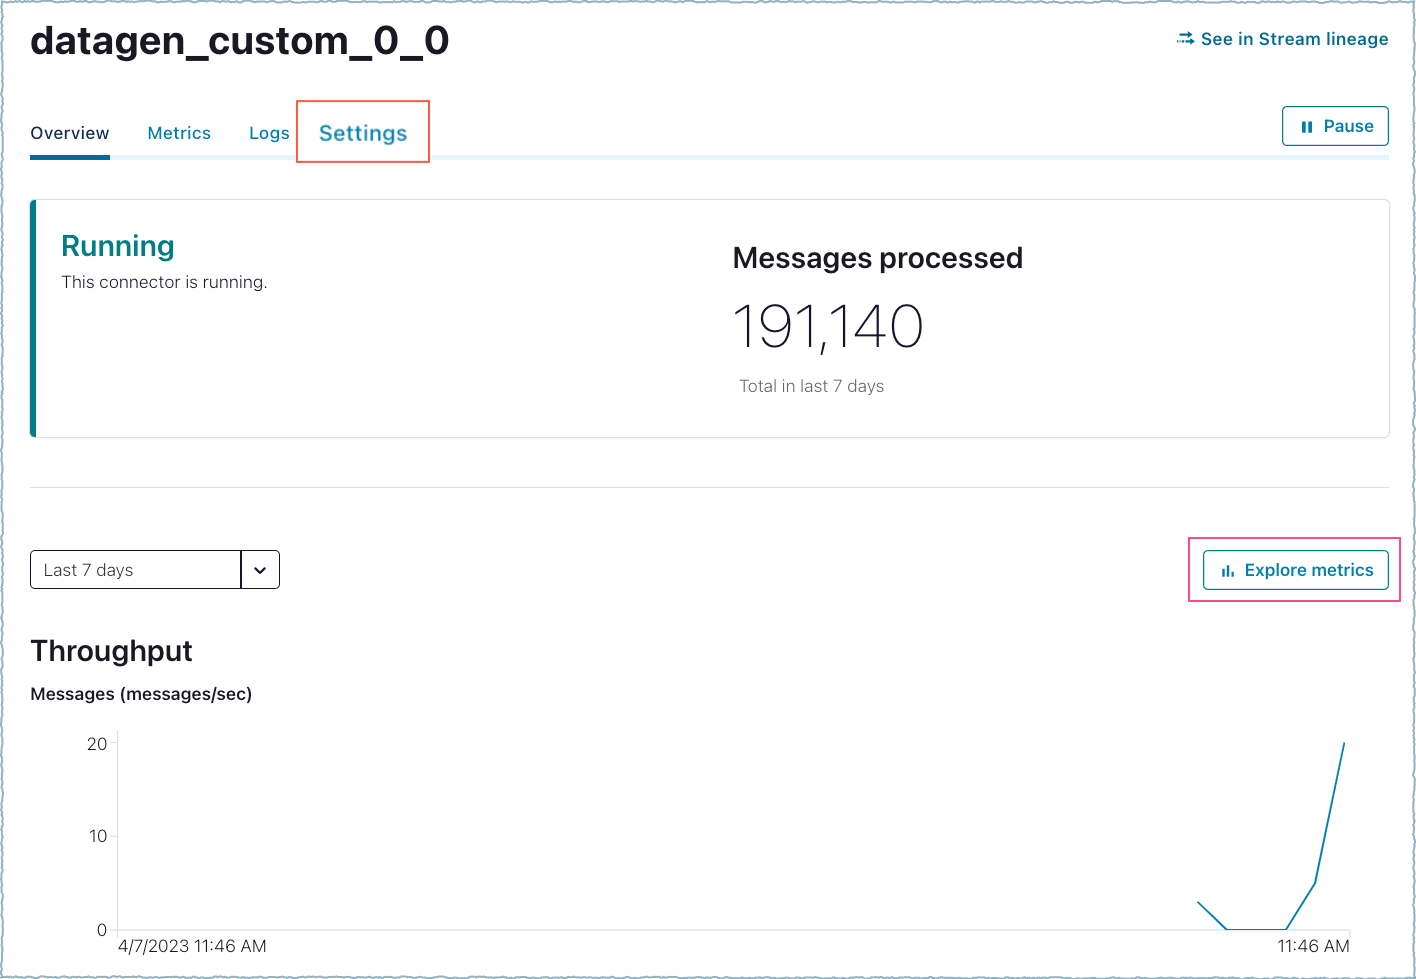
Connector overview
Go to Settings. You can update the number of tasks, change networking endpoints, update credentials, and change or add the connector configuration properties.
To update the custom connector configuration, click the edit icon under Custom configuration.
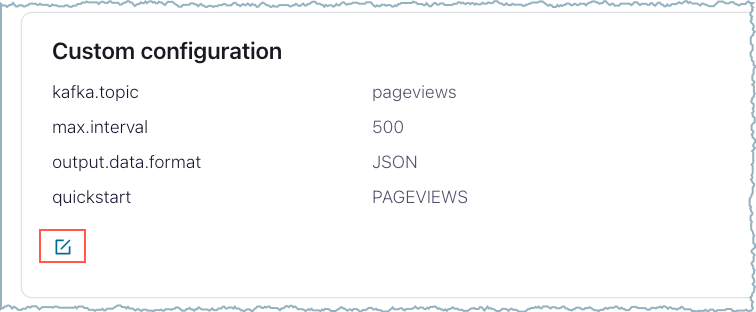
Edit custom configuration
Modify a property or click Add key/value pair and add a new property. You can also modify the JSON configuration directly on the JSON tab.
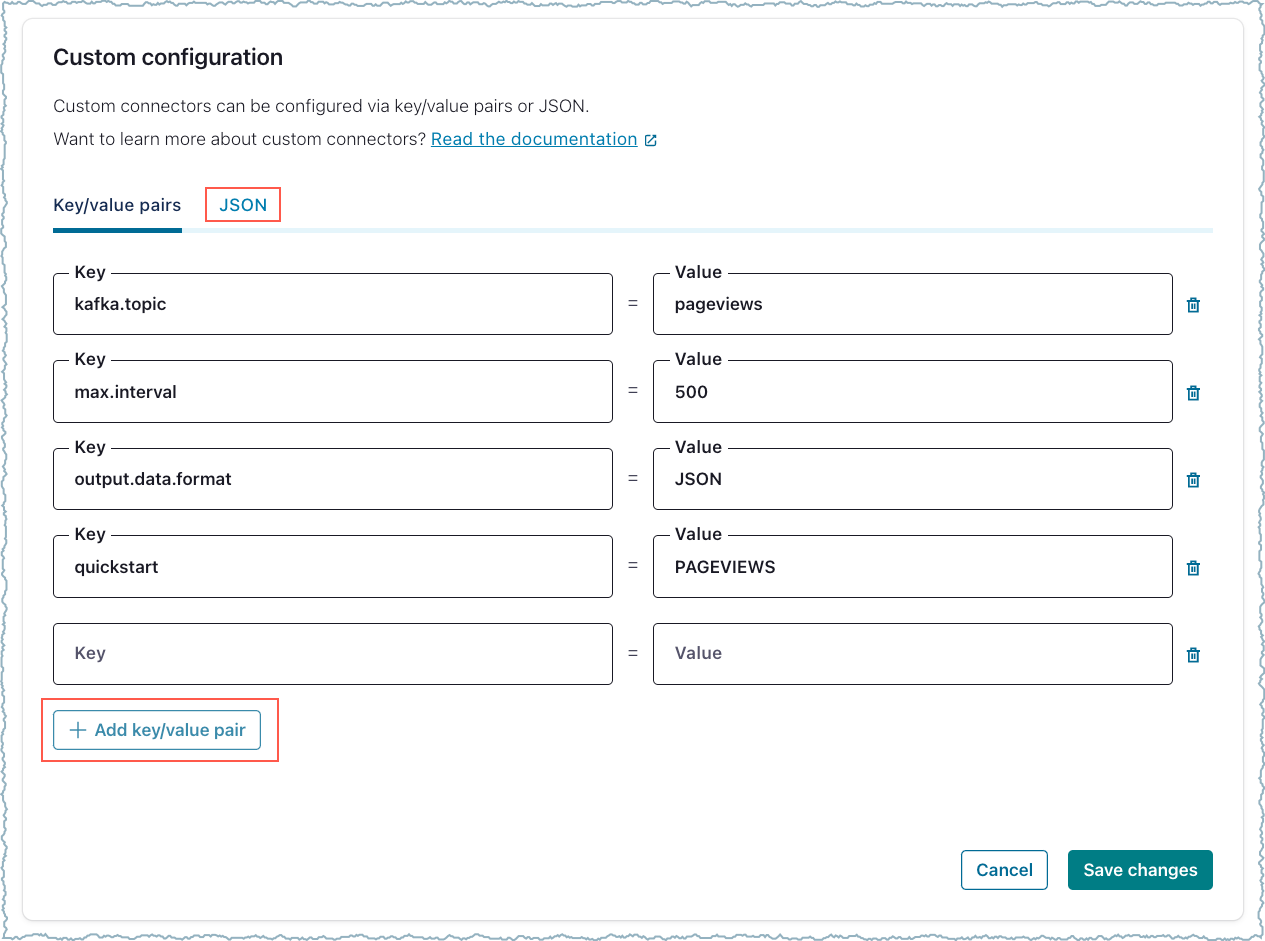
Update Key/value pairs
Click Save changes and then click Apply changes. The connector restarts using the updated configuration.
Override configuration properties
By default, connect-level Kafka clients inherit their client configurations from the worker properties, but customers can optionally provide producer.override., consumer.override., and admin.override. connector properties to override worker-level settings. The following tabs list the configuration overrides you can use with custom connectors.
connections.max.idle.ms
default.api.timeout.ms
receive.buffer.bytes
reconnect.backoff.max.ms
reconnect.backoff.ms
request.timeout.ms
retries
retry.backoff.ms
send.buffer.bytes
For example, "admin.override.retry.backoff.ms": "300". For property definitions, see Admin Configuration Properties.
auto.offset.reset
connections.max.idle.ms
default.api.timeout.ms
fetch.max.bytes
fetch.max.wait.ms
fetch.min.bytes
heartbeat.interval.ms
max.partition.fetch.bytes
max.poll.interval.ms
max.poll.records
receive.buffer.bytes
reconnect.backoff.max.ms
reconnect.backoff.ms
request.timeout.ms
retry.backoff.ms
session.timeout.ms
For example, "consumer.override.auto.offset.reset": "latest". For property definitions, see Consumer Configuration Properties.
acks
batch.size
buffer.memory
compression.type
connections.max.idle.ms
delivery.timeout.ms
enable.idempotence
linger.ms
max.block.ms
max.in.flight.requests.per.connection
max.request.size
receive.buffer.bytes
reconnect.backoff.max.ms
reconnect.backoff.ms
request.timeout.ms
retries
retry.backoff.ms
For example, "producer.override.max.request.size": "5000". For property definitions, see Producer Configuration Properties.
Update networking endpoints
Complete the following steps to update egress endpoints. You can use the fully-qualified domain name (FQDN) or IP address when updating networking endpoints.
Open the connector Overview page.
Connector overview
Go to Settings. You can update the number of tasks, change networking endpoints, update credentials, and change or add the connector configuration properties.
To update the custom connector configuration, click the edit icon under Networking.

Edit egress endpoints
Update an endpoint or click Add connection endpoint and add a new endpoint. For details about egress endpoints, see endpoints.
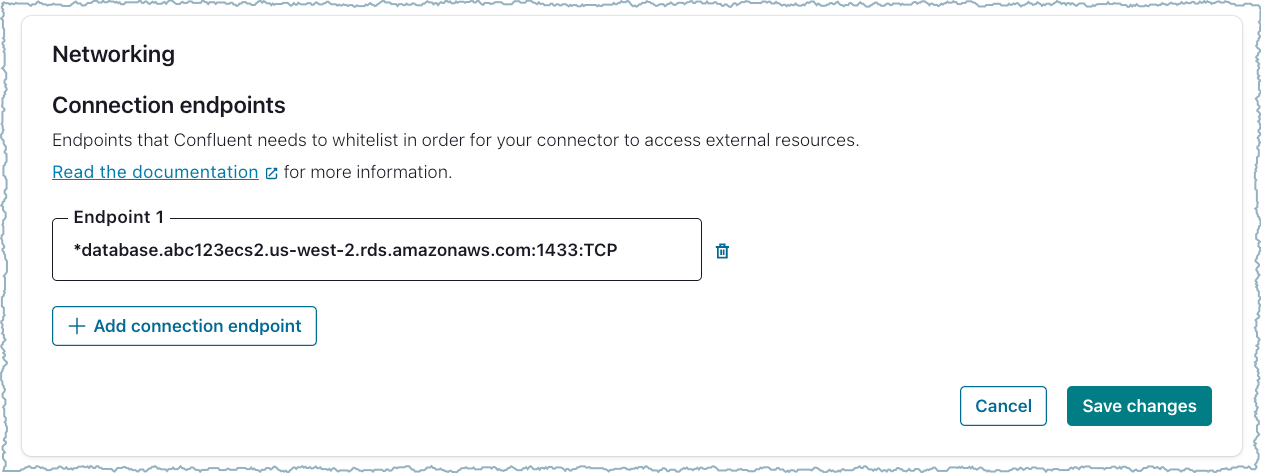
Update endpoints
Click Save changes and then click Apply changes. The connector restarts using the updated endpoints.
Custom connector logs
You can view Confluent Cloud custom connector events directly through the Confluent Cloud Console or Confluent CLI.
Using Confluent Cloud Console
The logs provide a centralized view for monitoring the operational health and activity of your Confluent Cloud custom connectors. You can see the customer connector logs from:
Logs tab
App log topic
View from logs tab
To view log messages, open the connector Overview page and click Logs.
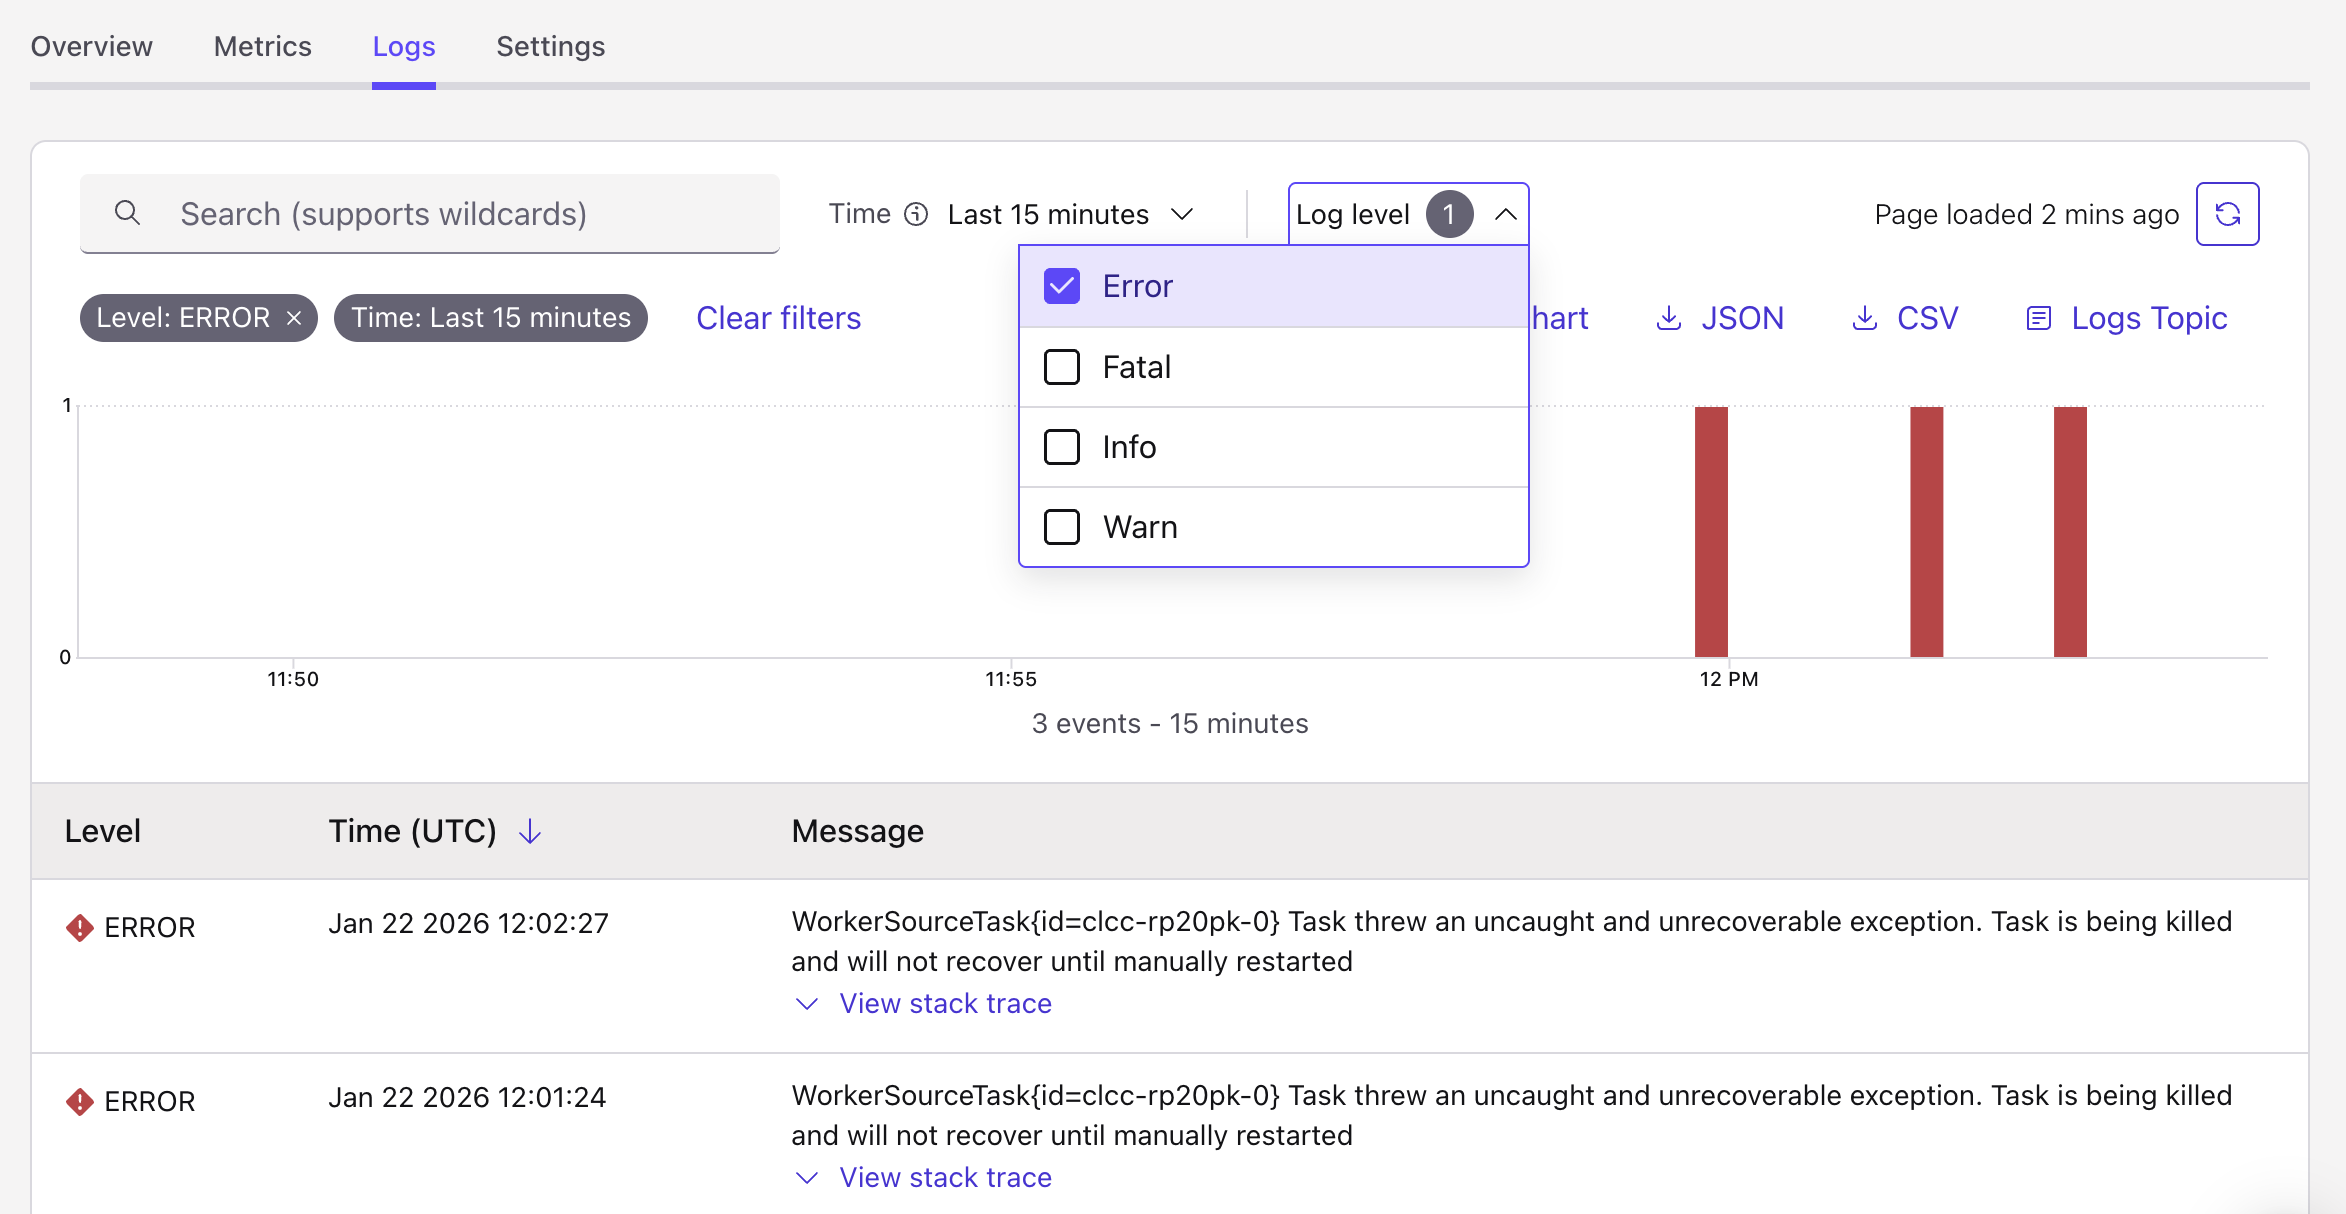
All log messages are displayed.
The messages timestamp in the log can be in local time or UTC.
If you want to view the full stack trace for an error message, expand View stack trace.
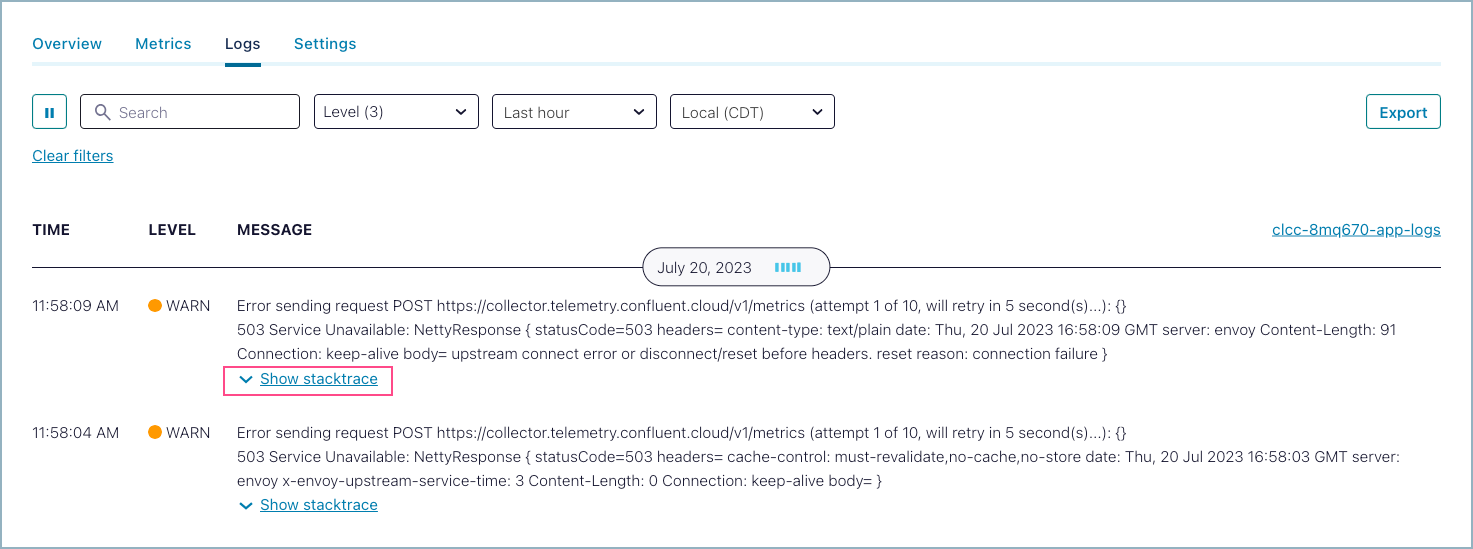
Error Logs with stack trace
If you want to download the log messages, click JSON or CSV to export the file in the respective formats.
If you want to navigate to the logs topic of the connector, click Logs Topic.
View in app log topic
When you launch a custom connector, Confluent Cloud creates a log topic file with the name clcc-<connector-ID>-app-logs. The log topic captures the following log messages:
Connector code log messages.
Log messages emitted by code the connector calls.
Connect worker process log messages.
Important
Customers are responsible for all charges related to using the app log topic with a custom connector. For billing details, see Custom connector cluster.
To view messages in the log topic, open the Topics page and click the log topic name.
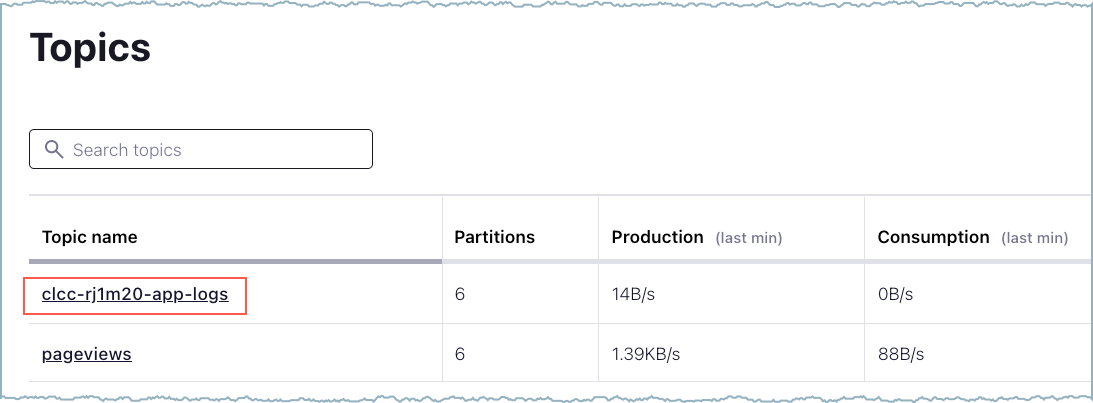
Select log topic
Click Messages to view log topic messages.
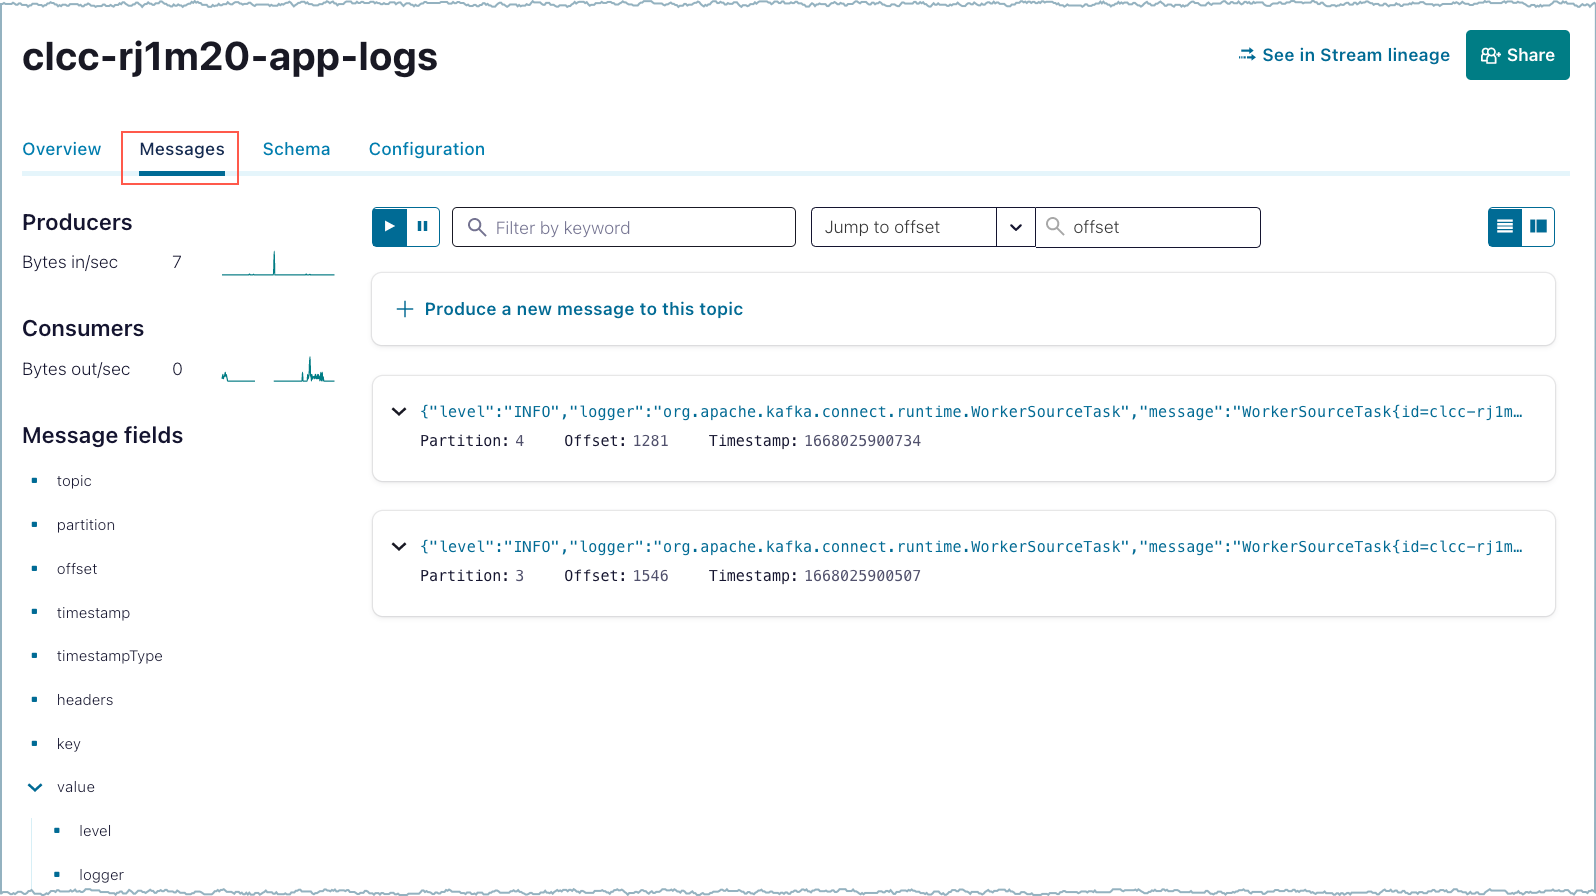
View log topic messages
You can also click the message timestamp to view more log details.
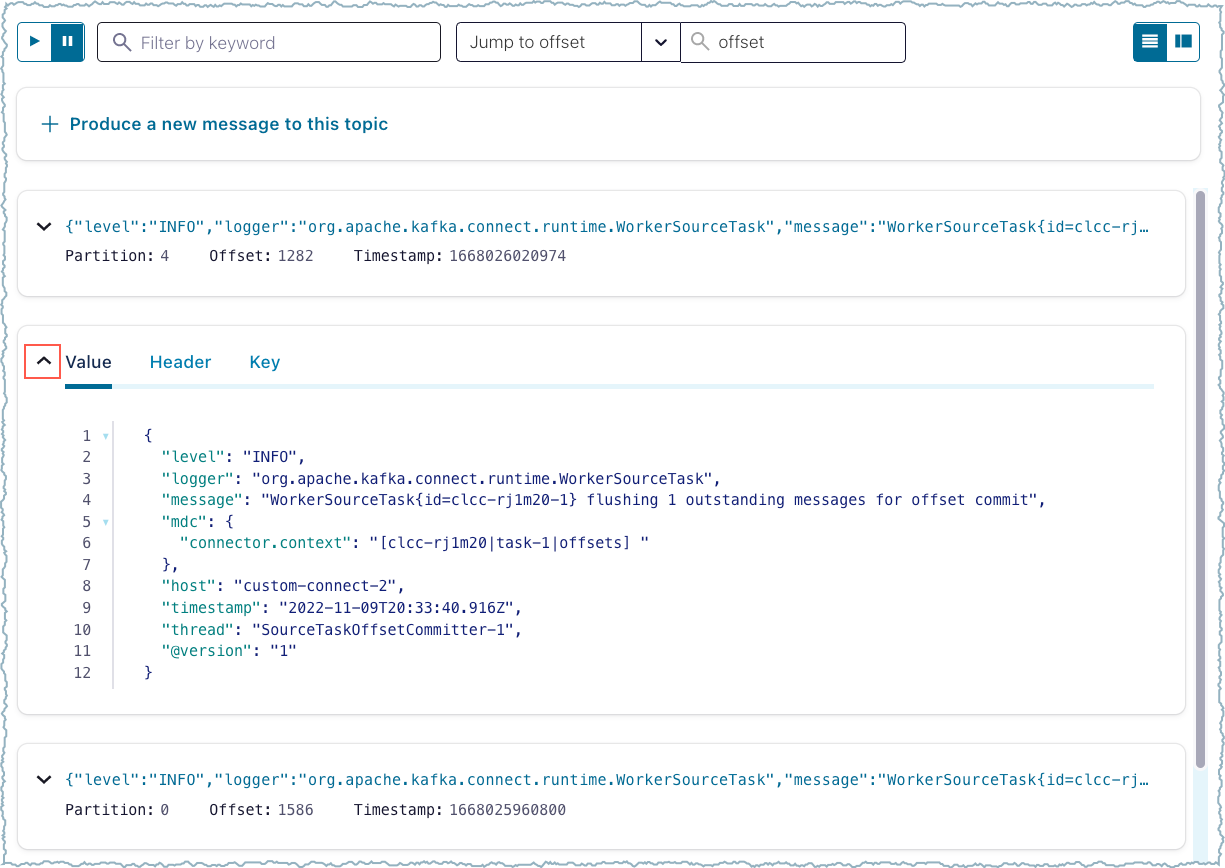
View message details
Using Confluent CLI
The Confluent CLI allows you to view connector logs with various search criteria, similar to the Confluent Cloud Console. Additionally, it allows you to store logs in an output file.
For more information, see Connect Logs CLI.
Limitations
A rate limit of 5 requests/minute applies per connector.
Log data can be queried only for the past 3 days.
Query examples
The following examples show how to view connector log events using the Confluent Cloud CLI.
The example assumes the following:
You have the Confluent CLI installed and configured for your environment.
You have the Connector ID (for example,
lcc-123456) for the connector whose logs you want to view.
Query logs by time range: Allows you to query connector logs with a specific log level within a defined time window.
confluent connect logs <connector-id> --level <log-level> --start-time "<start-time>" --end-time "<end-time>"
For example, to query for
ERRORlevel logs for connectorlcc-123456between February 1, 2025, 00:00:00Z and February 1, 2025, 23:59:59Z:confluent connect logs lcc-123456 --level ERROR --start-time "2025-02-01T00:00:00Z" --end-time "2025-02-01T23:59:59Z"
Example output:
Found 2 log entries for connector lcc-123456:

          Timestamp         | Level  | Task ID |            Message                | Exception
---------------------------+--------+---------+-----------------------------------+------------------------------------------------------
   2025-02-01T00:00:00.757Z | ERROR  | task-0  | WorkerSourceTask{id=lcc-123456-0} | org.apache.kafka.connect.errors.ConnectException: ...
                            |        |         | Task threw an uncaught and        |
                            |        |         | unrecoverable exception. Task is  |
                            |        |         | being killed and will not recover |
                            |        |         | until manually restarted          |
   2025-02-01T00:00:00.761Z | ERROR  | task-0  | WorkerSourceTask{id=lcc-123456-0} | org.apache.kafka.connect.errors.ConnectException: ...
                            |        |         | Task threw an uncaught and        |
                            |        |         | unrecoverable exception. Task is  |
                            |        |         | being killed and will not recover |
                            |        |         | until manually restarted          |
Filter by multiple log levels: Lets you query connector logs by specifying multiple log levels using the | (OR) operator within the defined time window.
confluent connect logs <connector-id> --level "<log-level-1>|<log-level-2>" --start-time "<start-time>" --end-time "<end-time>"
For example, to query for
ERRORorINFOlevel logs for connectorlcc-123456between February 1, 2025, 00:00:00Z and February 1, 2025, 23:59:59Z:confluent connect logs lcc-123456 --level "ERROR|INFO" --start-time "2025-02-01T00:00:00Z" --end-time "2025-02-01T23:59:59Z"
Example output:
Found 2 log entries for connector lcc-123456:

          Timestamp         | Level  | Task ID |            Message                | Exception
---------------------------+--------+---------+-----------------------------------+------------------------------------------------------
   2025-02-01T00:00:00.757Z | INFO   | task-0  | WorkerSourceTask{id=lcc-123456-0} |
                            |        |         | Committing offsets for 130        |
                            |        |         | acknowledged messages             |
   2025-02-01T00:00:00.761Z | ERROR  | task-0  | WorkerSourceTask{id=lcc-123456-0} | org.apache.kafka.connect.errors.ConnectException: ...
                            |        |         | Task threw an uncaught and        |
                            |        |         | unrecoverable exception. Task is  |
                            |        |         | being killed and will not recover |
                            |        |         | until manually restarted          |
Search for specific text and save to a file: Allows you to query connector logs with a specific log level and search for particular text within the logs. You can also save the results to an output file. You can use regular expressions for the search text.
confluent connect logs <connector-id> --level <log-level> --search-text "<search-term>" --start-time "<start-time>" --end-time "<end-time>" --output-file <output-filename>
For example, to query for
ERRORlevel logs for connectorlcc-123456containing “example error” between February 1, 2025, 00:00:00Z and February 1, 2025, 23:59:59Z, and save them toerrors.json:confluent connect logs lcc-123456 --level "ERROR" --search-text "example error" --start-time "2025-02-01T00:00:00Z" --end-time "2025-02-01T23:59:59Z" --output-file errors.json
Example output:
Appended 1 log entries to file: errors.json
$ cat errors.json

{
 "Timestamp":"2025-02-01T00:00:00.757Z",
 "Level":"ERROR","TaskId":"task-0",
 "Message":"example error 1",
 "Exception":""
}
Example with a regular expression
"exa*":confluent connect logs lcc-123456 --level "ERROR" --search-text "exa*" --start-time "2025-02-01T00:00:00Z" --end-time "2025-02-01T23:59:59Z" --output-file errors.json
Example output:
Appended 1 log entries to file: errors.json
$ cat errors.json

{
 "Timestamp":"2025-02-01T00:00:00.757Z",
 "Level":"ERROR","TaskId":"task-0",
 "Message":"example error 1",
 "Exception":""
}
Navigate through log pages: Allows you to query subsequent pages of connector logs for the same query by using the
--nextflag. Continue executing the command with this flag untilNo logs found for the current queryis displayed.confluent connect logs <connector-id> --level <log-level> --start-time "<start-time>" --end-time "<end-time>" --next
For example, to navigate to the next page of
ERRORlevel logs for connectorlcc-123456between February 1, 2025, 00:00:00Z and February 1, 2025, 23:59:59Z:confluent connect logs lcc-123456 --level ERROR --start-time "2025-02-01T00:00:00Z" --end-time "2025-02-01T23:59:59Z" --next
Found 2 log entries for connector lcc-123456:

          Timestamp         | Level  | Task ID |            Message                | Exception
---------------------------+--------+---------+-----------------------------------+------------------------------------------------------
   2025-02-01T23:59:59.850Z | ERROR  | task-0  | WorkerSourceTask{id=lcc-123456-0} | org.apache.kafka.connect.errors.ConnectException: ...
                            |        |         | Task threw an uncaught and        |
                            |        |         | unrecoverable exception. Task is  |
                            |        |         | being killed and will not recover |
                            |        |         | until manually restarted          |
   2025-02-01T23:59:59.860Z | ERROR  | task-0  | WorkerSourceTask{id=lcc-123456-0} | org.apache.kafka.connect.errors.ConnectException: ...
                            |        |         | Task threw an uncaught and        |
                            |        |         | unrecoverable exception. Task is  |
                            |        |         | being killed and will not recover |
                            |        |         | until manually restarted          |
Export log messages
The connector stores log messages in a Kafka topic. You can export log data using any of the following options:
Export logs using a Confluent connector: For example the Elasticsearch Service Sink connector for Confluent Cloud, or the Elasticsearch Service Sink connector for Confluent Platform can export logs to Elasticsearch. Several additional connectors are available that may also be used for exporting logs.
Create a custom integration using the Kafka REST API for topics to get log messages to a destination logs service.
To manually configure a destination service to capture logs, you will need the following:
Bootstrap server endpoint: This is provided on the Cluster Settings page. For example,
pkc-abc123.<aws-region>.aws.confluent.cloud:9092. You can also get this information using the following Confluent CLI command:confluent kafka cluster describe
Log topic name: Get this from the topics page. For example,
clcc-<cluster-ID>-app-logs. You can also get this information using the following Confluent CLI command:confluent kafka topic list
This information is also provided in the UI in Cluster settings.
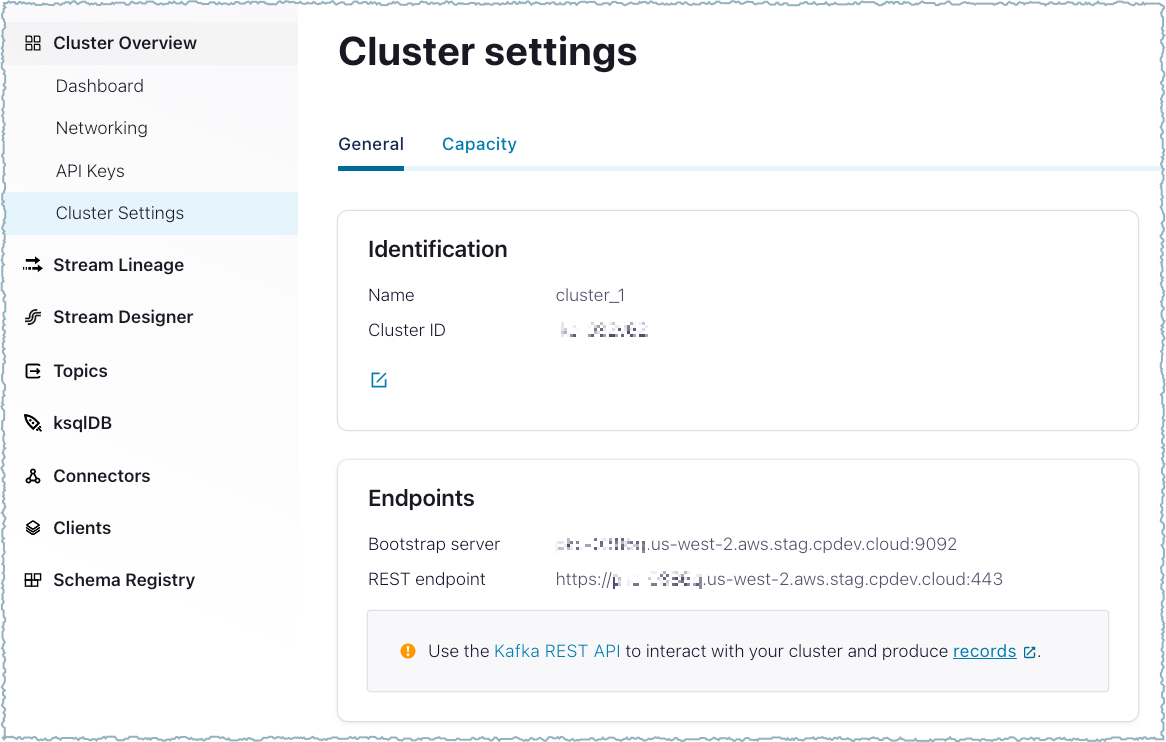
View cluster settings
View metrics
Basic message and production throughput metrics are shown on the connector overview page.
Connect worker metrics
Click Metrics to view additional metrics for the Kafka Connect worker. Worker health metrics are available for up to seven days.
Tip
For Confluent Cloud Metrics API examples, see the Example Queries.
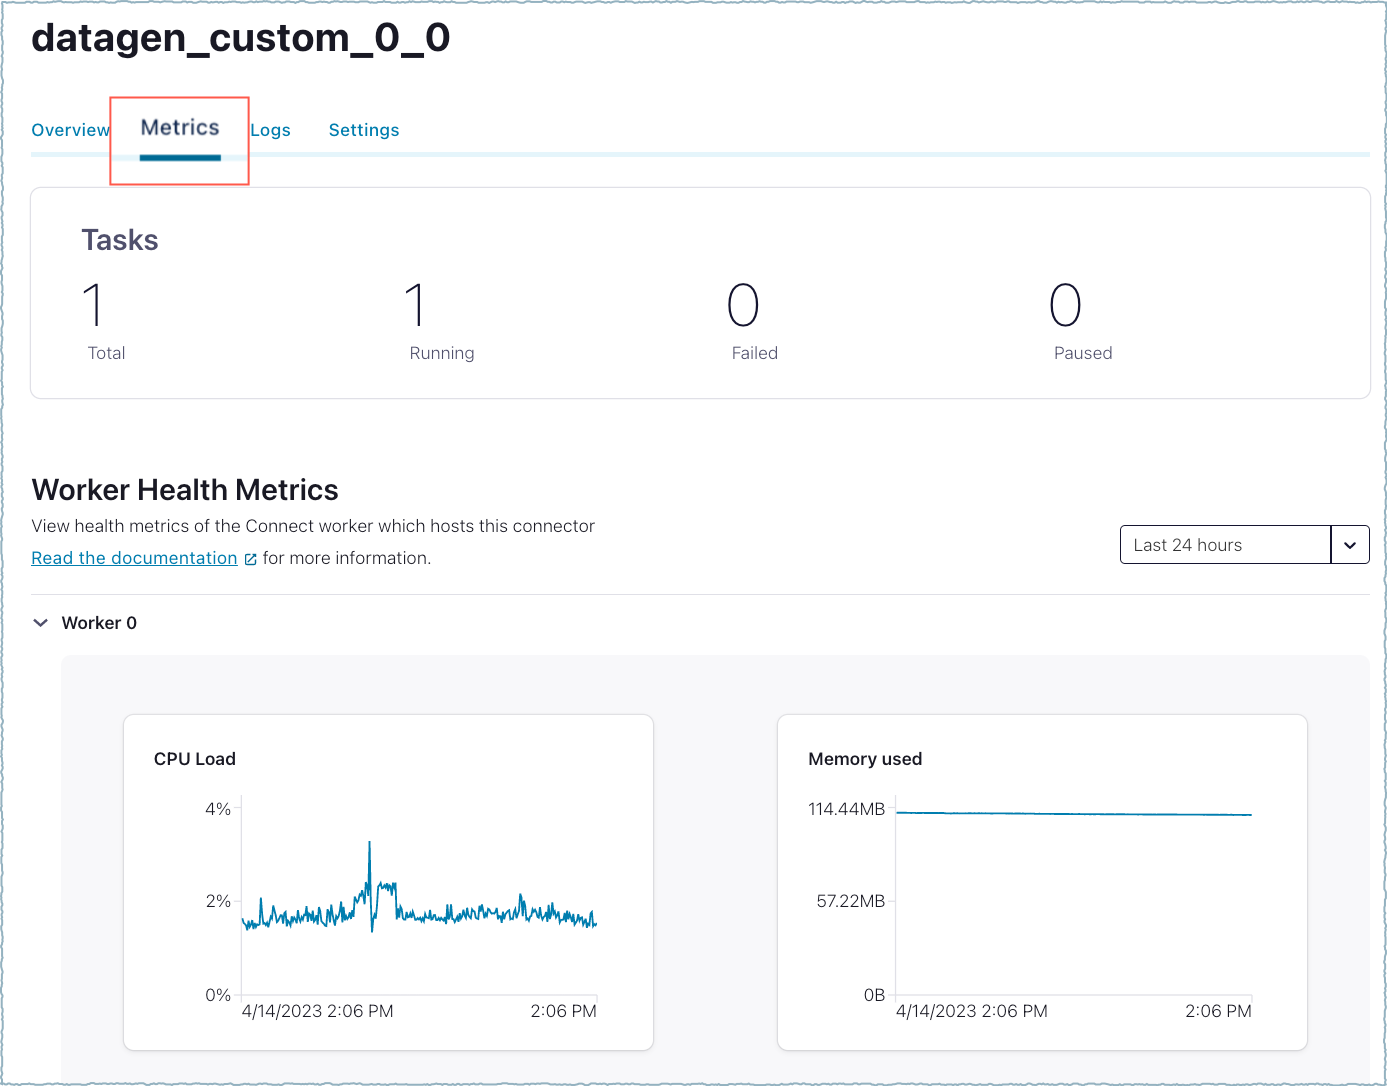
View throughput metrics
Scroll for other metrics.
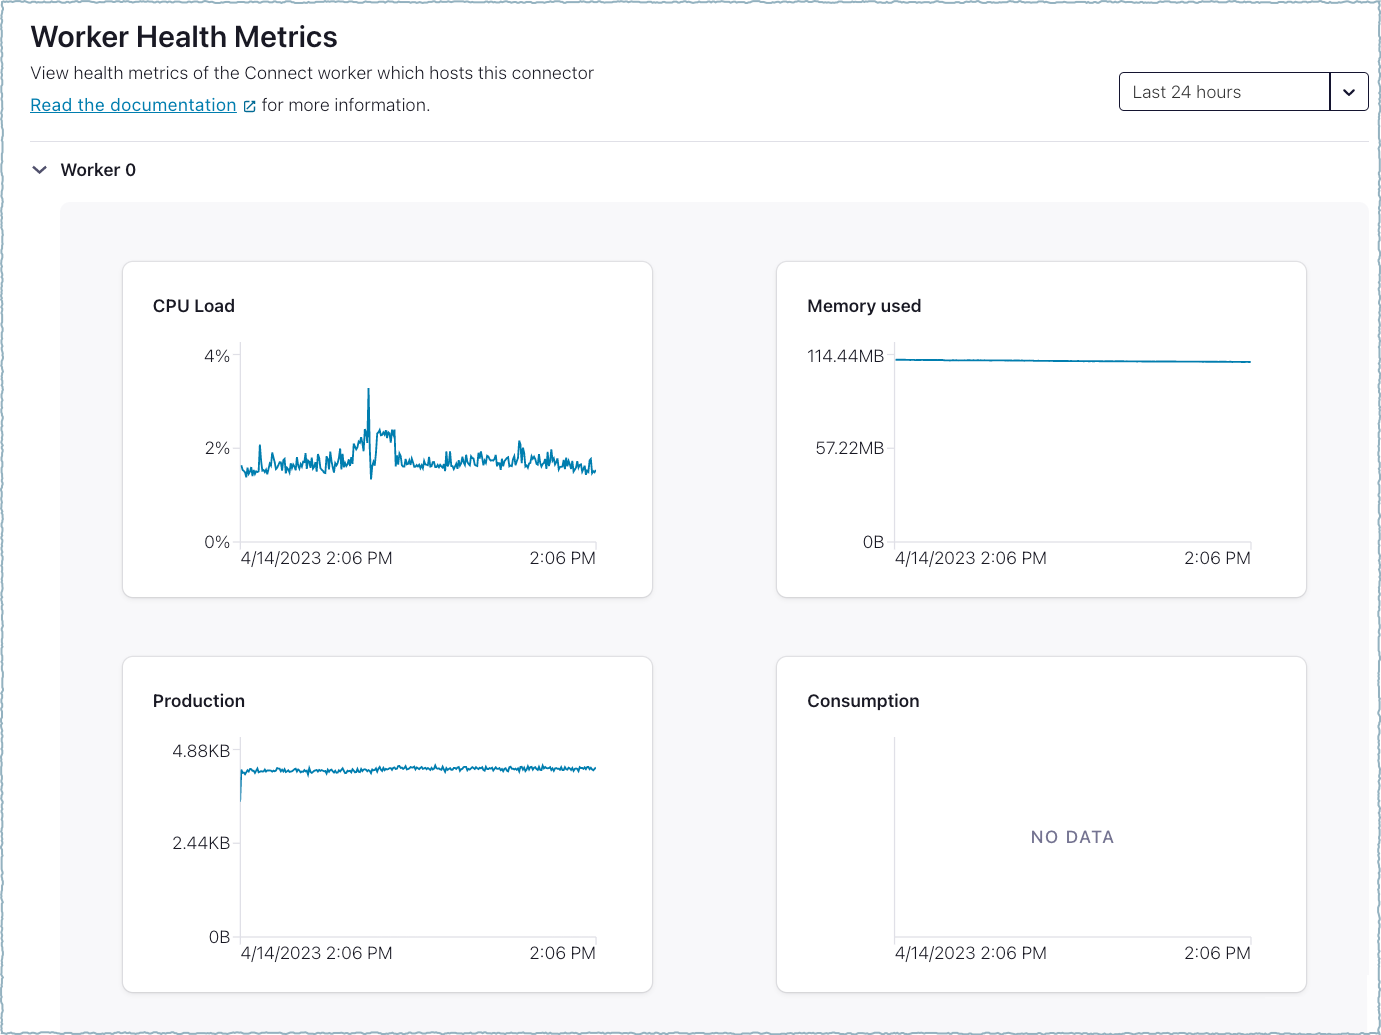
View other metrics
Custom connector metrics
You can view metrics for a specific connector and export metrics.
Click Explore metrics on the connector overview page.
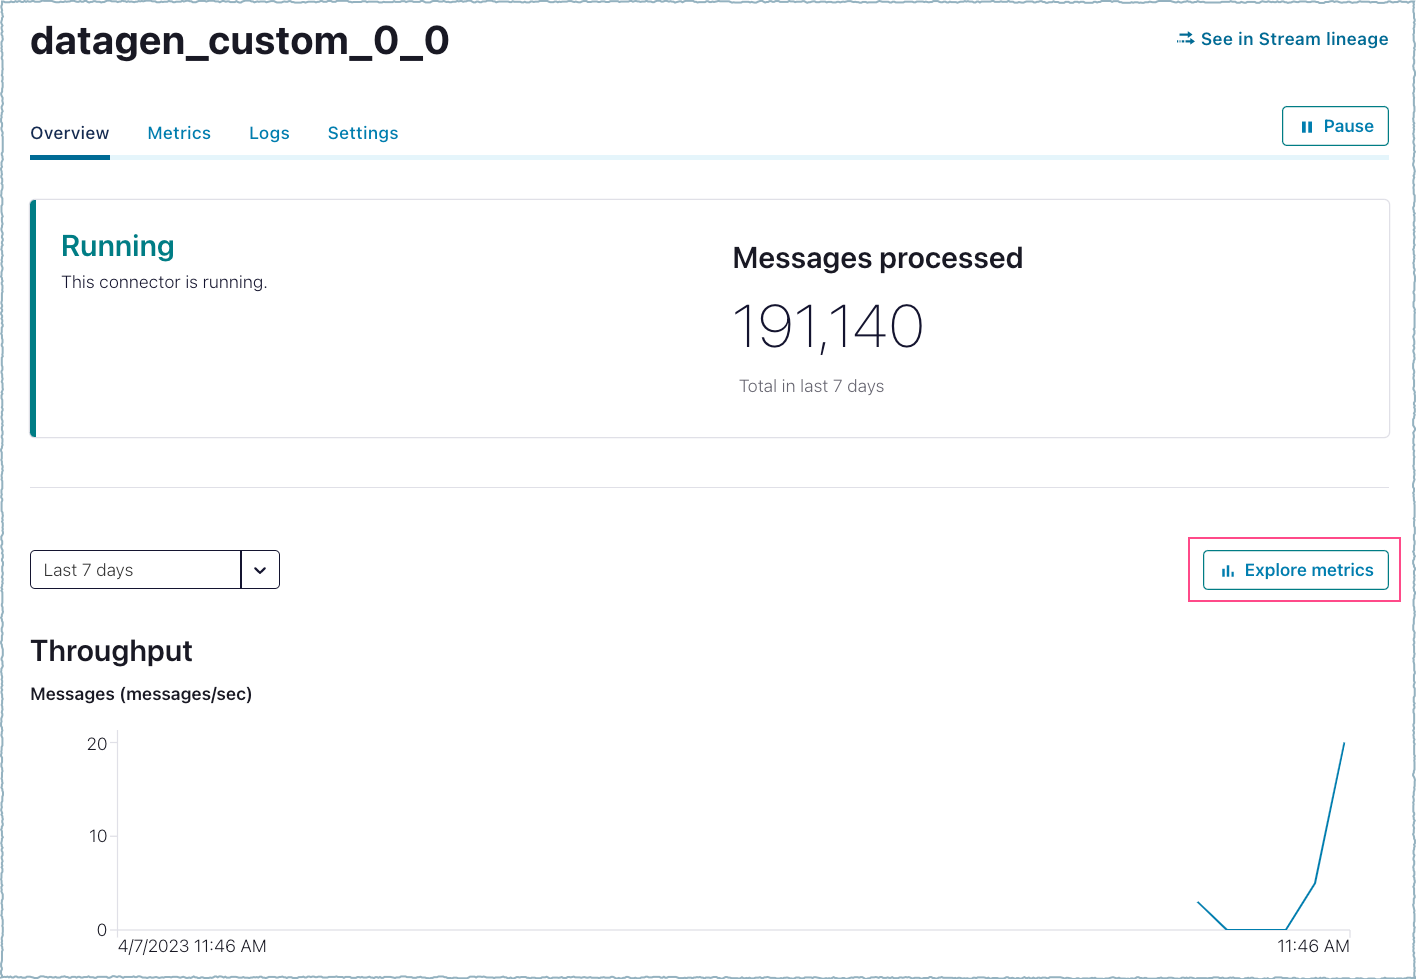
Explore metrics
Under Metric, select a custom connector metric you want to view.
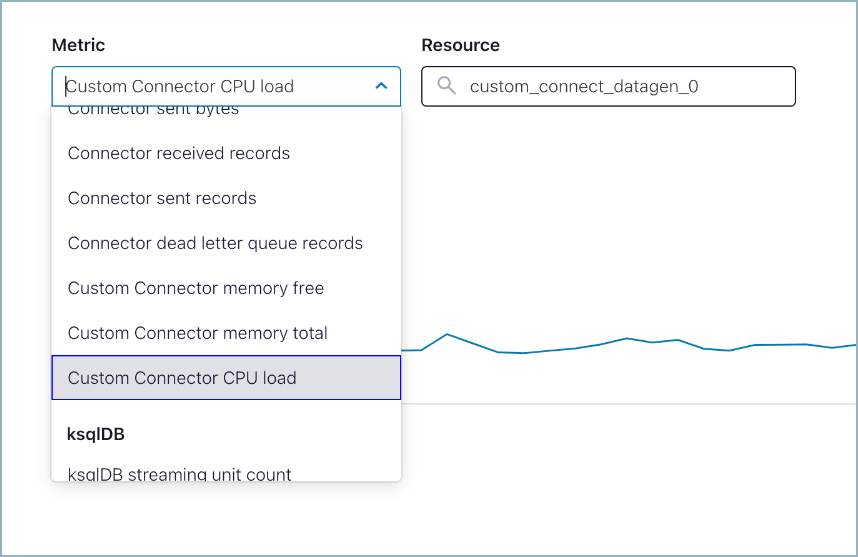
View metric
Under Resource, search for and select a custom connector. The selected metric for the connector is displayed. Custom connector metrics are available for up to seven days.
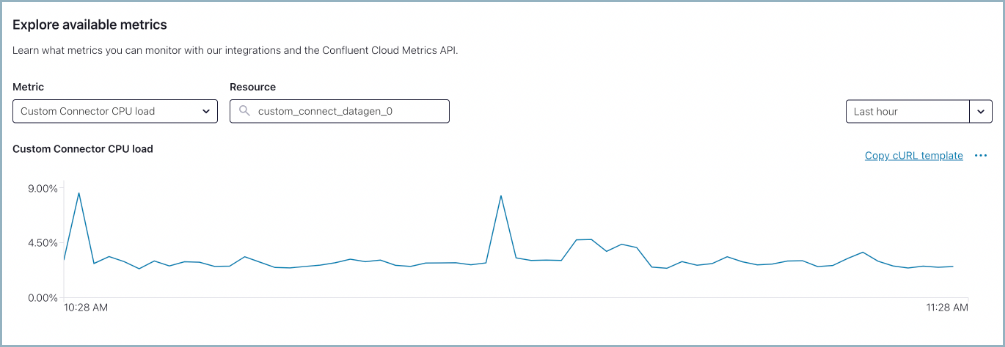
Select custom connector
You can export metrics for your custom connector. Click New integration and choose the monitoring platform you want to use.
Delete a custom connector
Complete the following steps to delete the custom connector instance. If you want to delete a custom connector plugin, see Delete a custom connector plugin.
Note
Deleting a connector does not delete the associated Kafka app log topic.
Open the connector Overview page. Click Settings. The option to delete a connector is located at the bottom of the Settings screen.
Click Delete connector.
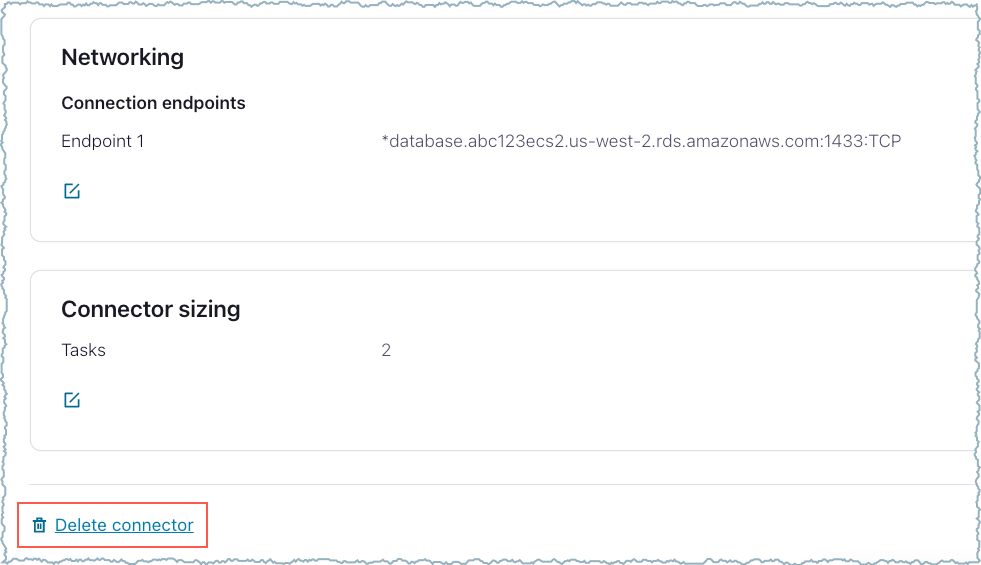
Delete connector on Settings
Enter the connector name on the confirmation screen and click Confirm.
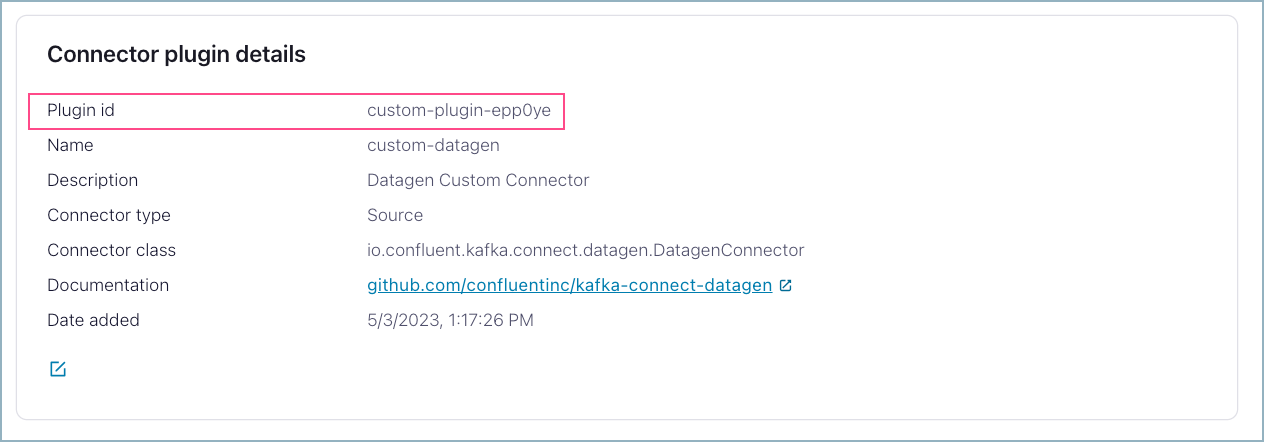
View a custom connector plugin ID
Delete a custom connector plugin
Go to the main Connectors page.
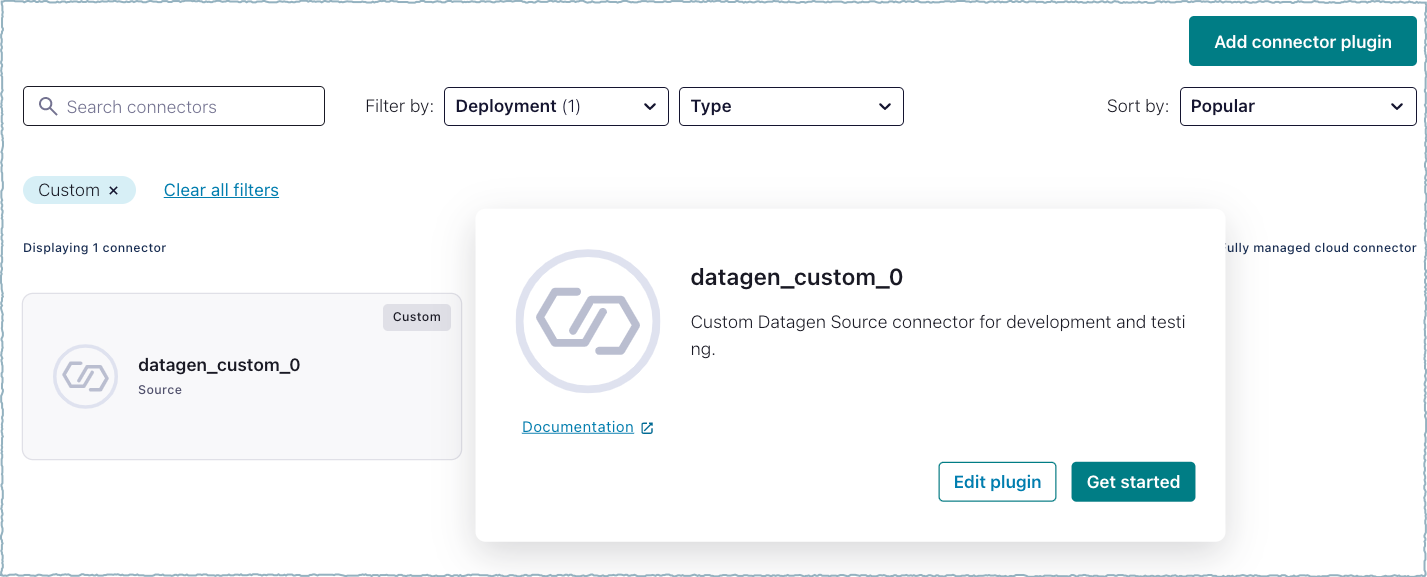
Delete connector plugin
Select the plugin and click Edit plugin.
Click Delete plugin.