Observability for Kafka Clients to Confluent Cloud
Using Confluent Cloud has the advantage of circumventing the challenges you might face when monitoring an on-premises Apache Kafka® cluster, but you still need to monitor your client applications and, to some degree, your Confluent Cloud cluster. Your success in Confluent Cloud largely depends on how well your applications are performing. Observability into the performance and status of your client applications gives you insights on how to fine tune your producers and consumers, when to scale your Confluent Cloud cluster, what might be going wrong, and how to resolve the problem.
This module covers how to set up a time-series database populated with data from the Confluent Cloud Metrics API and client metrics from a locally running Java consumer and producer, along with how to set up a data visualization tool. After the initial setup, you will follow a series of scenarios to create failure scenarios and to be alerted when the errors occur.
Note
This example uses Prometheus as the time-series database and Grafana for visualization, but the same principles can be applied to any other technologies.
Prerequisites
Access to Confluent Cloud.
Local install of Confluent Cloud CLI (v3.0.0 or later)
jq installed on your host
Docker installed on your host
Evaluate the Costs to Run the Tutorial
Confluent Cloud examples that use actual Confluent Cloud resources may be billable. An example may create a new Confluent Cloud environment, Kafka cluster, topics, ACLs, and service accounts, and resources that have hourly charges such as connectors and ksqlDB applications. To avoid unexpected charges, carefully evaluate the cost of resources before you start. After you are done running a Confluent Cloud example, destroy all Confluent Cloud resources to avoid accruing hourly charges for services and verify that they have been deleted.
Confluent Cloud Cluster and Observability Container Setup
The following instructions will:
use
ccloud-stackto create a Confluent Cloud cluster, a service account with proper acls, and a client configuration filecreate a
cloudresource api-key for theccloud-exporterbuild a Kafka client docker image with the maven project’s dependencies cache
stand up numerous docker containers (1 consumer with JMX exporter, 1 producer with JMX exporter, Prometheus, Grafana and a Prometheus node-exporter) with Docker Compose
Log in to Confluent Cloud with the Confluent CLI:
confluent login --prompt --save
The
--saveflag will save your Confluent Cloud login credentials.Clone the confluentinc/examples GitHub repository.
git clone https://github.com/confluentinc/examples.git
Navigate to the
examples/ccloud-observability/directory and switch to themasterbranch:cd examples/ccloud-observability/ git checkout master
Set up a Confluent Cloud cluster, secrets, and observability components by running start.sh script:
./start.sh
It will take up to 3 minutes for data to become visible in Grafana. Open Grafana and use the username
adminand passwordpasswordto login. Now you are ready to proceed to Producer, Consumer, or General scenarios to see what different failure scenarios look like.
Validate Setup
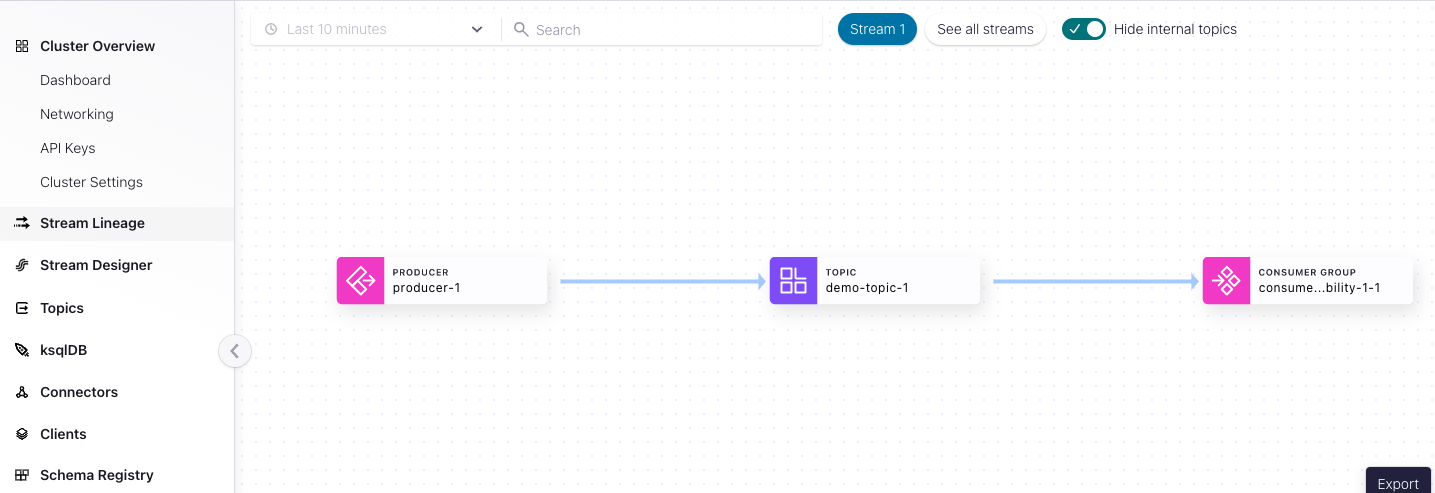
Validate the producer and consumer Kafka clients are running. From the Confluent Cloud UI, view the Stream Lineage in your newly created environment and Kafka cluster.
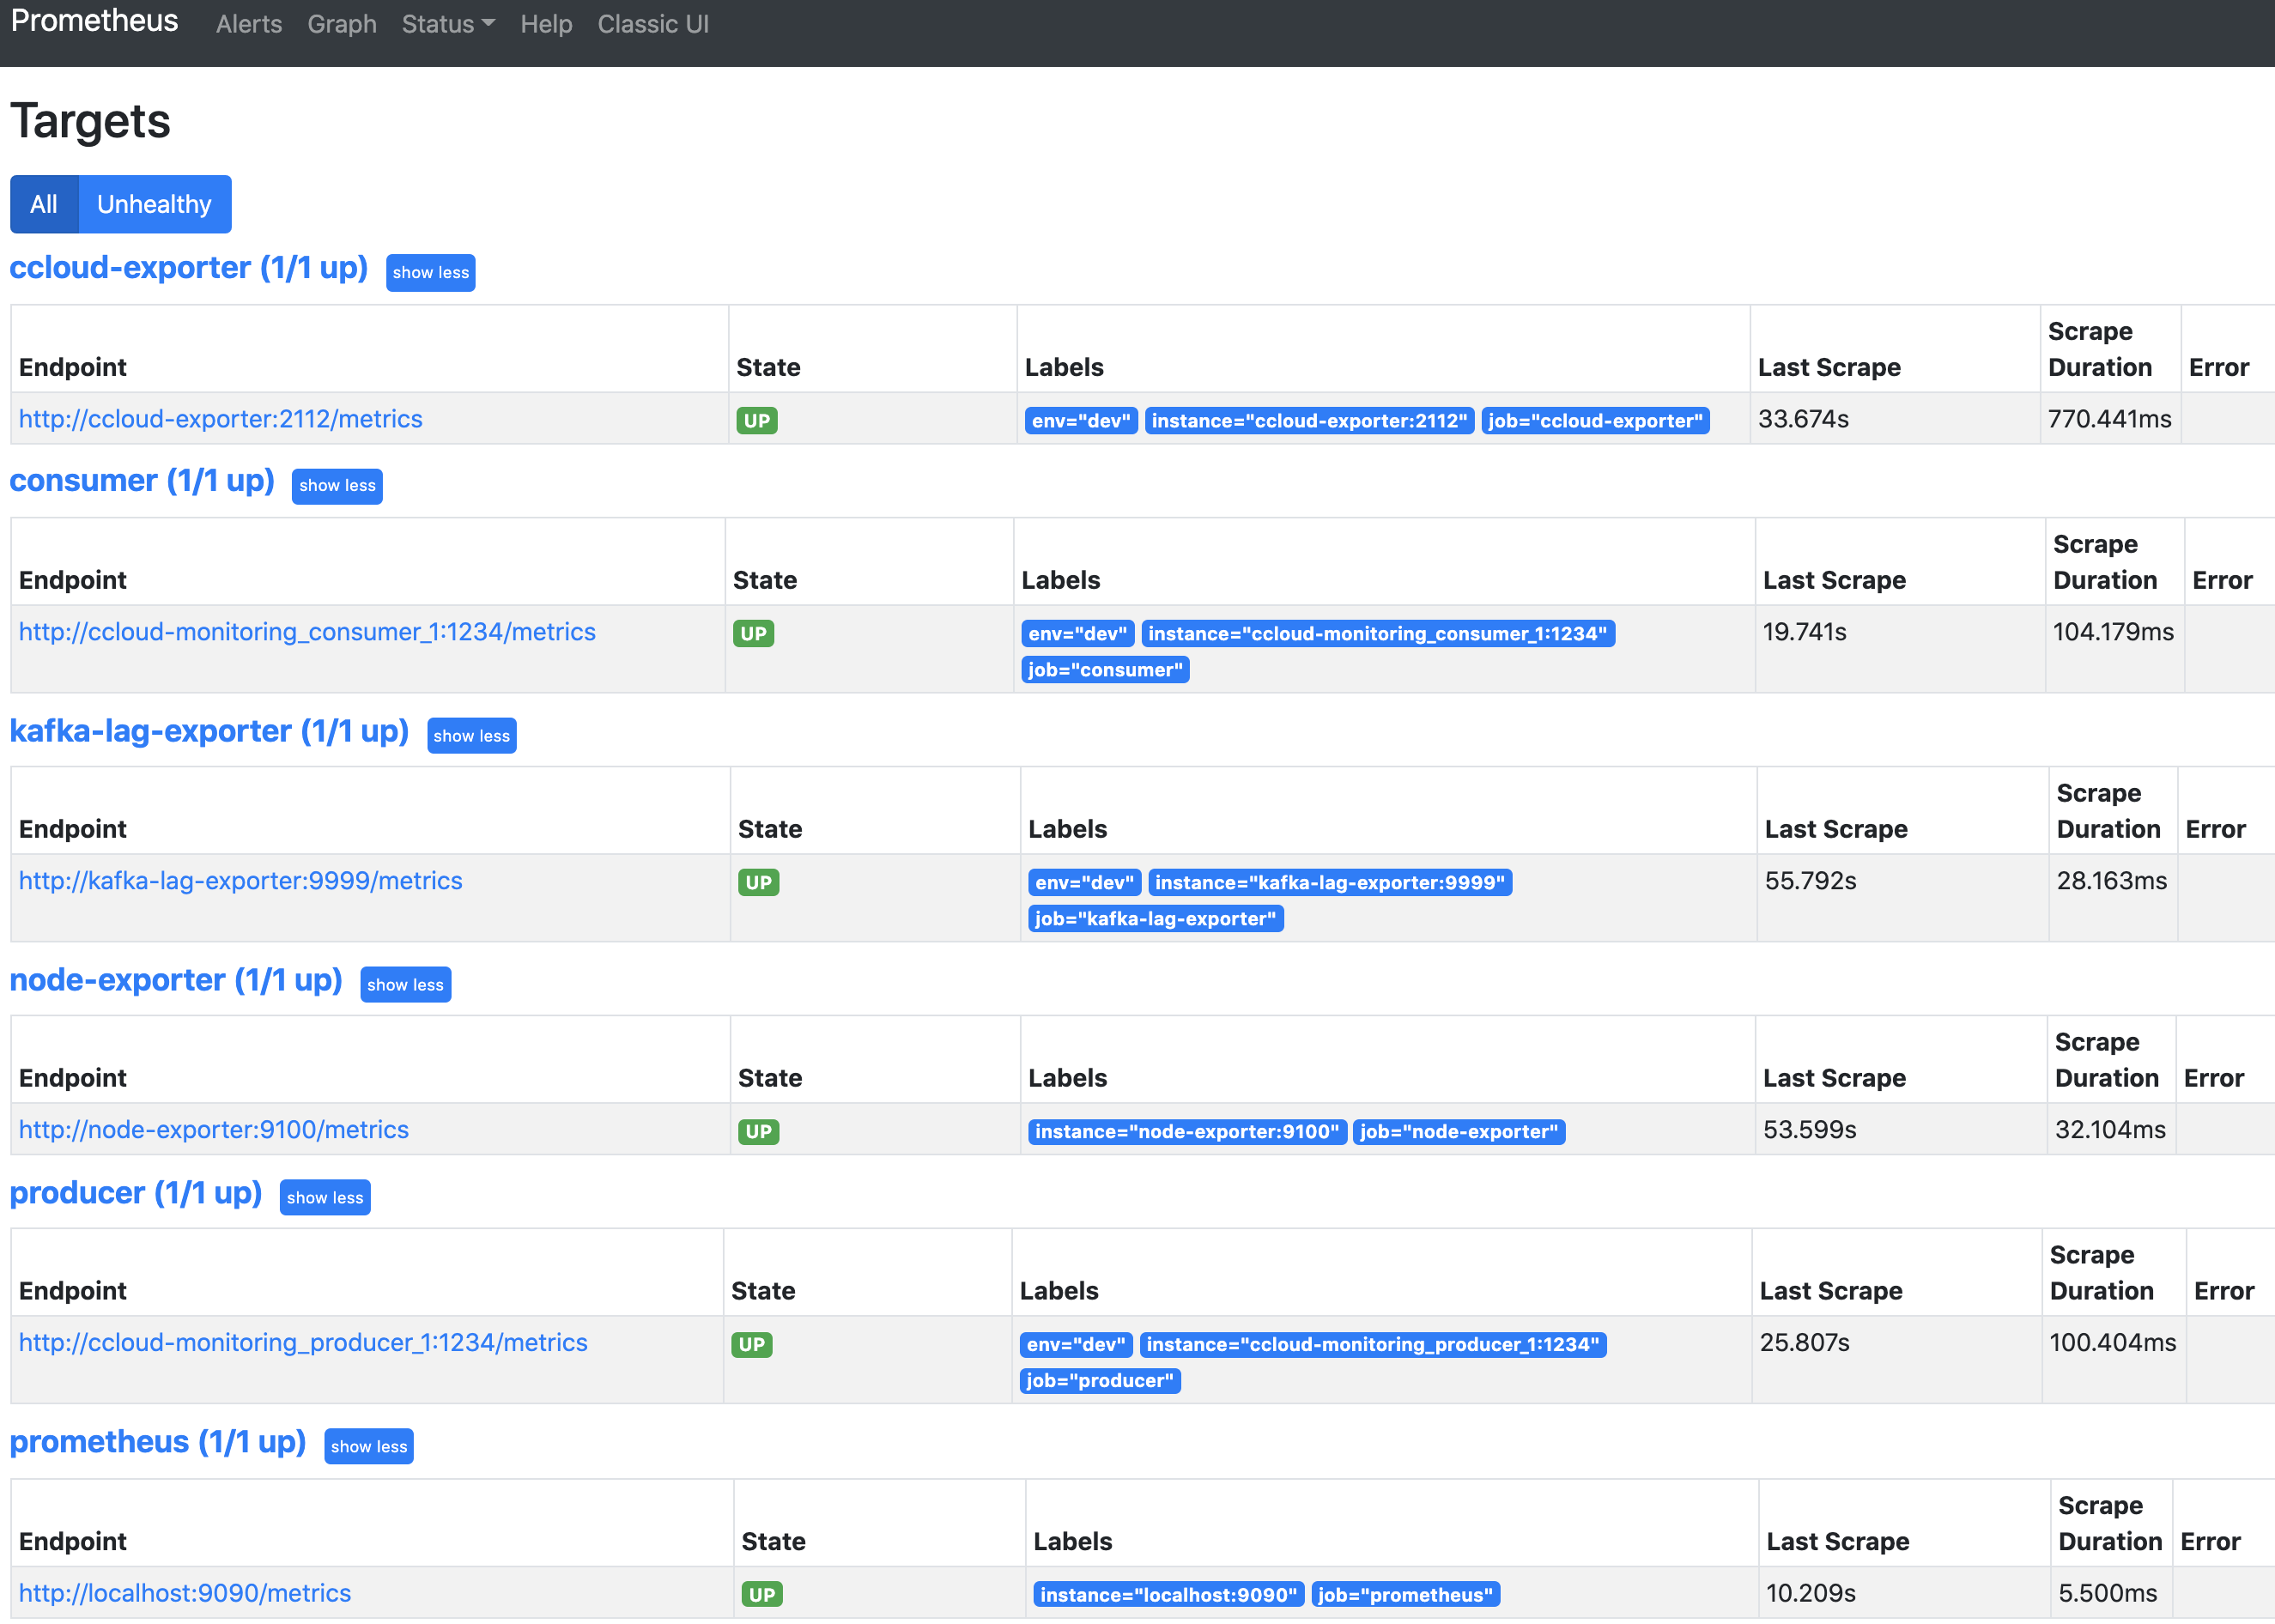
Navigate to the Prometheus Targets page.
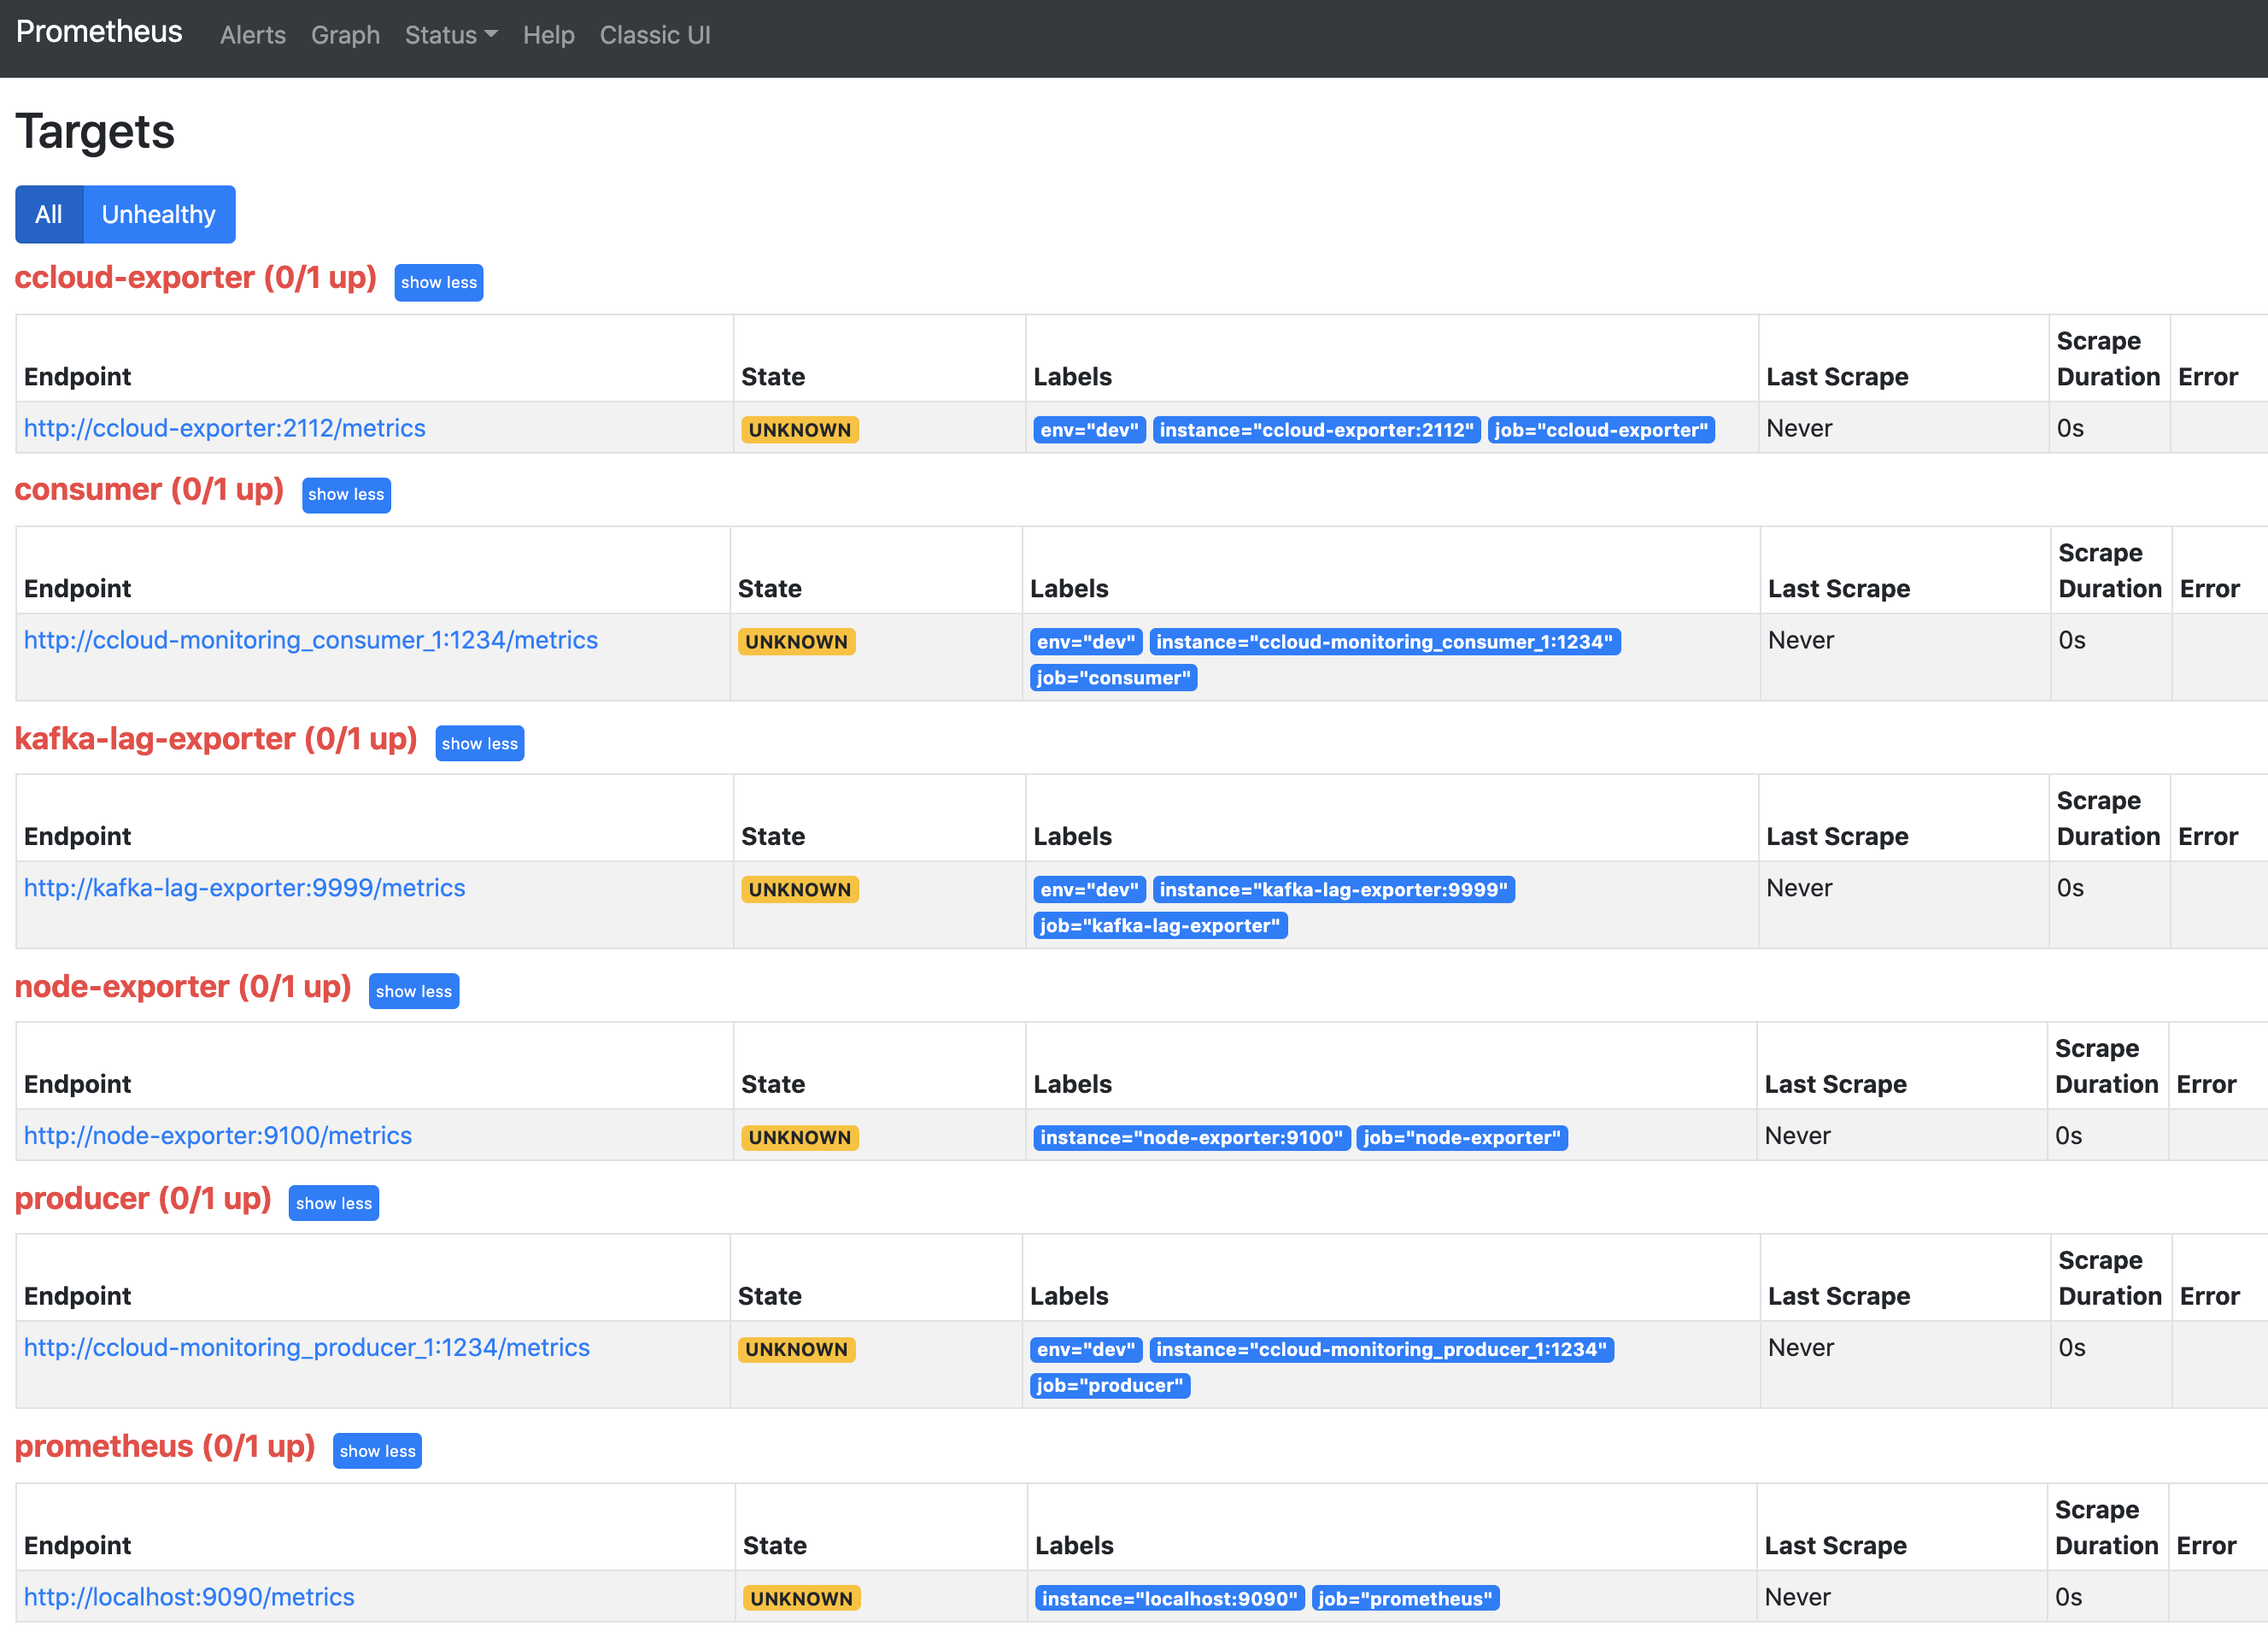
This page will show you if Prometheus is scraping the targets you have created. It should look like below after 2 minutes if everything is working. You may need to refresh the page.
It will take up to 3 minutes for data to become visible in Grafana. Open Grafana and use the username
adminand passwordpasswordto login.Now you are ready to proceed to Producer, Consumer, or General scenarios to see what different failure scenarios look like.
Producer Client Scenarios
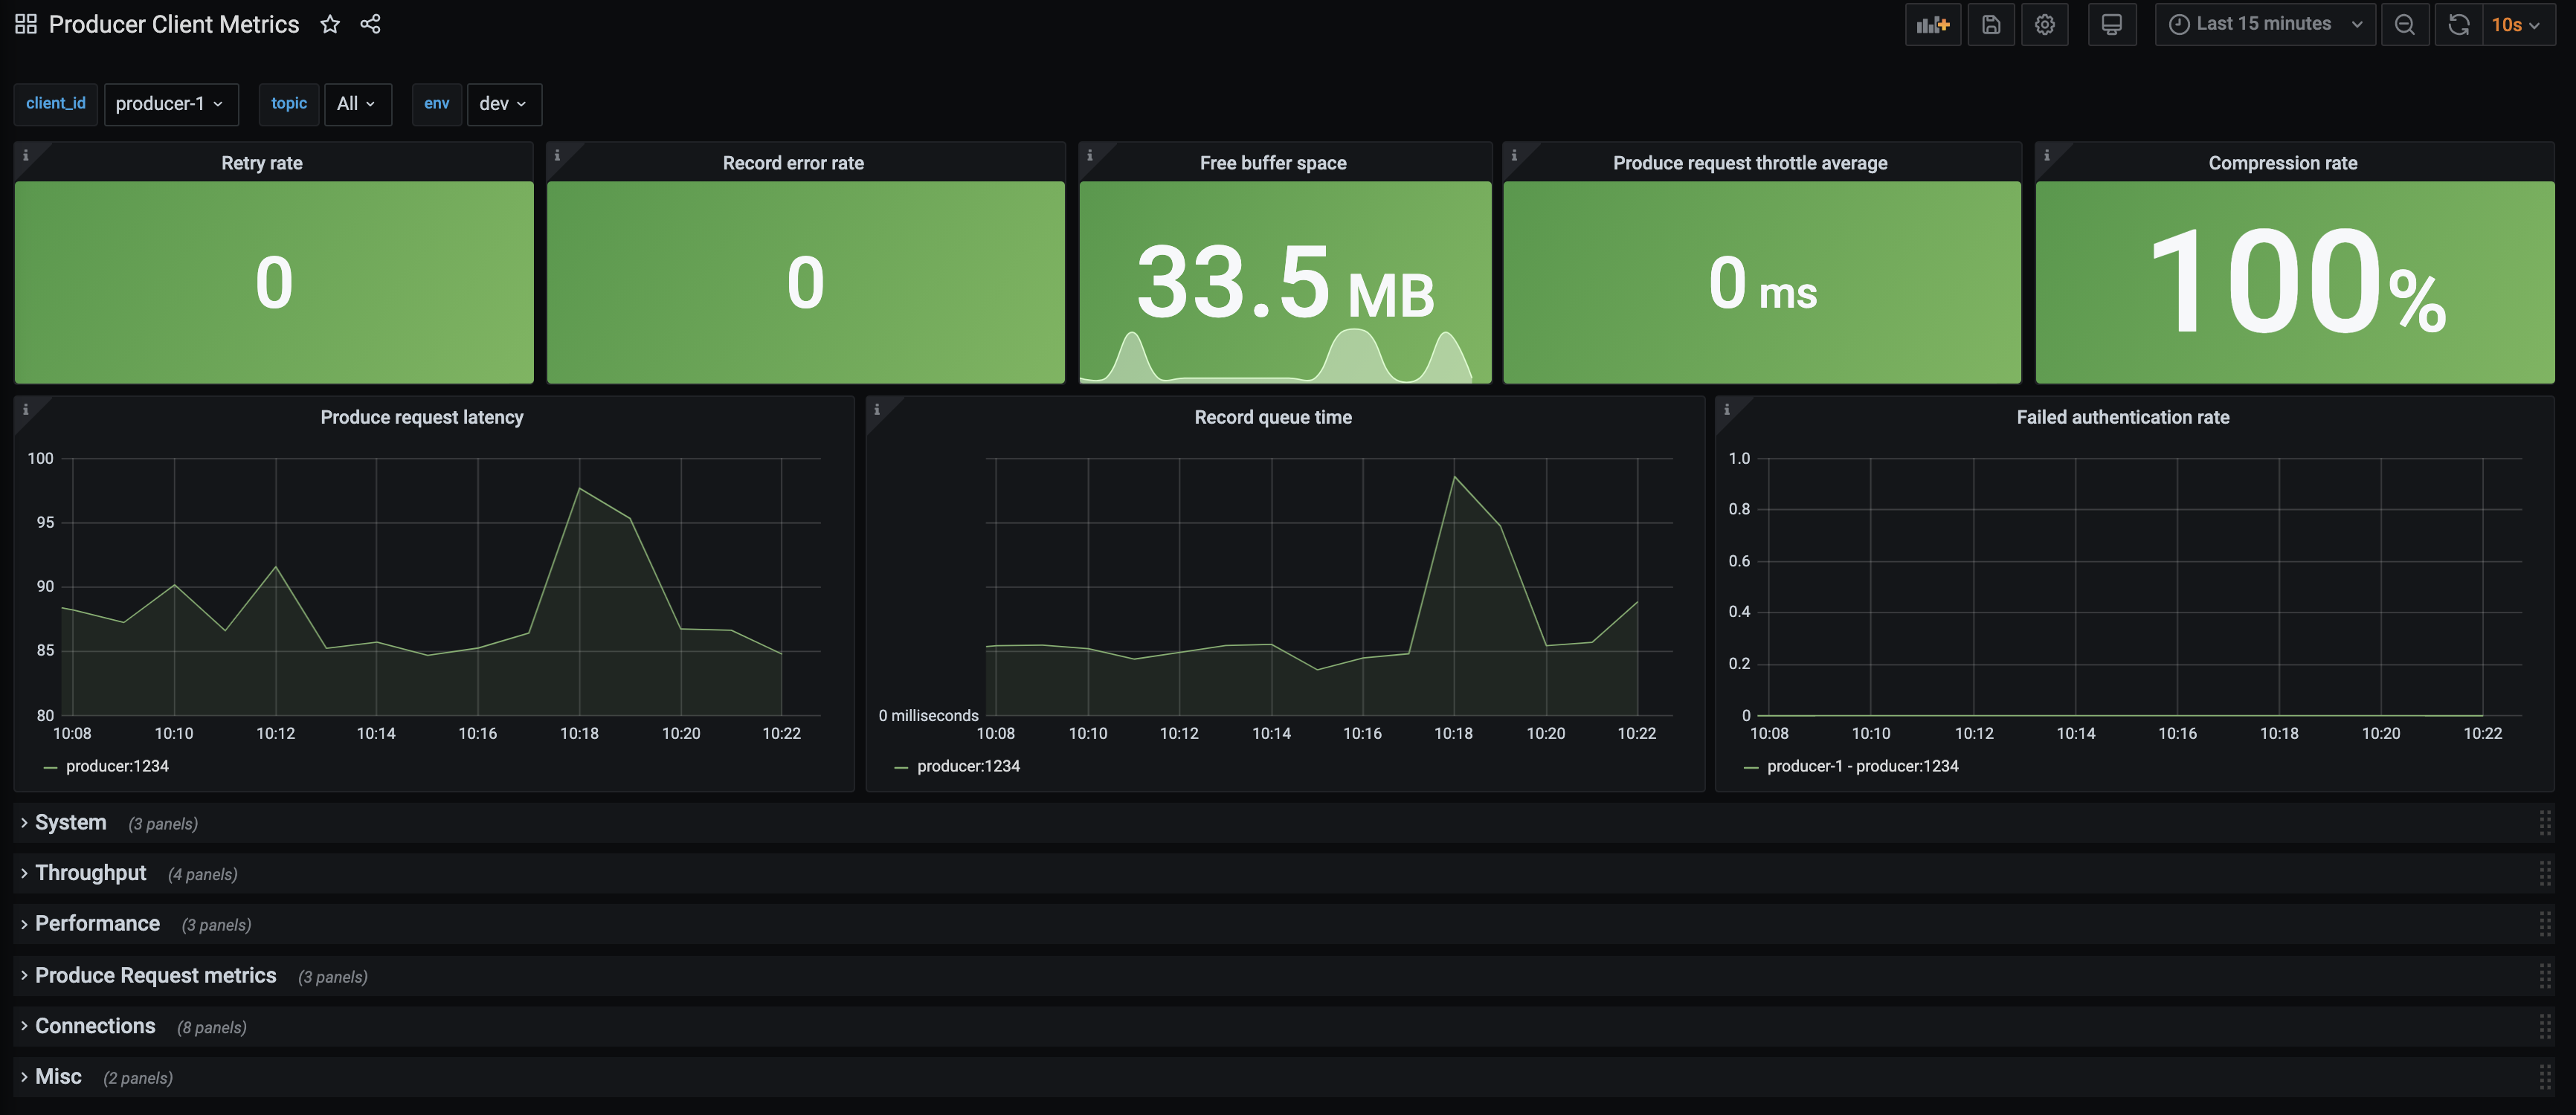
The dashboard and scenarios in this section use client metrics from a Java producer. The same principles can be applied to any other non-java clients–they generally offer similar metrics.
The source code for the client can found in the ccloud-observability/src directory. The sample client uses default configurations, this is not recommended for production use cases. This Java producer will continue to produce the same message every 100 ms until the process is interrupted. The content of the message is not important here, in these scenarios the focus is on the change in client metric values.
Confluent Cloud Unreachable
In the producer container, add a rule blocking network traffic that has a destination TCP port 9092. This will prevent the producer from reaching the Kafka cluster in Confluent Cloud.
This scenario will look at Confluent Cloud metrics from the Metrics API and client metrics from the client application’s MBean object kafka.producer:type=producer-metrics,client-id=producer-1.
Introduce failure scenario
Add a rule blocking traffic in the
producercontainer on port9092which is used to talk to the broker:docker compose exec producer iptables -A OUTPUT -p tcp --dport 9092 -j DROP
Diagnose the problem
From your web browser, navigate to the Grafana dashboard at http://localhost:3000 and login with the username
adminand passwordpassword.Navigate to the
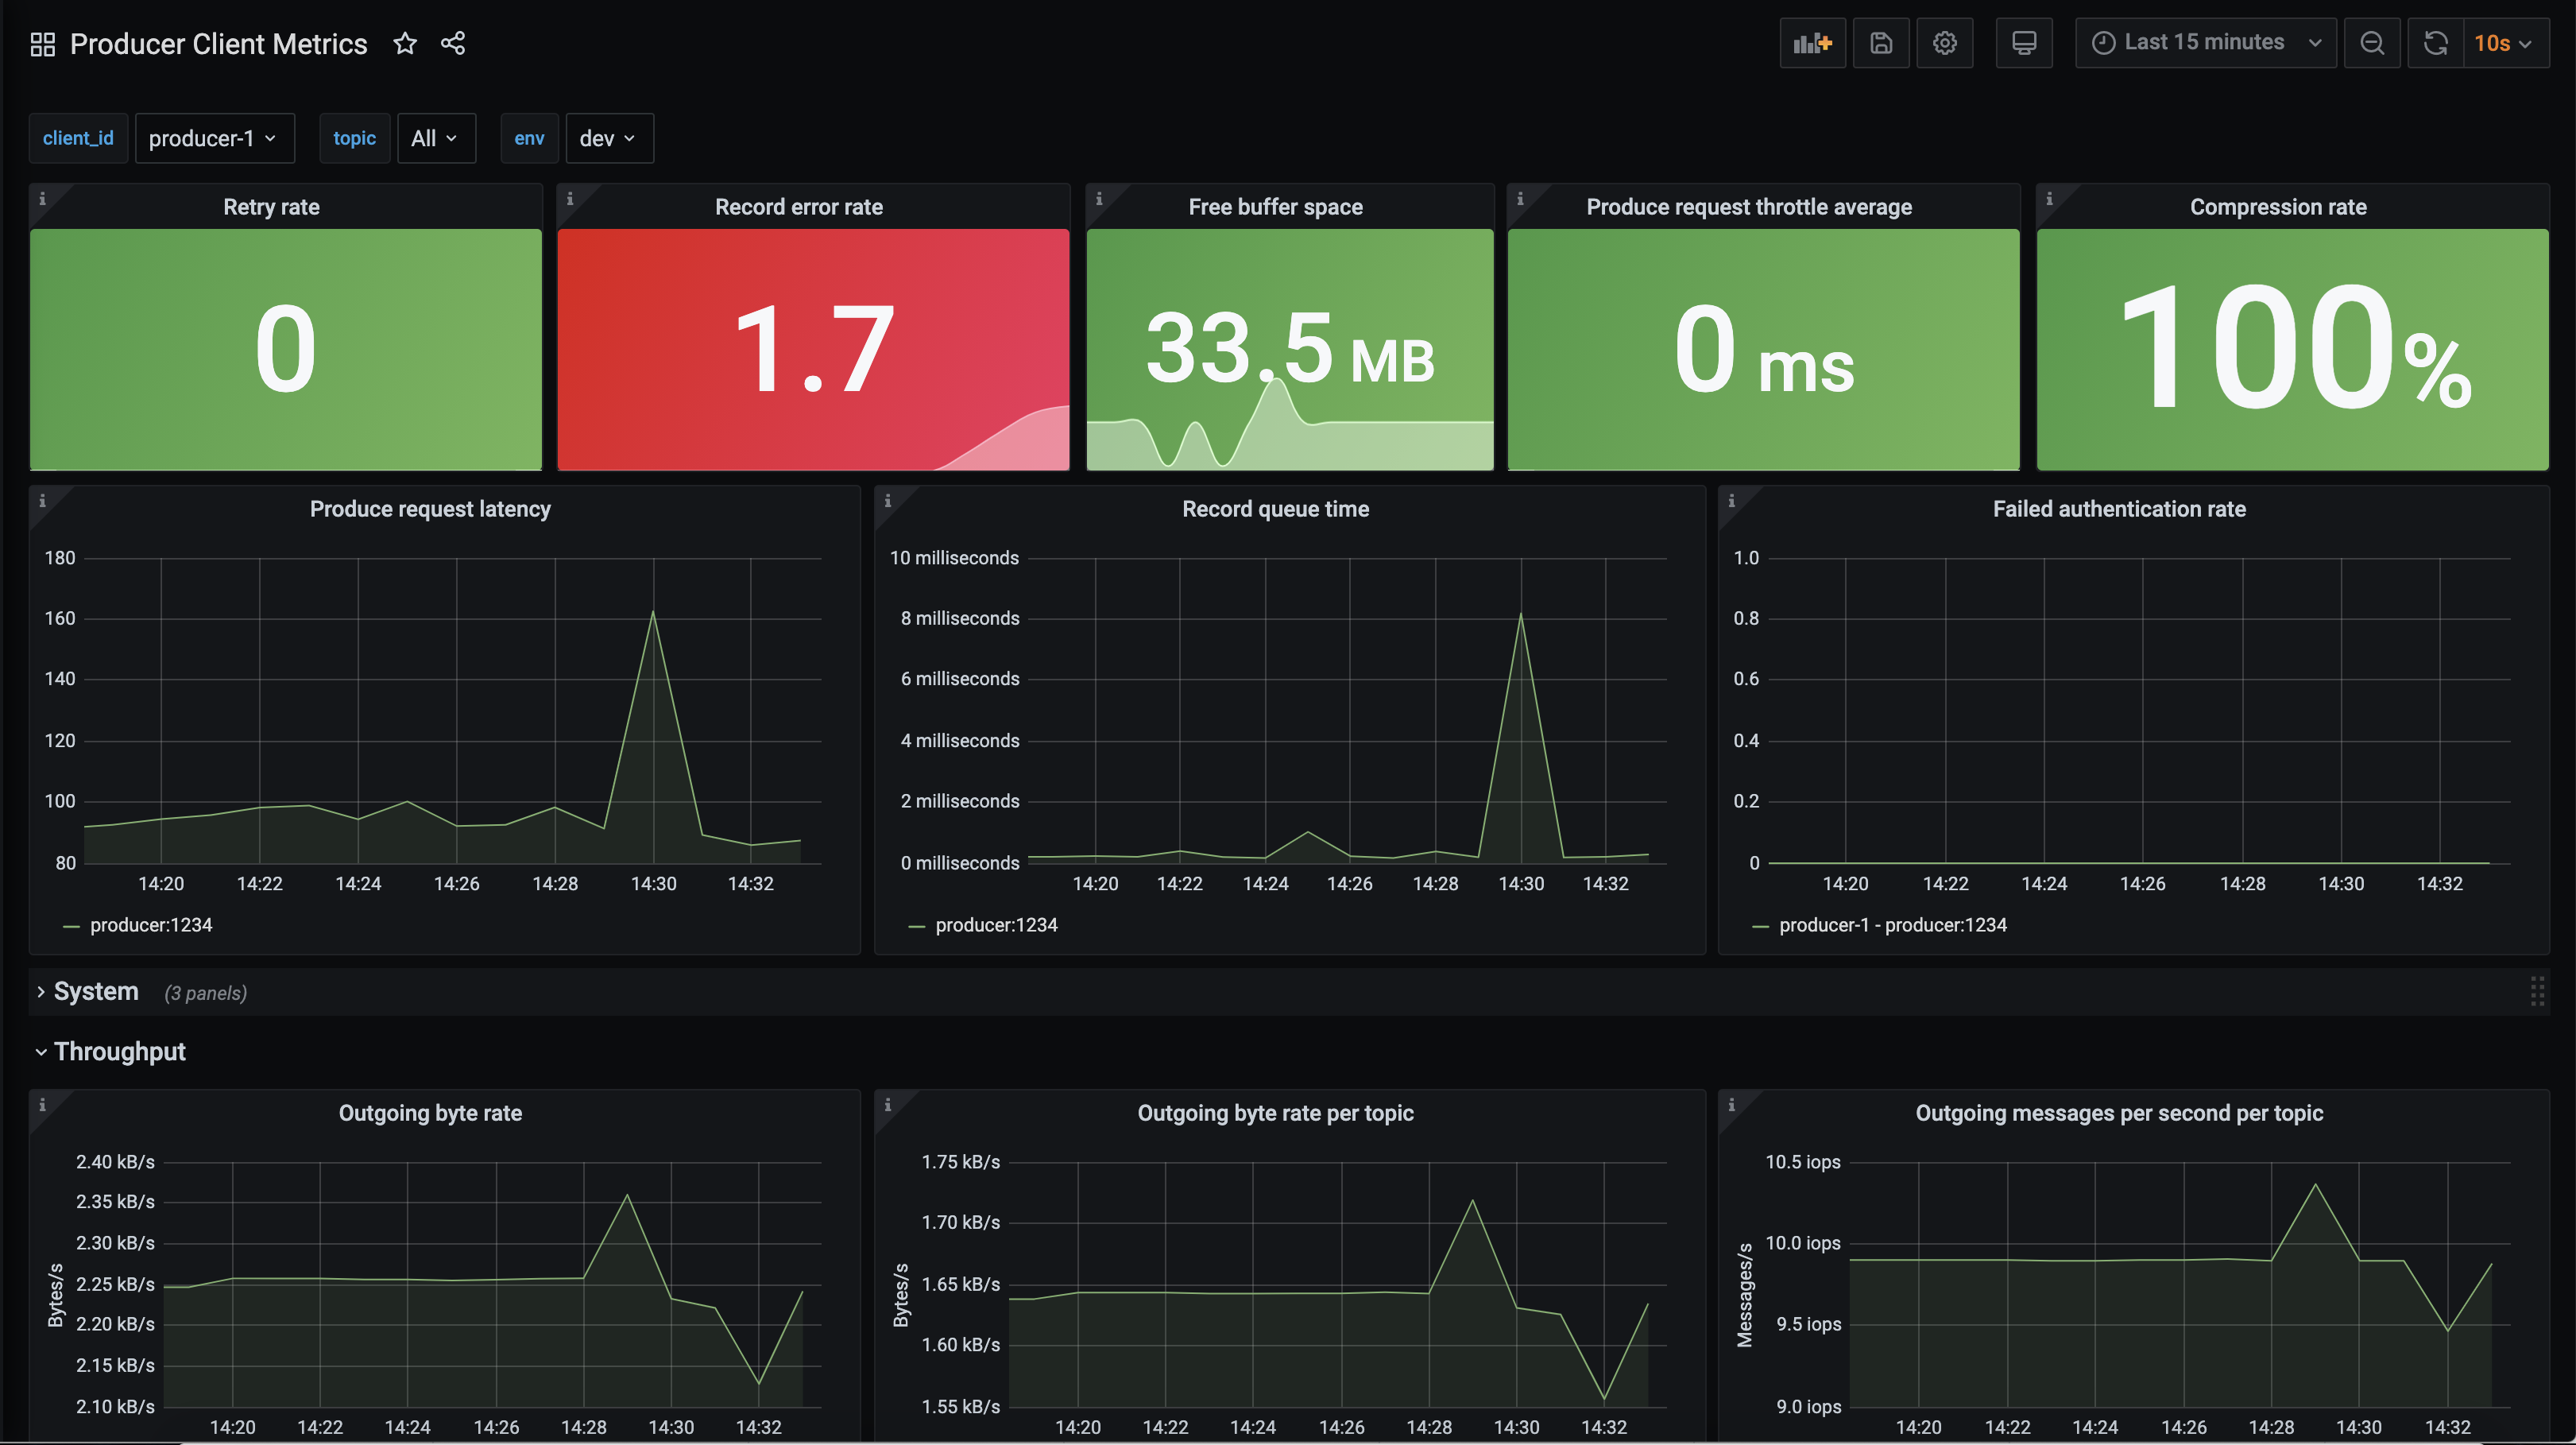
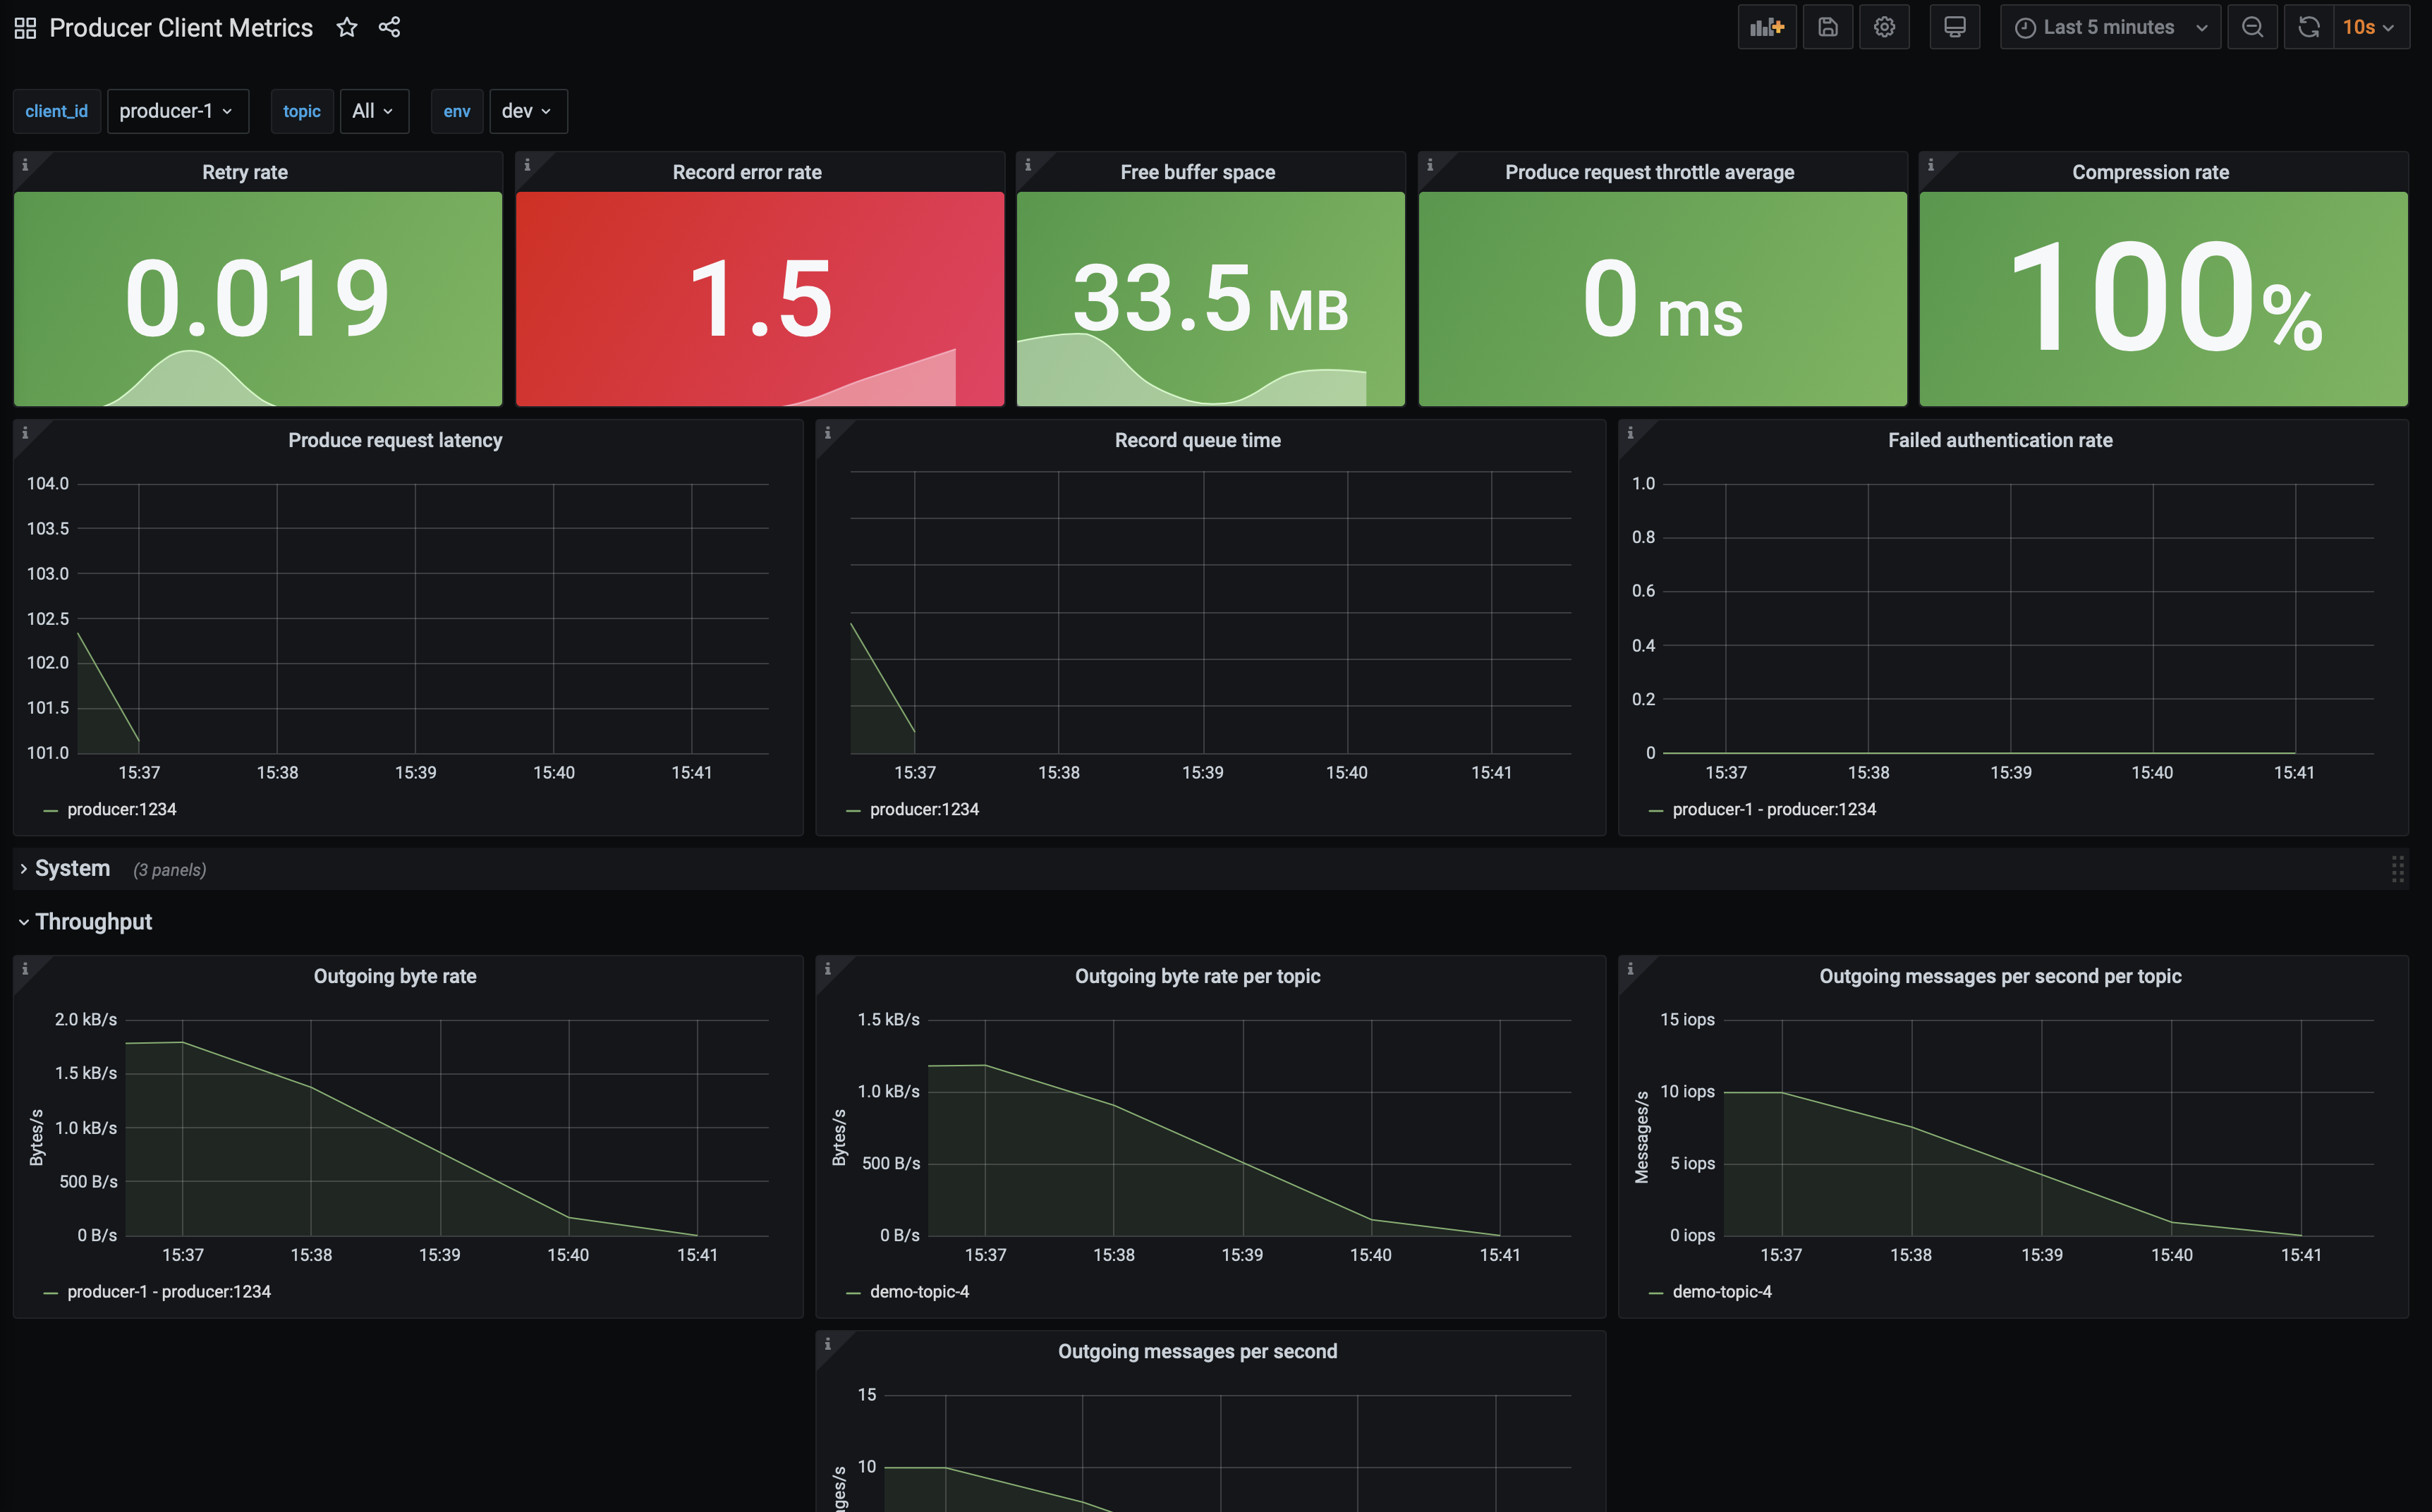
Producer Client Metricsdashboard. Wait 2 minutes and then observe:A downward trend in outgoing bytes which can be found by the expanding the
Throughputtab.The top-level panels like
Record error rate(derived from Kafka MBean attributerecord-error-rate) should turn red, a major indication something is wrong.The spark line in the
Free buffer space(derived from Kafka MBean attributebuffer-available-bytes) panel go down and a bump inRetry rate(derived from Kafka MBean attributerecord-retry-rate)
This means the producer is not producing data, which could happen for a few reasons.
Check the status of the Confluent Cloud cluster, specifically that it is accepting requests to isolate this problem to the producer. To do this, navigate to the
Confluent Clouddashboard.Look at the top panels. They should all be green which means the cluster is operating safely within its resources.

For a connectivity problem in a client, look specifically at the
Requests (rate). If this value is yellow or red, the client connectivity problem could be due to hitting the Confluent Cloud requests rate limit. If you exceed the maximum, requests may be refused. See the General Request Rate Limits scenario for more details.Check the producer logs for more information about what is going wrong. Use the following docker command to get the producer logs:
docker compose logs producer
Verify that you see log messages similar to what is shown below:
producer           | [2021-02-11 18:16:12,231] WARN [Producer clientId=producer-1] Got error produce response with correlation id 15603 on topic-partition demo-topic-1-3, retrying (2147483646 attempts left). Error: NETWORK_EXCEPTION (org.apache.kafka.clients.producer.internals.Sender)
producer           | [2021-02-11 18:16:12,232] WARN [Producer clientId=producer-1] Received invalid metadata error in produce request on partition demo-topic-1-3 due to org.apache.kafka.common.errors.NetworkException: The server disconnected before a response was received.. Going to request metadata update now (org.apache.kafka.clients.producer.internals.Sender)
Note that the logs provide a clear picture of what is going on–
Error: NETWORK_EXCEPTIONandserver disconnected. This was expected because the failure scenario we introduced blocked outgoing traffic to the broker’s port. Looking at metrics alone won’t always lead you directly to an answer but they are a quick way to see if things are working as expected.
Resolve failure scenario
Remove the rule we created earlier that blocked traffic with the following command:
docker compose exec producer iptables -D OUTPUT -p tcp --dport 9092 -j DROP
It may take a few minutes for the producer to start sending requests again.
Troubleshooting
Producer output rate doesn’t come back up after adding in the
iptablesrule.Restart the producer by running
docker compose restart producer. This is advice specific to this tutorial.
Consumer Client Scenarios
The dashboard and scenarios in this section use client metrics from a Java consumer. The same principles can be applied to any other non-java clients–they generally offer similar metrics.
The source code for the client can found in the ccloud-observability/src directory. The client uses default configurations, which is not recommended for production use cases. This Java consumer will continue to consumer the same message until the process is interrupted. The content of the message is not important here. In these scenarios the focus is on the change in client metric values.
Increasing Consumer Lag
Consumer lag is a tremendous performance indicator. It tells you the offset difference between the producer’s last produced message and the consumer group’s last commit. If you are unfamiliar with consumer groups or concepts like committing offsets, please refer to this Kafka Consumer documentation.
A large consumer lag, or a quickly growing lag, indicates that the consumer is not able to keep up with the volume of messages on a topic.
This scenario will look at metrics from various sources. Consumer lag metrics are pulled from the kafka-lag-exporter container, a Scala open-source project that collects data about consumer groups and presents them in a Prometheus scrapable format. Metrics about Confluent Cloud cluster resource usage are pulled from the Metrics API endpoints. Consumer client metrics are pulled from the client application’s MBean object kafka.consumer:type=consumer-fetch-manager-metrics,client-id=<client_id>.
Introduce failure a scenario
By default 1 consumer and 1 producer are running. Change this to 1 consumer and 5 producers to force the condition where the consumer cannot keep up with the rate of messages being produced, which will cause an increase in consumer lag. The container scaling can be done with the command below:
docker compose up -d --scale producer=5
This produces the following output:
ccloud-exporter is up-to-date
kafka-lag-exporter is up-to-date
node-exporter is up-to-date
grafana is up-to-date
prometheus is up-to-date
Starting ccloud-observability_producer_1              ... done
Creating ccloud-observability_producer_2              ... done
Creating ccloud-observability_producer_3              ... done
Creating ccloud-observability_producer_4              ... done
Creating ccloud-observability_producer_5              ... done
Starting ccloud-observability_consumer_1              ... done
Diagnose the problem
Open Grafana and login with the username
adminand passwordpassword.Navigate to the
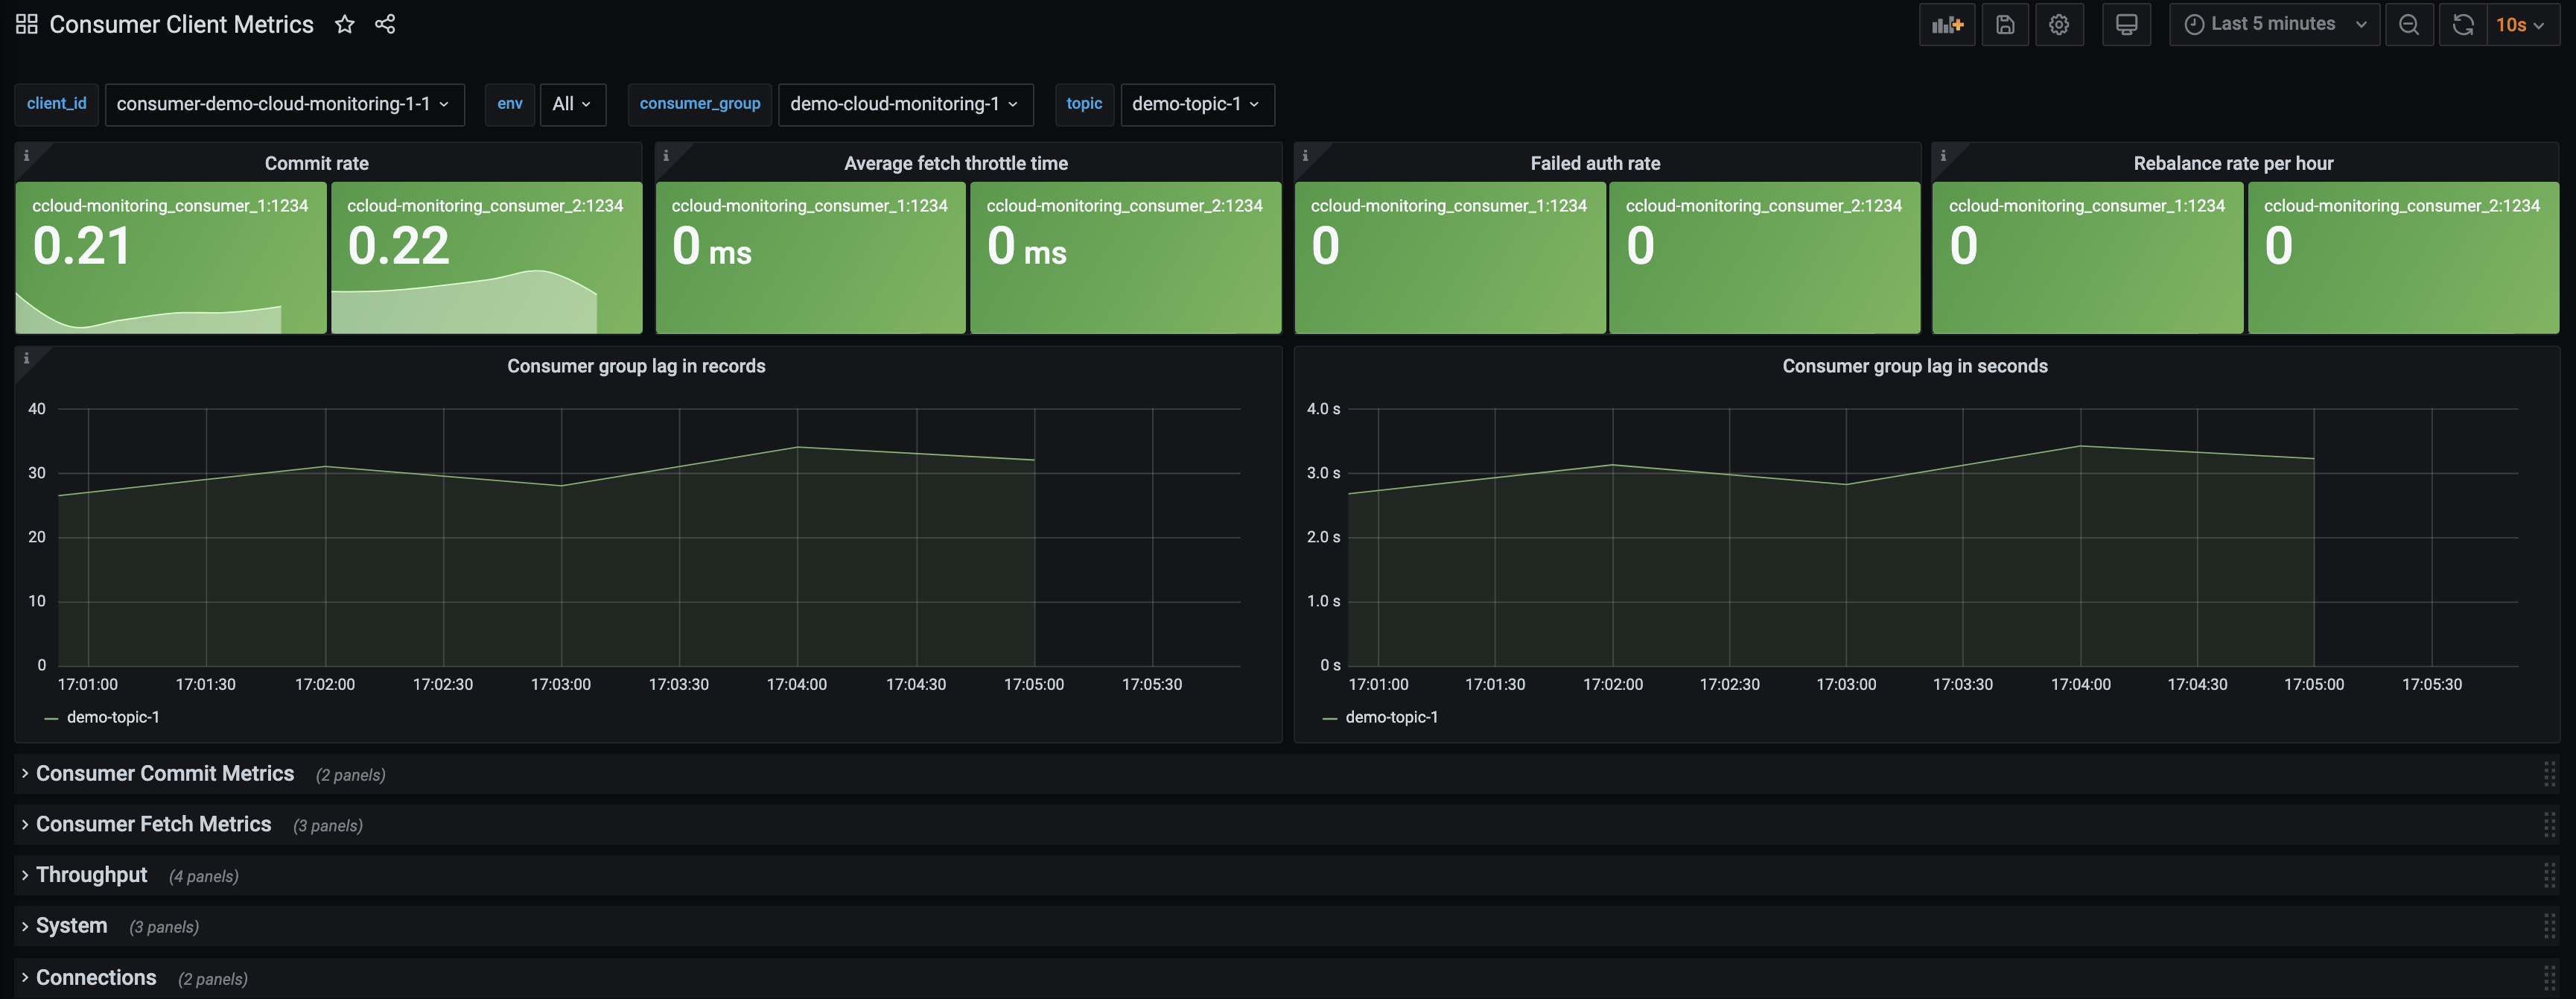
Consumer Client Metricsdashboard. Wait 2 minutes and then observe:An upward trend in
Consumer group lag in records.Consumer group lag in secondswill have a less dramatic increase. Both indicate that the producer is creating more messages than the consumer can fetch in a timely manner. These metrics are derived from thekafka-lag-exportercontainer.

An increase in
Fetch request rate(fetch-total) andFetch size avg(fetch-size-avg) in theConsumer Fetch Metricstab, indicating the consumer is fetching more often and larger batches.

All of the graphs in the
Throughputare indicating the consumer is processing more bytes/records.

Note
If a client is properly tuned and has adequate resources, an increase in throughput metrics or fetch metrics won’t necessarily mean the consumer lag will increase.
Another view of consumer lag can be found in Confluent Cloud. Open the console, navigate to the “Consumers” section and click on the
demo-cloud-observability-1consumer group. This page will update periodically, within two minutes you should see a steady increase is the offset lag.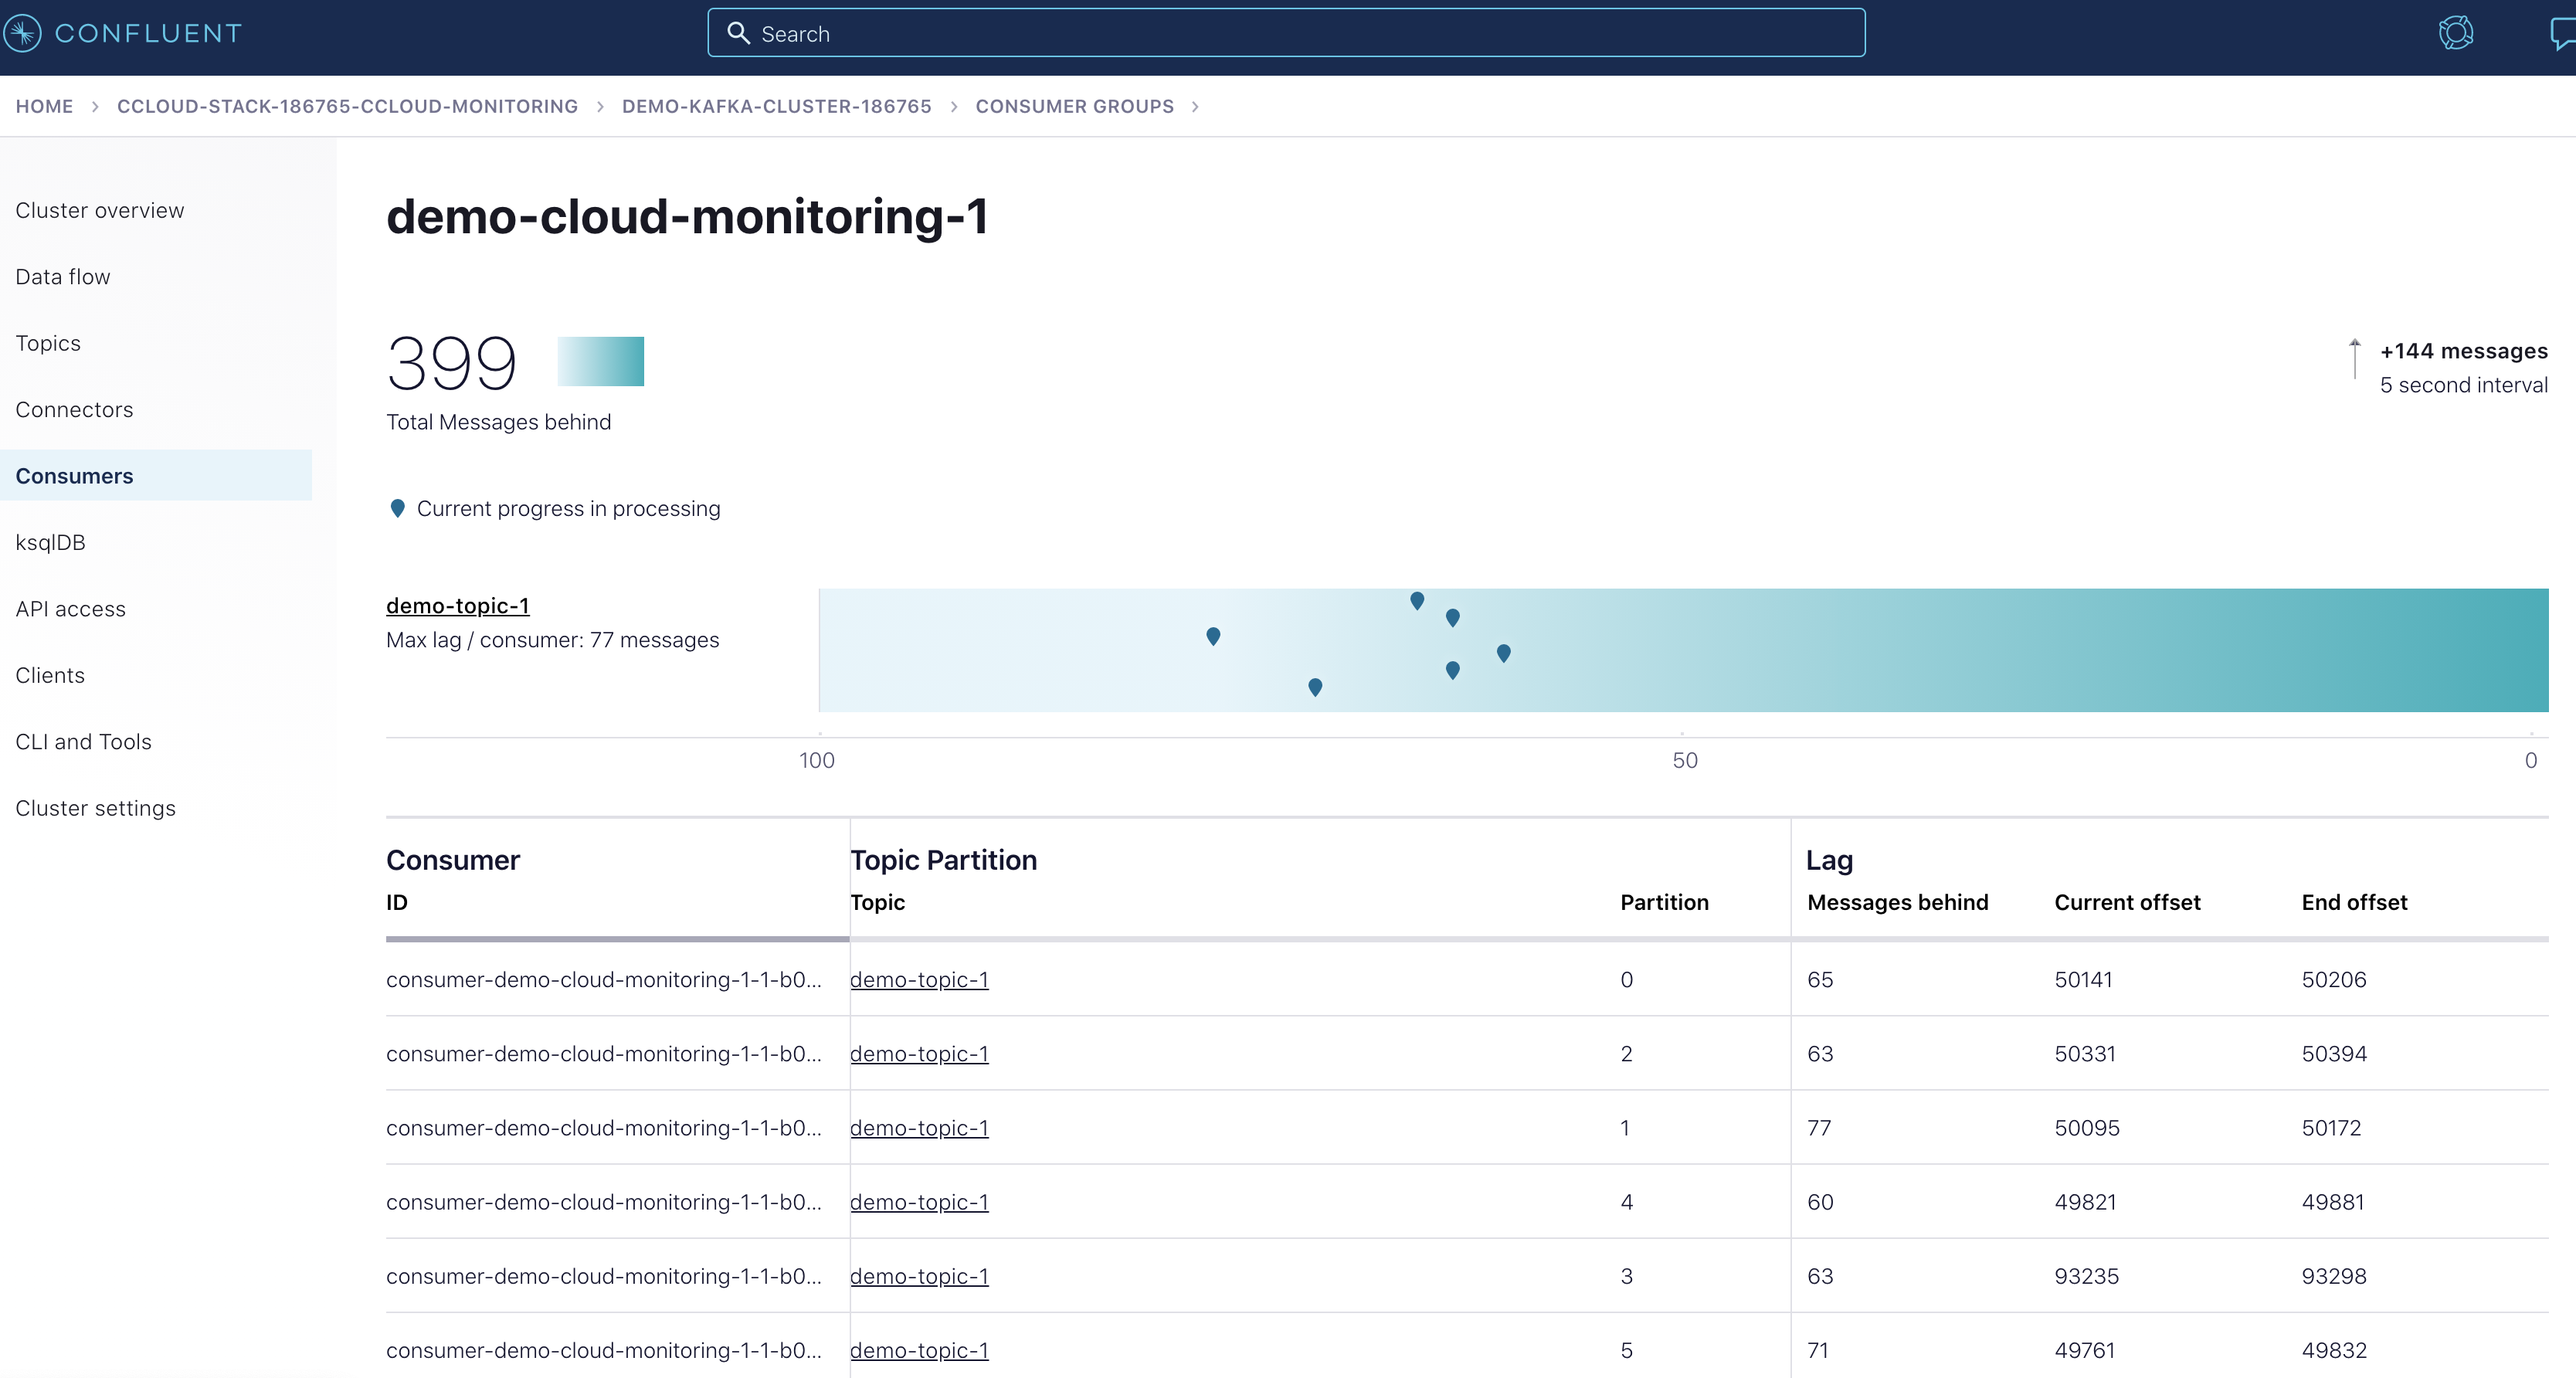
This provides a snapshot in time, but it lacks the historical view that the
Consumer Client Metricsdashboard provides.The current consumer lag can also be observed via the CLI if you have Confluent Platform installed.
kafka-consumer-groups --bootstrap-server $BOOTSTRAP_SERVERS --command-config $CONFIG_FILE --describe --group demo-cloud-observability-1
This produces something similar to the following:
GROUP                   TOPIC           PARTITION  CURRENT-OFFSET  LOG-END-OFFSET  LAG             CONSUMER-ID                                                             HOST            CLIENT-ID
demo-cloud-observability-1 demo-topic-1    0          48163           48221           58              consumer-demo-cloud-observability-1-1-b0bec0b5-ec84-4233-9d3e-09d132b9a3c7 /10.2.10.251    consumer-demo-cloud-observability-1-1
demo-cloud-observability-1 demo-topic-1    3          91212           91278           66              consumer-demo-cloud-observability-1-1-b0bec0b5-ec84-4233-9d3e-09d132b9a3c7 /10.2.10.251    consumer-demo-cloud-observability-1-1
demo-cloud-observability-1 demo-topic-1    4          47854           47893           39              consumer-demo-cloud-observability-1-1-b0bec0b5-ec84-4233-9d3e-09d132b9a3c7 /10.2.10.251    consumer-demo-cloud-observability-1-1
demo-cloud-observability-1 demo-topic-1    5          47748           47803           55              consumer-demo-cloud-observability-1-1-b0bec0b5-ec84-4233-9d3e-09d132b9a3c7 /10.2.10.251    consumer-demo-cloud-observability-1-1
demo-cloud-observability-1 demo-topic-1    1          48097           48151           54              consumer-demo-cloud-observability-1-1-b0bec0b5-ec84-4233-9d3e-09d132b9a3c7 /10.2.10.251    consumer-demo-cloud-observability-1-1
demo-cloud-observability-1 demo-topic-1    2          48310           48370           60              consumer-demo-cloud-observability-1-1-b0bec0b5-ec84-4233-9d3e-09d132b9a3c7 /10.2.10.251    consumer-demo-cloud-observability-1-1
Again the downside of this view is the lack of historical context that the
Consumer Client Metricsdashboard provides.A top level view of the Confluent Cloud cluster that reflects an increase in bytes produced and bytes consumed can be viewed in the
Confluent Clouddashboard in the panels highlighted below.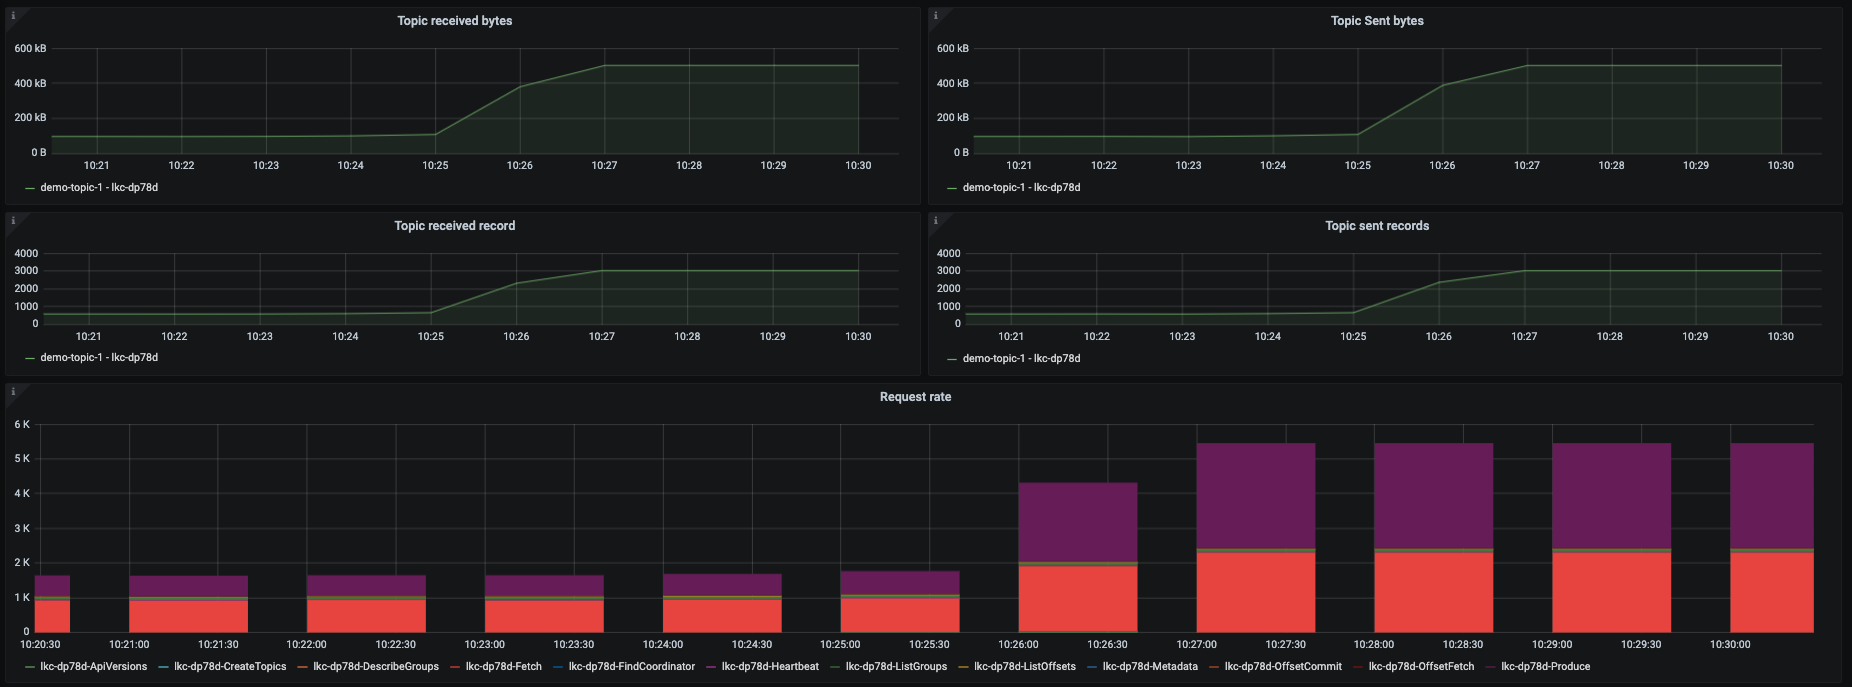
The consumer logs won’t show that the consumer is falling behind which is why it is important to have a robust monitoring solution that covers consumer lag.
Resolve failure scenario
Start consumer-1 container, thus adding a consumer back to the consumer group, and stop the extra producers:
docker compose up -d --scale producer=1
This produces the following output:
node-exporter is up-to-date
grafana is up-to-date
kafka-lag-exporter is up-to-date
prometheus is up-to-date
ccloud-exporter is up-to-date
Stopping and removing ccloud-observability_producer_2 ... done
Stopping and removing ccloud-observability_producer_3 ... done
Stopping and removing ccloud-observability_producer_4 ... done
Stopping and removing ccloud-observability_producer_5 ... done
Starting ccloud-observability_consumer_1              ... done
Starting ccloud-observability_producer_1              ... done
General Client Scenarios
Confluent Cloud offers different cluster types, each with its own usage limits. This demo assumes you are running on a “basic” or “standard” cluster; both have similar limitations. Limits are important to be cognizant of, otherwise you will find client requests getting throttled or denied. If you are bumping up against your limits, it might be time to consider upgrading your cluster to a different type.
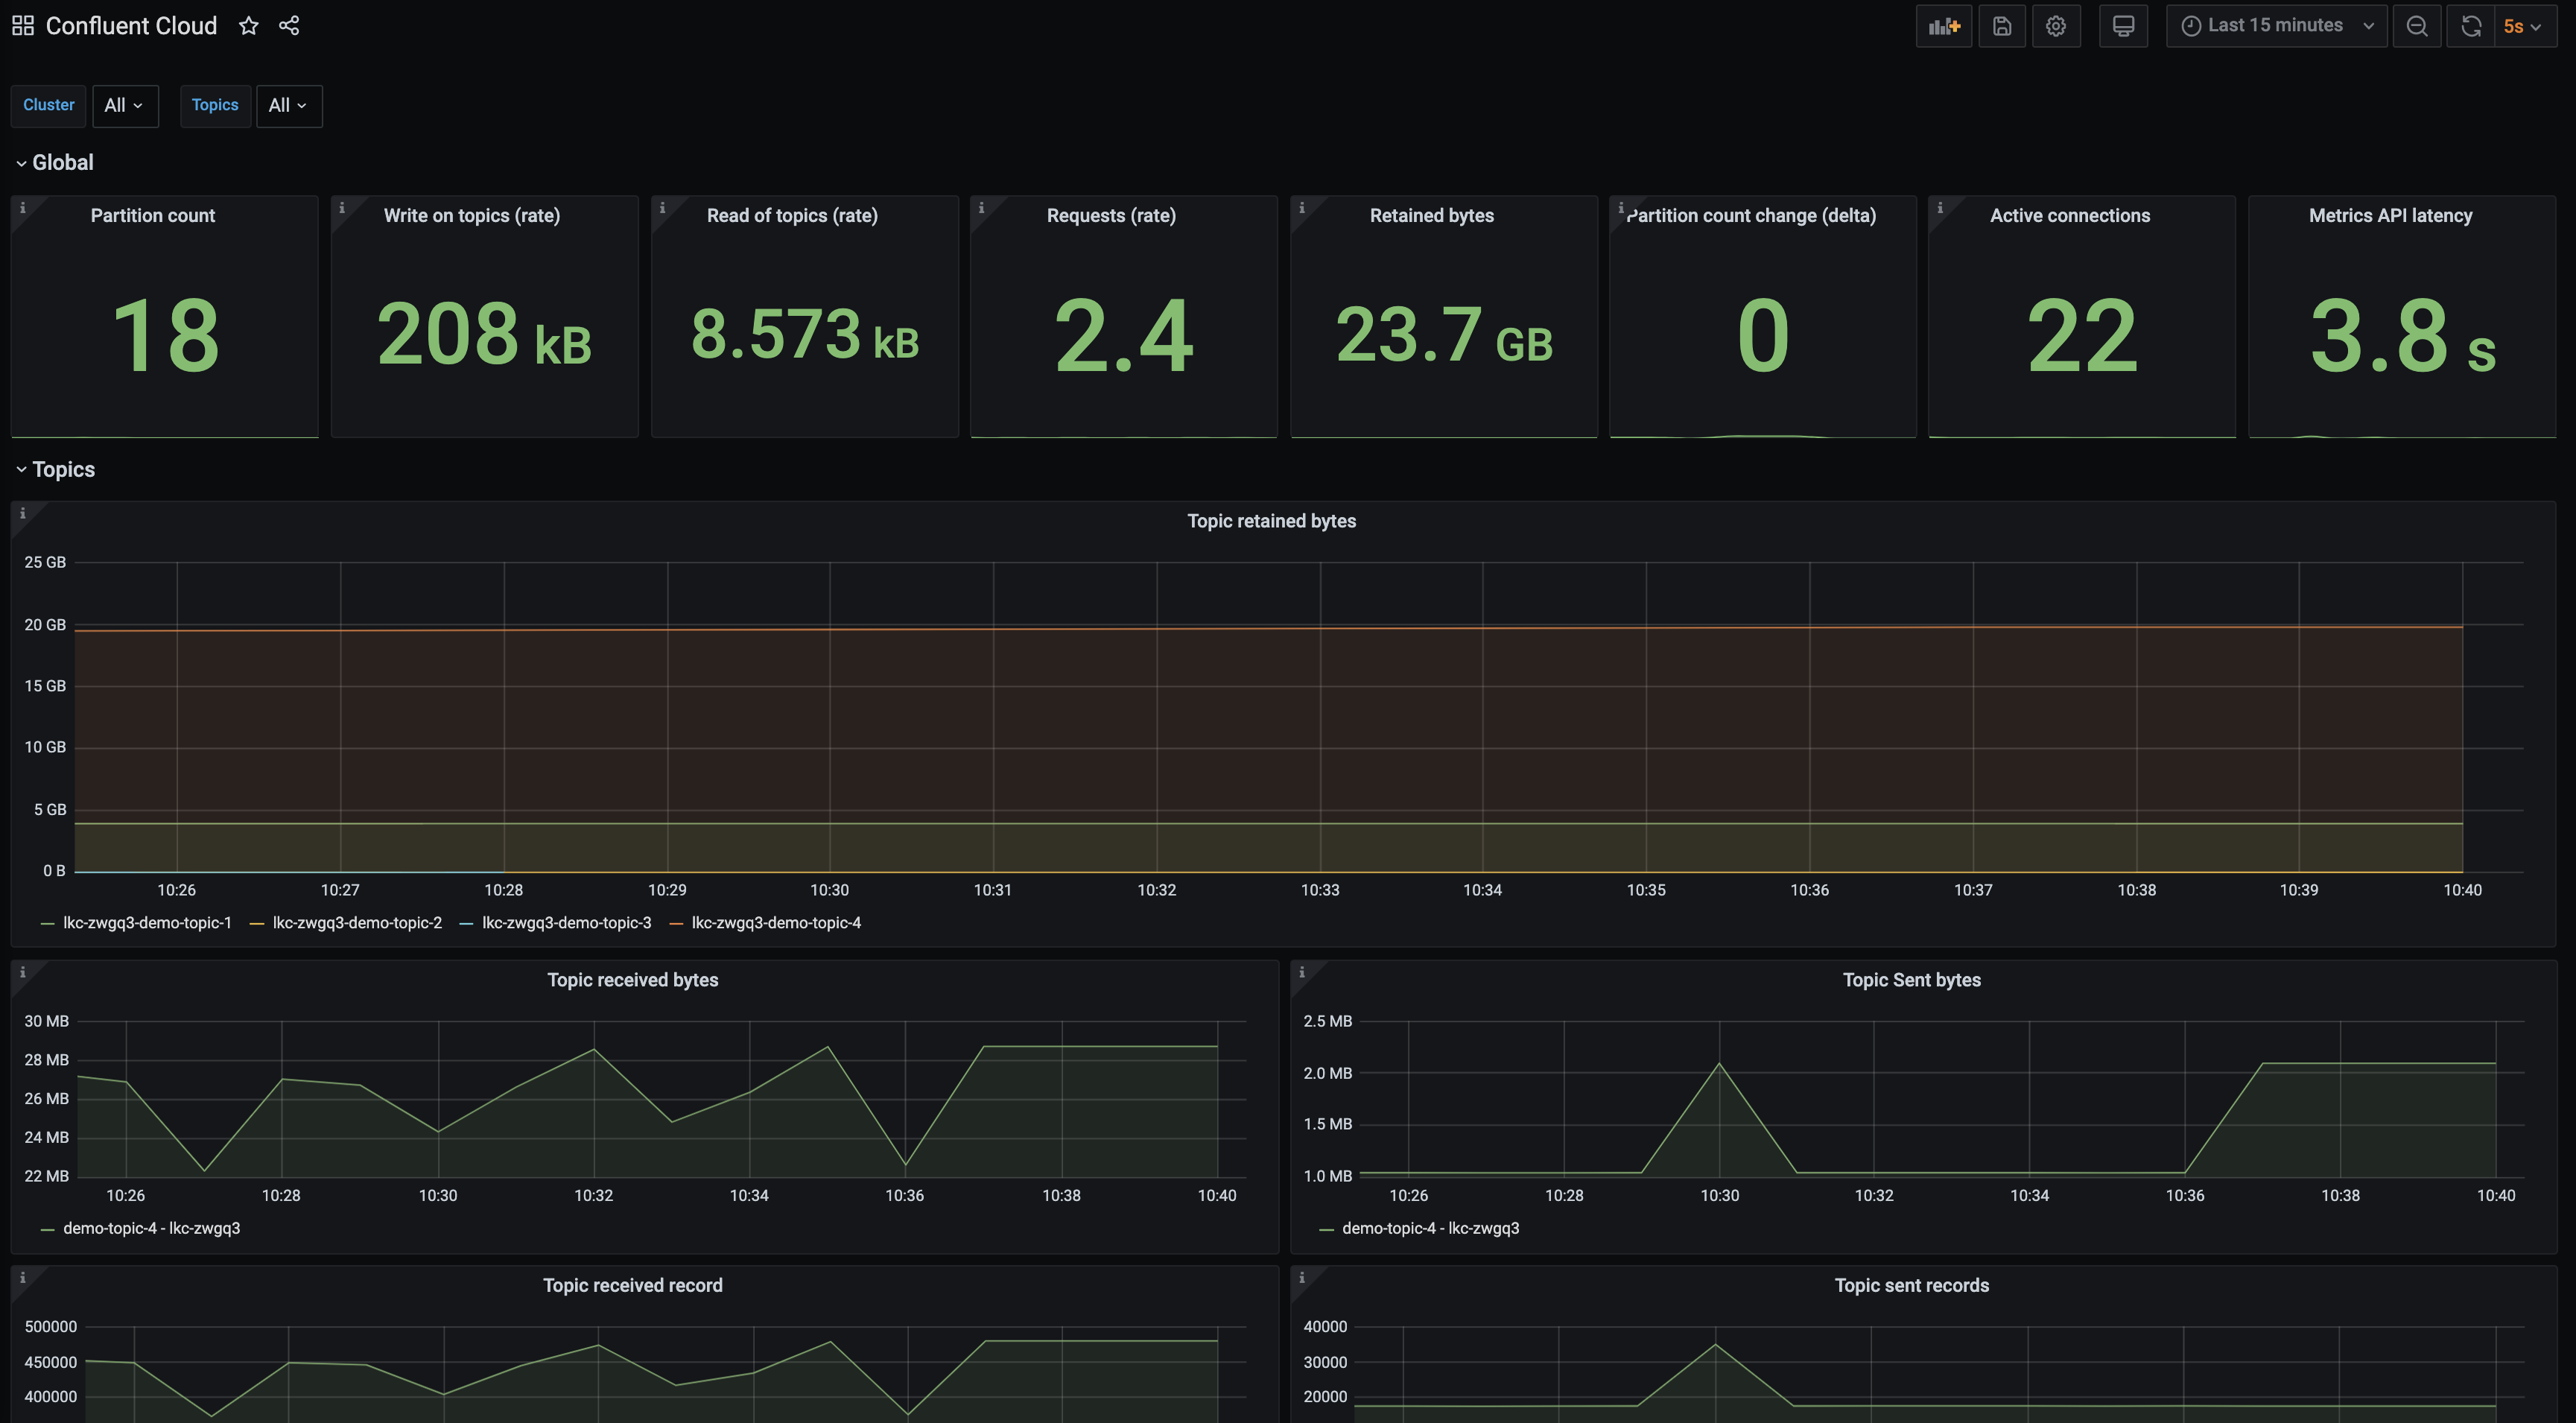
The dashboard and scenarios in this section are powered by Metrics API data. While it is not totally unrealistic to instruct you to hit cloud limits in this demo, we will not do so because users may not have enough resources on their local machines or enough network bandwidth to reach Confluent Cloud limits. In addition to that, we will not instruct you to hit Confluent Cloud limits because of the potential costs it could accrue. Instead the following will walk you through where to look in this dashboard if you are experiencing a problem.
Failing to create a new partition
It’s possible you won’t be able to create a partition because you have reached a one of Confluent Cloud’s partition limits. Follow the instructions below to check if your cluster is getting close to its partition limits.
Open Grafana and use the username
adminand passwordpasswordto login.Navigate to the
Confluent Clouddashboard.Check the
Partition Countpanel. If this panel is yellow, you have used 80% of your allowed partitions; if it’s red, you have used 90%.
A maximum number of partitions can exist on the cluster at one time, before replication. All topics that are created by you as well as internal topics that are automatically created by Confluent Platform components–such as ksqlDB, Kafka Streams, Connect, and Control Center–count towards the cluster partition limit.
Check the
Partition count change (delta)panel. Confluent Cloud clusters have a limit on the number of partitions that can be created and deleted in a 5 minute period. This statistic provides the absolute difference between the number of partitions at the beginning and end of the 5 minute period. This over simplifies the problem. For example, at the start of a 5 minute window you have 18 partitions. During the 5 minute window you create a new topic with 6 partitions and delete a topic with 6 partitions. At the end of the five minute window you still have 18 partitions but you actually created and deleted 12 partitions.More conservative thresholds are put in place–this panel will turn yellow when at 50% utilization and red at 60%.
Request rate limits
Confluent Cloud has a limit on the maximum number of client requests allowed within a second. Client requests include but are not limited to requests from a producer to send a batch, requests from a consumer to commit an offset, or requests from a consumer to fetch messages. If request rate limits are hit, requests may be refused and clients may be throttled to keep the cluster stable. When a client is throttled, Confluent Cloud will delay the client’s requests for produce-throttle-time-avg (in ms) for producers or fetch-throttle-time-avg (in ms) for consumers
Confluent Cloud offers different cluster types, each with its own usage limits. This demo assumes you are running on a “basic” or “standard” cluster; both have a request limit of 1500 per second.
Open Grafana and use the username
adminand passwordpasswordto login.Navigate to the
Confluent Clouddashboard.Check the
Requests (rate)panel. If this panel is yellow, you have used 80% of your allowed requests; if it’s red, you have used 90%. See Grafana documentation for more information about about configuring thresholds.
Scroll lower down on the dashboard to see a breakdown of where the requests are to in the
Request ratestacked column chart.
Reduce requests by adjusting producer batching configurations (
linger.ms), consumer batching configurations (fetch.max.wait.ms), and shut down unnecessary clients.
Clean up Confluent Cloud resources
Run the ./stop.sh script, passing the path to your stack configuration as an argument. Insert your service account ID instead of sa-123456 in the example below. Your service account ID can be found in your client configuration file path (i.e., stack-configs/java-service-account-sa-123456.config).
The METRICS_API_KEY environment variable must be set when you run this script in order to delete the Metrics API key that start.sh created for Prometheus to be able to scrape the Metrics API. The key was output at the end of the start.sh script, or you can find it in the .env file that start.sh created.
METRICS_API_KEY=XXXXXXXXXXXXXXXX ./stop.sh stack-configs/java-service-account-sa-123456.config
You will see output like the following once all local containers and Confluent Cloud resources have been cleaned up:
Deleted API key "XXXXXXXXXXXXXXXX".
[+] Running 7/7
 ⠿ Container kafka-lag-exporter               Removed                                                         0.6s
 ⠿ Container grafana                          Removed                                                         0.5s
 ⠿ Container prometheus                       Removed                                                         0.5s
 ⠿ Container node-exporter                    Removed                                                         0.4s
 ⠿ Container ccloud-observability-consumer-1  Removed                                                         0.6s
 ⠿ Container ccloud-observability-producer-1  Removed                                                         0.6s
 ⠿ Network ccloud-observability_default       Removed                                                         0.1s
This script will destroy all resources in java-service-account-sa-123456.config.  Do you want to proceed? [y/n] y
Now using "env-123456" as the default (active) environment.
Destroying Confluent Cloud stack associated to service account id sa-123456
Deleting CLUSTER: demo-kafka-cluster-sa-123456 : lkc-123456
Deleted Kafka cluster "lkc-123456".
Deleted API key "XXXXXXXXXXXXXXXX".
Deleted service account "sa-123456".
Deleting ENVIRONMENT: prefix ccloud-stack-sa-123456 : env-123456
Deleted environment "env-123456".
Additional Resources
Read Monitoring Your Event Streams: Tutorial for Observability Into Apache Kafka Clients.
See other Confluent Cloud Examples.
See advanced options for working with the ccloud-stack utility for Confluent Cloud.
See Developing Client Applications on Confluent Cloud for a guide to configuring, monitoring, and optimizing your Kafka client applications when using Confluent Cloud.
See jmx-monitoring-stacks for examples of monitoring on-premises Kafka clusters and other clients with different monitoring technologies.
