
Monitor Kafka Consumer Lag in Confluent Cloud
Consumer lag is the difference between the rate at which producers write records to an Apache Kafka® topic and the rate at which consumers read them. When consumers fall behind, unprocessed records accumulate. Consumer lag has two components:
Offset lag: The difference between the latest offset available in a Kafka topic partition and the offset that a consumer group has consumed.
Consumer latency: The time delay between production and consumption.
In Confluent Cloud, you can monitor consumer lag using several methods, summarized in the following table.
To identify the specific cause of lag, you can use different tools depending on the level of detail you need. Use the Cloud Console and Metrics API for overall lag metrics, and use Java client metrics and the Kafka Admin API to monitor offset lag specifically. For more information, see Use the Metrics API to monitor Kafka consumer groups, Use the Confluent Cloud Console to monitor Kafka consumer lag, Use Java client metrics to monitor Kafka offset lag, and Use Kafka Admin API to monitor offset lag.
Method |
Best for |
Granularity |
Setup |
|---|---|---|---|
Metrics API |
Production monitoring, alerting, dashboards |
Topic + consumer group (partition with query) |
API call or integration |
Cloud Console |
Quick visual checks, ad-hoc debugging |
Consumer group + partition |
None (built-in) |
Java client metrics |
Application-level monitoring |
Per-consumer instance |
Java Management Extensions (JMX) or metrics reporter |
Kafka Admin API + CLI |
Programmatic offset tracking, scripting |
Partition-level |
CLI + API key |
Confluent CLI |
Quick consumer group lag checks (Dedicated clusters only) |
Consumer group + partition |
CLI + API key |
REST API |
Programmatic consumer group access (Dedicated clusters only) |
Consumer group |
API key |
See also
For an example that showcases how to monitor a Kafka client application and Confluent Cloud metrics, and steps through various failure scenarios to show metrics results, see the Observability for Kafka Clients to Confluent Cloud.
Use the Metrics API to monitor Kafka consumer groups
Use the Metrics API to monitor how consumer lag changes over time. To monitor at the topic and consumer group level of detail, you can use a supported integration. To view data at the more detailed consumer and partition level, you can begin from the example query.
If the group has been in the EMPTY state for less than one day, the
io.confluent.kafka.server/consumer_lag_offsets metric emits lag for it.
The metric also emits lag for groups in the STABLE state.
For example, consider a consumer group that remains in the EMPTY state
for more than a day because its consumers are unresponsive. The Metrics
API no longer returns data for that group because it doesn’t expose lag
for topics and partitions without an active consumer for that long.
If you notice a large response output, it could be due to a high number
of EMPTY state groups on your cluster. As a best practice, reuse
consumer groups where possible and periodically delete empty groups
with the
kafka-consumer-groups tool.
Note
Consumers that use the assign() method don’t report lag.
Monitor consumer group rebalancing
To monitor rebalance events, use the
io.confluent.kafka.server/max_pending_rebalance_time_milliseconds metric,
which shows the maximum pending rebalance time in milliseconds among all members
of a consumer group. The value shows how long a consumer group is in the
rebalancing state. A value of zero for this metric indicates that the consumer
group is in a state other than rebalancing.
Along with monitoring consumer lag, also monitor consumer group rebalance events. Frequent rebalance events or long individual rebalance events could result in lower productivity of your applications and could result in service disruption. This is more likely when using consumer groups with the classic group protocol, which is the only option available before Kafka version 4.0.
Here is an example response when querying this metric:
 {
     "data": [
      {
          "metric.consumer_group_id": "test-group",
          "metric.group_protocol": "CLASSIC",
          "timestamp": "2025-11-14T16:00:00Z",
          "value": 0.0
      },
      {
          "metric.consumer_group_id": "test-group",
          "metric.group_protocol": "CLASSIC",
          "timestamp": "2025-11-14T16:01:00Z",
          "value": 14594.0
      },
      {
          "metric.consumer_group_id": "test-group",
          "metric.group_protocol": "CLASSIC",
          "timestamp": "2025-11-14T16:02:00Z",
          "value": 0.0
      }
    ]
}
In this example, the consumer group had a rebalance event at
2025-11-14T16:01:00Z which lasted for about 14.5 seconds. Previously, this
specific consumer group was empty and the rebalance event occurred when a
consumer joined the group. After the rebalance event, the consumer group went to
being stable. This metric does not discern whether the group was empty or stable
during periods where the value shows 0.0. However, you can gather that from
situational context or more explicitly through client logs. Depending on the
situation, you can use this metric to understand the following:
How long individual rebalance events last.
How many rebalance events occurred in a given time frame.
When a certain group was last seen not in a rebalancing state.
To help reduce the impact of rebalance events in general, use the new consumer group protocol type, which was introduced in Kafka version 4.0. For more information on the new group protocol and how it can help reduce the impact of rebalancing, see groups and rebalance protocols.
Use the Confluent Cloud Console to monitor Kafka consumer lag
Cloud Console uses the Metrics API to monitor consumer lag and provides
output that is different from kafka-consumer-groups. For more information,
see Use the Metrics API to monitor Kafka consumer groups.
You might notice clients that use a naming convention similar to this:
consumer-nnnn. These clients represent the Confluent Cloud interface itself.
To monitor consumer lag with Cloud Console:
Select your cluster name.
Choose Clients and select Consumer Lag. A list of consumer groups displays.
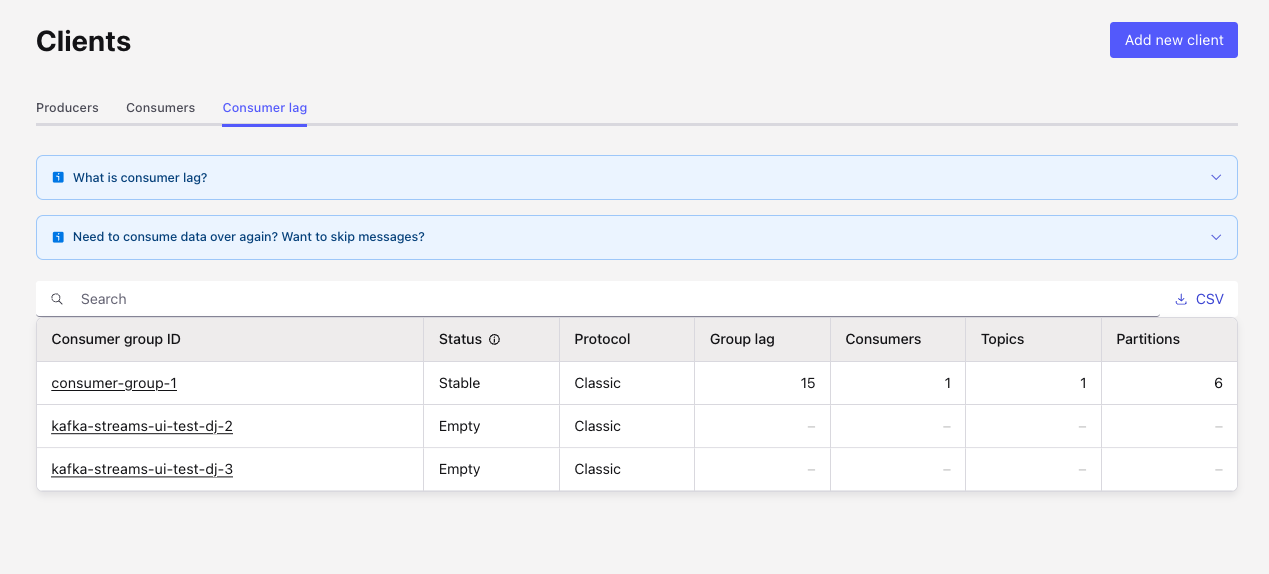
The consumer group list displays information about your consumer groups, including the group ID, status, and protocol. You can also find values for group lag, and number of consumers, topics, and partitions. For more information, see Kafka Consumer for Confluent Cloud.
Cloud Console limits the number of consumer groups shown in Consumer lag if there are many.
You can export consumer lag data as a CSV file. For clusters with large amounts of data, you might see a placeholder value like
-999in thecurrentOffsetfield. This occurs because Cloud Console cannot display all the data immediately, and the offsets are not yet available. For large payloads, consider exporting consumer lag data using the Confluent CLI or Confluent Cloud APIs.
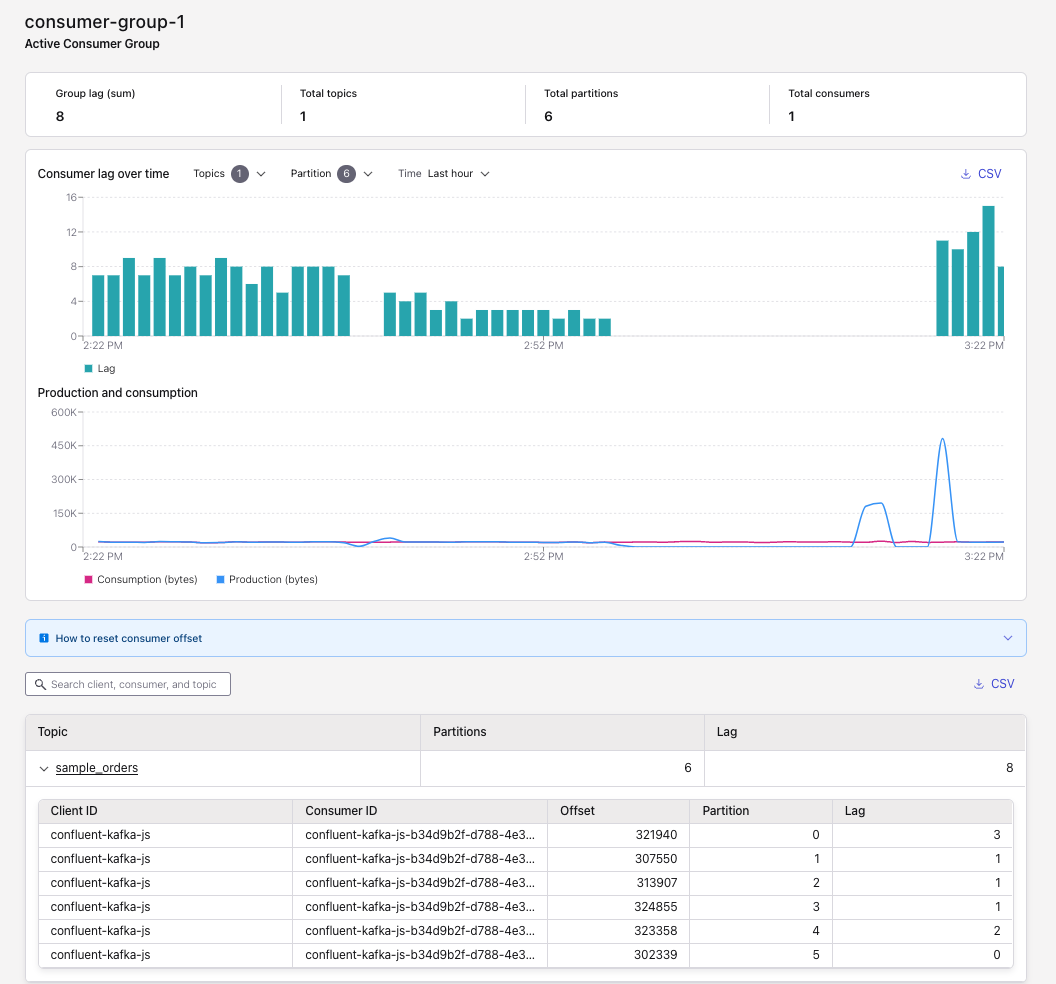
Select a consumer group from the list to see lag details for that group.
For more information on creating a consumer, see Quick Start for Confluent Cloud.
Use Java client metrics to monitor Kafka offset lag
Offset lag is the difference between the latest offset available in a Kafka topic partition and the offset that a consumer group has consumed. This value indicates how far behind the consumer group is from the latest available data.
You can monitor the records-lag-max metric from the
Java consumer.
Use Kafka Admin API to monitor offset lag
You can monitor offsets by using the Kafka Admin API and the associated command-line tool, which enables accessing lag information programmatically. For more information, see AdminClient Configurations.
Prerequisites
Access to Confluent Cloud.
Java version 1.7.0_111 or later, 1.8.0_102 or later, and 1.9.
A web browser.
Confluent Platform is installed.
Create a client properties file to hold the Confluent Cloud configuration. In this example, it is named
client_ssl.properties. This file should contain the Confluent Cloud client configurations. You can find this information in the CLI and client configuration tab of Confluent Cloud Console. Configure this example for your environment:ssl.endpoint.identification.algorithm=https sasl.mechanism=PLAIN sasl.jaas.config=org.apache.kafka.common.security.plain.PlainLoginModule required \ username="<cluster-api-key>" \ password="<cluster-api-secret>"; security.protocol=SASL_SSL
Note
Use a Confluent Cloud API key (resource-scoped for the Kafka cluster) and secret for the
usernameandpasswordconfigs. Using a Confluent Cloud API key with the wrong resource scope causes authentication to fail.Set the
BOOTSTRAP_SERVERSvariable to the Confluent Cloud cluster bootstrap URL. You can find this value by clicking Cluster settings in the Cloud Console.BOOTSTRAP_SERVERS="<bootstrap-url>"
From the Confluent Platform installation home, list the consumer groups. Pass Confluent Cloud properties with the
--command-configargument. You must provide a bootstrap server to the script../bin/kafka-consumer-groups --bootstrap-server ${BOOTSTRAP_SERVERS} --command-config \ client-ssl.properties --list _confluent-healthcheck example-group
If the previous command causes a timeout error, try increasing the timeout to
10seconds by using the--timeoutoption, for example,--timeout 10000.For each consumer group, check its offsets using this command. This command only shows information about consumers that use the Java consumer API (that is, non-ZooKeeper-based consumers).
./bin/kafka-consumer-groups --bootstrap-server ${BOOTSTRAP_SERVERS} \
 --command-config /tmp/client.properties --describe --group _confluent-healthcheck
Your output should resemble:
TOPIC                          PARTITION  CURRENT-OFFSET  LOG-END-OFFSET  LAG        CONSUMER-ID                                       HOST                           CLIENT-ID
_confluent-healthcheck         0          13164704        13164773        69         healthcheck-agent-bf8d1655-63a6-4061-b680-0f11cdf182e5/100.96.67.0                   healthcheck-agent
_confluent-healthcheck         1          13161581        13161650        69         healthcheck-agent-bf8d1655-63a6-4061-b680-0f11cdf182e5/100.96.67.0                   healthcheck-agent
_confluent-healthcheck         2          12229509        12229578        69         healthcheck-agent-bf8d1655-63a6-4061-b680-0f11cdf182e5/100.96.67.0                   healthcheck-agent
_confluent-healthcheck         3          86              86              0          healthcheck-agent-bf8d1655-63a6-4061-b680-0f11cdf182e5/100.96.67.0                   healthcheck-agent
...
The fourth column shows the offset lag, the difference between the latest offset available in the topic partition and the offset that the consumer group has consumed.
Known kafka-consumer-groups issues
You might encounter the following error, or the command might fail with a
TimeoutException:
Error: Executing consumer group command failed due to Failed to construct kafka consumer
In either case, raise the request.timeout.ms configuration in
client_ssl.properties (which defaults to 5000 in the
kafka-consumer-groups command line tool). For example:
request.timeout.ms=60000
Best practices for monitoring consumer lag
Set alerting thresholds on consumer lag. Alert when lag exceeds a defined number of records or grows continuously for a sustained period. Use the Metrics API or a third-party integration to configure alerts.
Monitor lag trends, not absolute values alone. A small, steady lag is normal. Growing lag over time indicates a consumer that cannot keep up with the production rate.
Check offset lag and consumer latency. Offset lag is the difference between the latest offset available in a Kafka topic partition and the offset that a consumer group has consumed. Consumer latency is the time delay between production and consumption. Together, they help you distinguish between slow consumers and stuck consumers.
Monitor rebalance frequency and duration alongside lag. Frequent or long rebalance events cause lag spikes. Use the
max_pending_rebalance_time_millisecondsmetric to detect them.Use the consumer group protocol to reduce rebalance impact. The consumer group protocol, introduced in Kafka version 4.0, reduces the duration and frequency of rebalance events compared to the classic group protocol, the only option available before Kafka version 4.0.