
Dedicated Cluster Performance and Expansion in Confluent Cloud
A number of factors can affect the overall performance of applications running on Dedicated Apache Kafka® clusters. Monitor your clusters for clues to how you can improve performance in your applications, and to determine whether cluster expansion is the right solution.
Key cluster performance metrics:
For more about monitoring your applications, see Monitoring Your Event Streams: Tutorial for Observability Into Apache Kafka Clients (blog).
Interpret a high cluster load value
Cluster load is a percentage value between 0 and 100, with 0% indicating no load on the cluster, and 100% representing a fully saturated cluster. You can measure cluster load as an average value or a maximum value across the brokers in the cluster. A high average cluster load, which typically also means a high maximum cluster load, usually indicates a fully saturated cluster. Higher load values on a cluster commonly result in higher latencies, client throttling, or both for your application. Expect higher latency and some degree of throttling if the average cluster load is greater than 80%.
If the maximum cluster load is high but the average cluster load is much lower, this is a sign of a skewed workload, where a small number of partitions handle disproportionately more traffic than the rest of the cluster. In this case, investigate the hot-partition metric to identify where the skew is occurring.
You could expand your cluster in an attempt to lower the load, but before you do so you should look at the time-series graph for cluster load to obtain a historical perspective of the cluster load variation.
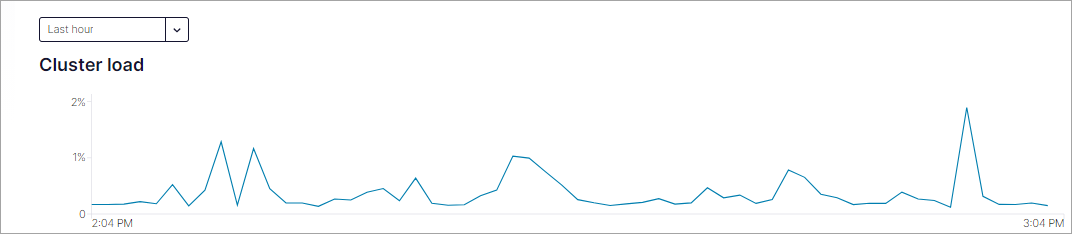
When viewing this graph consider that an average cluster load of 70% might be acceptable if it is an occasional spike or a normal high point for a workload. However, a load of 70% might be too high if the cluster needs more capacity to accommodate load spikes due to variations in application workload patterns, or if you add new workloads to the cluster. In this case, expanding the cluster is probably the right solution.
Generally, expanding your Dedicated cluster provides more capacity for your workloads, and often helps improve the performance of your Kafka applications. In addition, a lower cluster load can help improve latency for your applications.
If you expand a Dedicated cluster, and the expansion does not resolve the performance issues, you can shrink the cluster back to its original size.
To interpret a high average cluster load value, consider the following guidelines:
Values of 70 to 80: Unless these are occasional peaks, consider adding CKU.
Values of 80 or more: Expect throttling and degraded performance if the workload pattern changes and introduces additional load on the overall system.
Determine CKU count
CKUs determine the capacity of your cluster. Use the CKU count metric to determine the capacity of your Dedicated cluster. While some performance dimensions for Dedicated clusters are fixed, others have a recommended guideline that allows you greater use of one dimension at the expense of another. For more information, see Fixed limits and recommended guidelines, Dimensions with fixed limits and Dimensions with recommended guidelines.
Identify hot partitions
Use the hot-partition metric together with the cluster load metrics to identify workload skew. A hot partition is a partition where the maximum cluster load is much higher than the average cluster load. If a hot-partition metric value of 1 appears on any topic or partition, and there is a large gap between the maximum and average cluster load, the workload is skewed. Self-balancing clusters (SBC) might not be able to balance these partitions, so to avoid throttling or availability issues, you must manually address hot partitions.
Considerations
If
hot_partition_ingressorhot_partition_egresshas a value of1, then the cluster load for that partition is too high for SBC to balance the partition.To recover a hot partition, first reassess your keying strategy to ensure traffic is distributed more evenly across partitions. If reassessing your keying strategy doesn’t sufficiently resolve the skew, consider adding partitions and redistributing client traffic. The goal is to have enough partitions with traffic distributed evenly across the partitions.
Ensure unsupported clients are not accessing the hot partition. Unsupported clients can cause high cluster load and issues with balancing clusters. For more information, see What client and protocol versions are supported? and Confluent Platform and Apache Kafka compatibility.
To use the hot-partition metrics with an application performance monitoring (APM) application, your APM must use a default zero function to fill empty time intervals with a zero value or an interpolation value, if your APM uses interpolation.
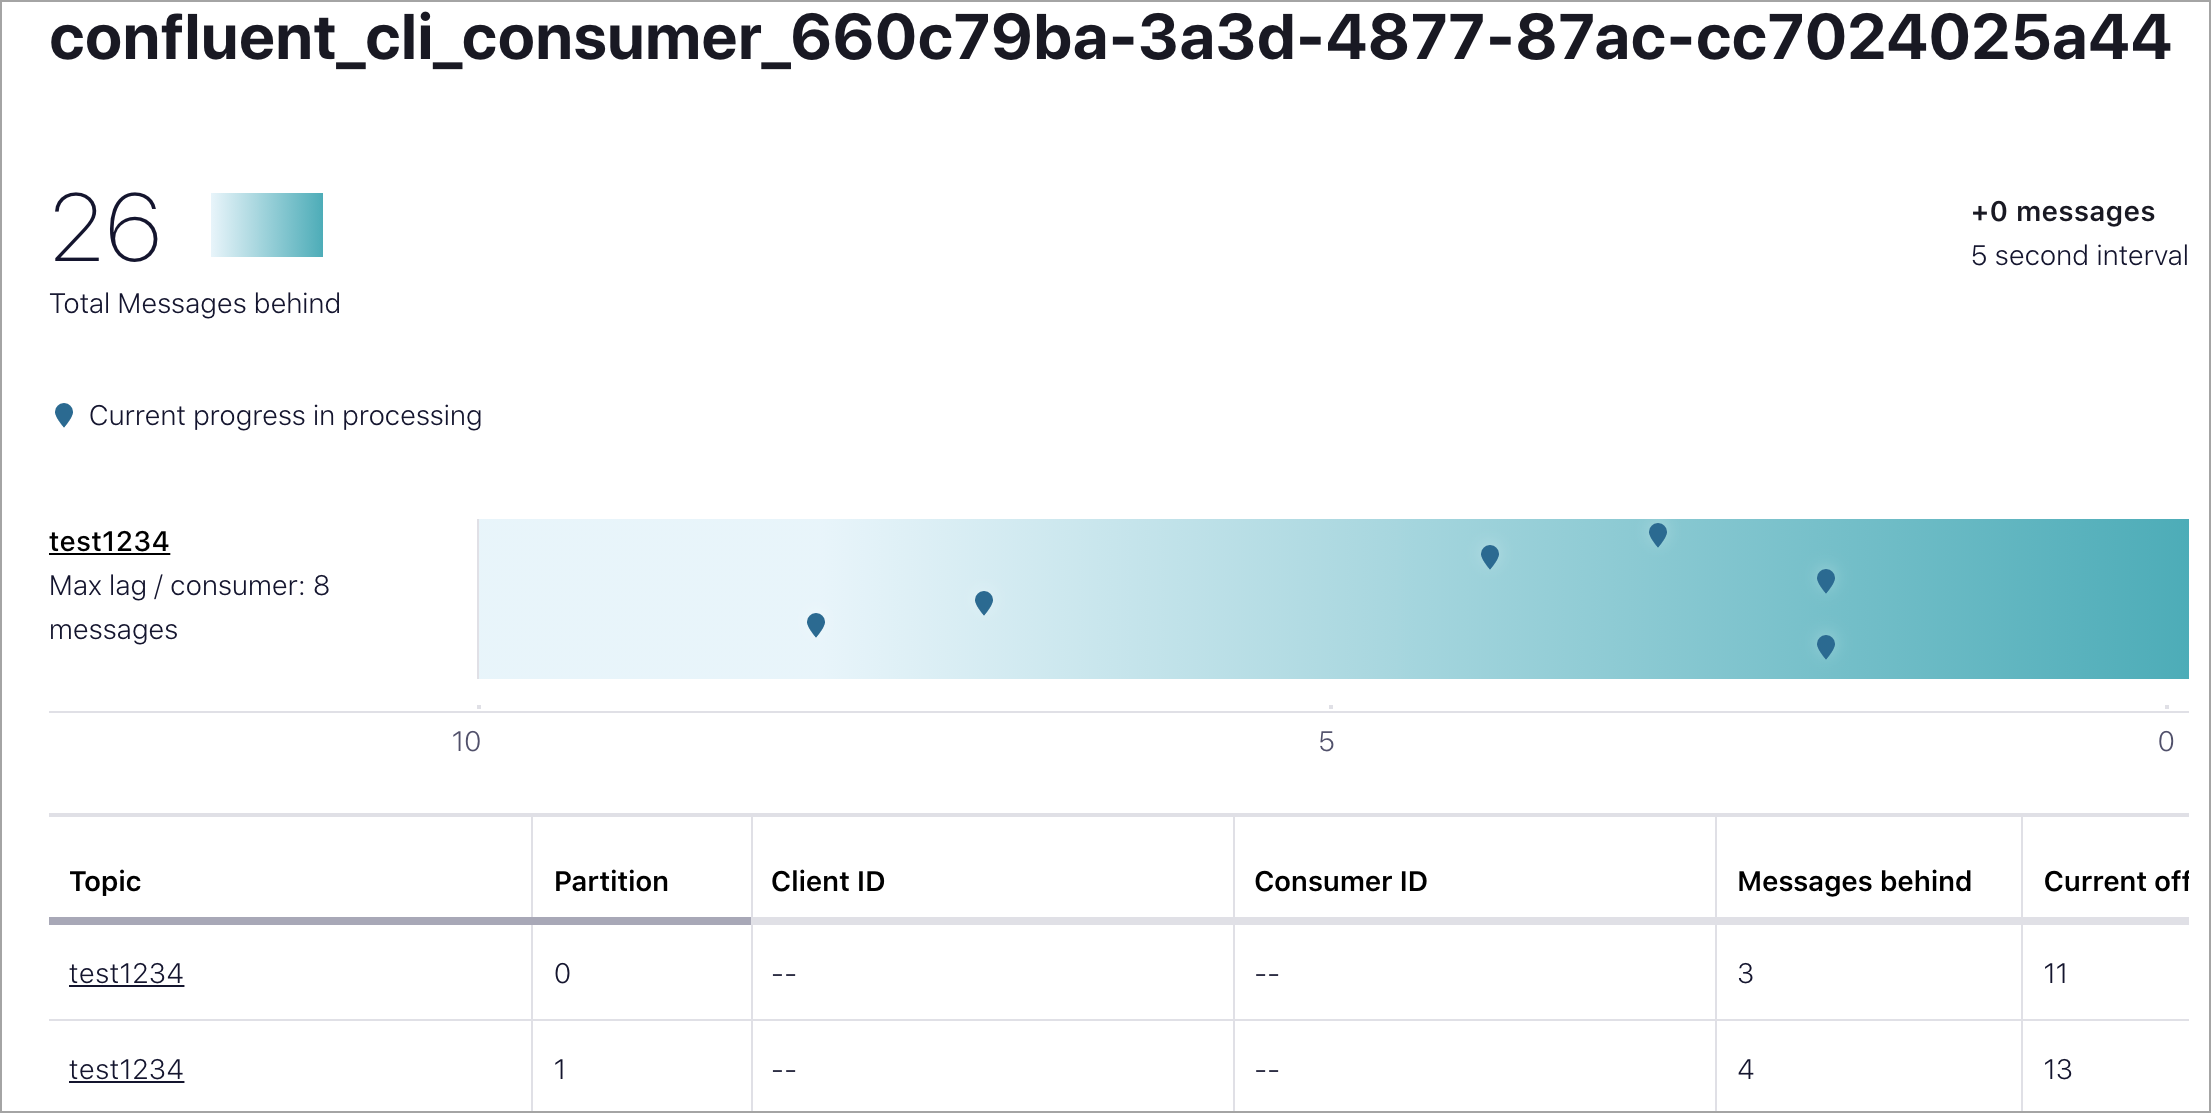
Review high consumer lag
The Consumer lag metric indicates the number of records for any partition that the consumer is behind in the log. If the rate of production of data exceeds the rate at which it is getting consumed, consumer groups measure lag. An increase in consumer lag can indicate a client-side issue, a Kafka server-side issue, or both.
To identify if consumer lag is increasing because of server-side issues, first use the cluster load metric to confirm your cluster isn’t overloaded. If the cluster load metric indicates your cluster is heavily loaded (> 70%), it is safe to assume that expanding your cluster helps with consumer lag.
If the cluster is not heavily loaded, next look at the number of partitions on the cluster. Partitions parallelize the workload across your cluster. As a rule of thumb, you should have somewhere between 6 and 10 partitions at a minimum (per CKU) to get the benefits of parallelization, although your specific workload might warrant a higher or lower number of partitions. For more information on improving parallelization, see Optimize and Tune Confluent Cloud Clients.
If your cluster is not heavily loaded and you have the recommended number of partitions or more on your cluster, then consumer lag might be increasing because there is not enough parallelism in your consumer application. Adding consumers might help resolve this issue.
Monitor for unsupported client versions
Use only supported clients with Confluent Cloud. Update client versions regularly to avoid undesired behavior in your clusters. Some issues that can arise from running unsupported client versions:
Compatibility issues: Confluent Cloud is designed to work with specific versions of client libraries such as Java, .NET, and Python. If you use an unsupported client, it might not have access to necessary libraries, which can lead to unexpected behavior, errors, or failures.
Security vulnerabilities: Confluent Cloud is regularly updated with security patches and bug fixes. Unsupported clients might be missing critical security updates, leaving your applications and data vulnerable to potential security threats or exploits.
Lack of support: Confluent provides support and maintenance only for supported client versions. If you encounter issues or bugs while using an unsupported client version, Confluent might not be able to provide help or troubleshooting, leaving you to resolve the issues on your own.
Missing features and improvements: Newer versions of client libraries often introduce new features, performance improvements, and bug fixes. By using an unsupported client version, you might miss out on these enhancements, which could impact the capabilities, performance, and reliability of your applications.
Potential service disruptions: Confluent Cloud might introduce changes or updates that are designed to work only with supported client versions. Using an unsupported client version could lead to service disruptions or unexpected behavior when such changes are made.
To ensure a stable, secure, and well-supported experience with Confluent Cloud, use only supported client versions for your specific programming language or framework. Confluent provides documentation and guidance on the supported client versions and their compatibility with Confluent Cloud.
For more information, see Supported Versions and Interoperability for Confluent Platform.
Review client application throttles
Throttles are a normal part of working with cloud services. Confluent Cloud clusters throttle client applications if they exceed the rate the cluster is configured to handle based on its allocated capacity. This throttling prevents additional usage that could cause a cluster outage, which might be catastrophic. Throttles are negotiated between the Kafka server and Kafka consumers and producers, ensuring the clients wait long enough for the server to handle the request without compromising uptime.
Beyond client-side metrics, Confluent Cloud provides a managed throttling metric through the Metrics API. The io.confluent.kafka.server/client_limit_milliseconds metric reports the average throttle time applied to a principal (user and service accounts) when a quota is violated, without requiring client-side instrumentation. For more information, see Throttled clients metric.
For more information about client-side, producer, and consumer metrics, which provide visibility into whether your producers, consumers, or both are being throttled, see Client Monitoring and the discussion of produce-throttle-time-avg and produce-throttle-time-max in the Producer Metrics section of the Confluent Platform documentation.
Determine if throttling is caused by server or client issues
The Throttled clients metric includes a metric.reason field that identifies the underlying cause of a throttle, such as a cluster-level quota violation, a principal-level quota violation, or skewed traffic. Use this field as a starting point to determine whether the throttling is a server-side or client-side issue.
To determine if the client throttling is a client-side or a server-side issue, again, see cluster load metric. If the cluster load metric indicates that your cluster is under a high or increasing load, you can reasonably assume that cluster expansion mitigates throttles.
Other server-side characteristics that are important to evaluate as specific causes of throttling are ingress, egress, and request rate.
Remember that the throughput and request rate for a Dedicated cluster are limited by the number of CKUs allocated to the cluster. If your applications are consuming more throughput and making more requests than your cluster can currently handle, expanding your cluster likely resolves the issue.
However, if your cluster is being throttled and you cannot identify a server-side reason, there could be client-side implementations that are causing throttling. For example, your workload might be unbalanced, meaning that one or few partitions are sustaining the vast majority of traffic, leaving the remainder of the cluster underutilized. Confluent Cloud constantly monitors the balance of your cluster to automatically optimize the distribution of your workload. In some cases, Confluent Cloud might not be able to find an optimal balance due to client-side access patterns, such as unbalanced partition assignment strategies.
To ensure the best possible experience for interacting with Kafka, architect your client-side applications appropriately to achieve the best throughput potential.
Monitor latency in producer applications
For the latest Kafka clients, Confluent Cloud provides a native metric to help monitor producer latency without extra client-side instrumentation. The io.confluent.kafka.server/producer_latency_avg_milliseconds metric is available only for clients using Java 3.8 or later with the enable.metrics.push client configuration set to true (the default). For more information, see KIP-714 client metrics.
Certain metrics can also indicate that the producers are experiencing latency. Specifically, the buffer-available-bytes(=0), or increases in bufferpool-wait-time could be an indication of producers experiencing latency.
Monitor active_connection_count. Benchmarking shows that exceeding the number of total client connections per-CKU often leads to an exponential increase in produce latency. For more information, see the total client connections dimension in Dimensions with recommended guidelines table.
If the cluster load metric is high and the producer buffer is high, it is likely that expanding the cluster by adding CKUs improves producer latency. If latency is not improved after cluster expansion, see the previous section on Client applications.