Datadog Metrics Sink for Confluent Cloud
The fully-managed Datadog Metrics Sink connector for Confluent Cloud exports data from Apache Kafka® to Datadog using the post time-series metrics API. The connector can be used to export Kafka records in Avro, JSON Schema (JSON-SR), Protobuf, JSON (schemaless), or Bytes format to a Datadog endpoint.
Note
This Quick Start is for the fully-managed Confluent Cloud connector. If you are installing the connector locally for Confluent Platform, see Datadog Metrics Sink Connector for Confluent Platform.
If you require private networking for fully-managed connectors, make sure to set up the proper networking beforehand. For more information, see Manage Networking for Confluent Cloud Connectors.
Features
The Datadog Metrics Sink connector supports the following features:
At least once delivery: This connector guarantees that records from the Kafka topic are delivered at least once.
Automatically creates topics: The following three topics are automatically created when the connector starts:
Success topic
Error topic
The suffix for each topic name is the connector’s logical ID. In the example below, there are the three connector topics and one pre-existing Kafka topic named pageviews.
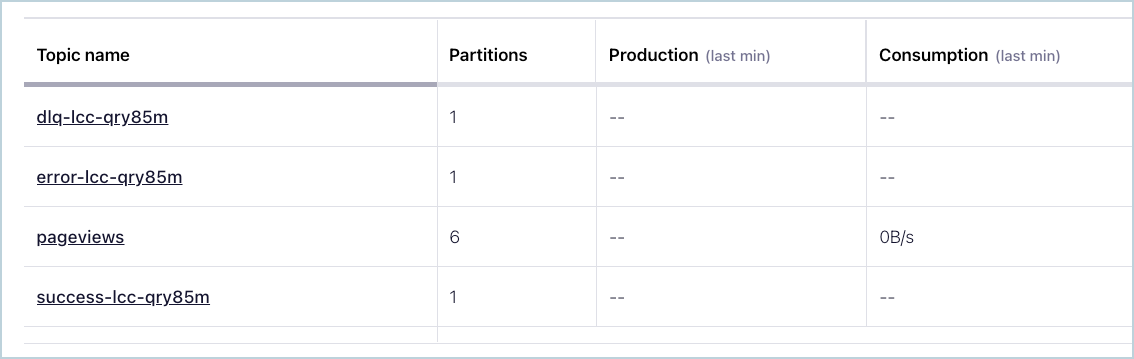
Connector Topics
If the records sent to the topic are not in the correct format, or if important fields are missing in the record, the errors are recorded in the error topic, and the connector continues to run.
Supported data formats: The connector supports Avro, JSON Schema (JSON-SR), Protobuf, JSON (schemaless), and Bytes formats. Schema Registry must be enabled to use a Schema Registry-based format (for example, Avro, JSON Schema, or Protobuf).
Supports multiple tasks: The connector supports running one or more tasks. More tasks may improve performance (that is, consumer lag is reduced with multiple tasks running).
Batches multiple Datadog metrics: The connector tries to batch metrics in a single payload for each API request (maximum payload size 3.2 MB). For more information, see the post time-series metrics API docs.
Supported metrics types: The connector supports Gauge, Rate, and Count metric types. Each metric type has a different schema. Kafka topics that contain one of these metric types must have records that adhere to the metric type schema. For additional information, see Metric types.
For more information and examples to use with the Confluent Cloud API for Connect, see the Confluent Cloud API for Connect Usage Examples section.
Limitations
Be sure to review the following information.
For connector limitations, see Datadog Metrics Sink Connector limitations.
If you plan to use one or more Single Message Transformations (SMTs), see SMT Limitations.
Kafka record mapping
The connector accepts a struct type as the Kafka record. Additionally, the Kafka topic requires certain fields. There must be a name field, a timestamp field, and a values field. The values field entry refers to the metrics value. The timestamp value must be in UNIX epoch format.
An optional dimensions entry provides support for metrics filtering. The metrics can be filtered using hosts (hostname), interval values, and tag key values. The connector accepts metrics defined by the Datadog custom metrics properties.
The following shows a Kafka record sample with optional fields noted:
{
  "name": string,
  "type": string,              -- optional (DEFAULT = gauge)
  "timestamp": long,
  "dimensions": {              -- optional
    "host": string,            -- optional
    "interval": int,           -- optional (DEFAULT = 0)
    <tag1-key>: <tag1-value>,  -- optional
    <tag2-key>: <tag2-value>,
    ....
  },
  "values": {
    "doubleValue": double
  }
}
The connector maps the submitted Kafka record to the metrics payload that is accepted by the Datadog post time-series metrics API. The Datadog Metrics Sink connector maps a Kafka record in this format:
{
  "name": "test.metric",
  "type": "gauge",
  "timestamp": 1615466162,
  "dimensions": {
    "host": "metric.host",
    "interval": 1,
    "tag1": "postman",
    "tag2": "linux"
  },
  "values": {
    "doubleValue": 0.966121580485208
  }
}
to this acceptable Datadog post time-series metrics API format:
{
  "series": [
    {
      "host": "metric.host",
      "metric": "test.metric",
      "points": [
        [
          "1615466162",
          "0.966121580485208"
        ]
      ],
      "tags": [
        "host:metric.host",
        "interval:1",
        "tag1:postman",
        "tag2:linux"
      ],
      "type": "gauge",
      "interval": 1
    }
  ]
}
Quick Start
Use this quick start to get up and running with the Confluent Cloud Datadog Metrics Sink connector. The quick start provides the basics of selecting the connector and configuring it to stream events to a Datadog project.
- Prerequisites
Authorized access to a Confluent Cloud cluster on Amazon Web Services (AWS), Microsoft Azure (Azure), or Google Cloud.
The Confluent CLI installed and configured for the cluster. See Install the Confluent CLI.
Schema Registry must be enabled to use a Schema Registry-based format (for example, Avro, JSON_SR (JSON Schema), or Protobuf).
At least one source Kafka topic must exist in your Confluent Cloud cluster before creating the sink connector.
For networking considerations, see Networking and DNS. To use a set of public egress IP addresses, see Public Egress IP Addresses for Confluent Cloud Connectors.
You must have an active Datadog account and API key. To create an API key for your Datadog project, see Add an API key or client token.
Tip
You can register for a Datadog account here. A running agent is not required You can skip the agent setup when setting up your account.
Kafka cluster credentials. The following lists the different ways you can provide credentials.
Enter an existing service account resource ID.
Create a Confluent Cloud service account for the connector. Make sure to review the ACL entries required in the service account documentation. Some connectors have specific ACL requirements.
Create a Confluent Cloud API key and secret. To create a key and secret, you can use confluent api-key create or you can autogenerate the API key and secret directly in the Cloud Console when setting up the connector.
Using the Confluent Cloud Console
Step 1: Launch your Confluent Cloud cluster
To create and launch a Kafka cluster in Confluent Cloud, see Create a kafka cluster in Confluent Cloud.
Step 2: Add a connector
In the left navigation menu, click Connectors. If you already have connectors in your cluster, click + Add connector.
Step 3: Select your connector
Click the Datadog Metrics Sink connector card.
Step 4: Enter the connector details
Note
Ensure you have all your prerequisites completed.
An asterisk ( * ) designates a required entry.
At the Add Datadog Metrics Sink Connector screen, complete the following:
If you’ve already populated your Kafka topics, select the topics you want to connect from the Topics list.
To create a new topic, click +Add new topic.
Select the way you want to provide Kafka Cluster credentials. You can choose one of the following options:
My account: This setting allows your connector to globally access everything that you have access to. With a user account, the connector uses an API key and secret to access the Kafka cluster. This option is not recommended for production.
Service account: This setting limits the access for your connector by using a service account. This option is recommended for production.
Use an existing API key: This setting allows you to specify an API key and a secret pair. You can use an existing pair or create a new one. This method is not recommended for production environments.
Note
Freight clusters support only service accounts for Kafka authentication.
Click Continue.
Configure the authentication properties:
Datadog API key: In the Datadog API key field, enter the API key for your Datadog project which is required by the Datadog agent to submit metrics and events to Datadog. To create an API key, see Add an API key or client token.
Datadog Site: Datadog site to which the datadog account belongs to. There are five possible values:
US1,US3,US5,EU1orUS1-FED. This setting is used to determine the Datadog API, connector will use to post metrics to. In case this configuration is not set, Datadog API is determined bydatadog.domainconfiguration value.Datadog domain name: Select the Datadog domain name. Choose either COM or EU, depending on the domain where your Datadog project is located.
Click Continue.
Note
Configuration properties that are not shown in the Cloud Console use the default values. See Configuration Properties for all property values and definitions.
Input Kafka record value format: Select the input Kafka record value format (data coming from the Kafka topic). Valid entires are AVRO, JSON_SR, PROTOBUF, JSON, or BYTES. A valid schema must be available in Schema Registry to use a schema-based message format (for example, Avro, JSON Schema, or Protobuf).
Show advanced configurations
Schema context: Select a schema context to use for this connector, if using a schema-based data format. This property defaults to the Default context, which configures the connector to use the default schema set up for Schema Registry in your Confluent Cloud environment. A schema context allows you to use separate schemas (like schema sub-registries) tied to topics in different Kafka clusters that share the same Schema Registry environment. For example, if you select a non-default context, a Source connector uses only that schema context to register a schema and a Sink connector uses only that schema context to read from. For more information about setting up a schema context, see What are schema contexts and when should you use them?.
Max Retry Time in Milliseconds: In case of error, while executing a post request, the connector retries until this time (in ms) elapses. You should set this value to be at least
1000milliseconds (ms). The default retry time is5000ms (5 seconds).Behavior on Error: Error handling behavior setting when an error occurs while extracting metrics from a Kafka record value. Valid options are
logandfail.loglogs the error message in theerror-<connector-id>topic and continues processing, andfailstops the connector in case of an error.
Additional Configs
Value Converter Decimal Format: Specifies the
JSONorJSON_SRserialization format for ConnectDECIMALlogical type values with two allowed literals:BASE64to serializeDECIMALlogical types as base64 encoded binary data, andNUMERICto serializeDECIMALlogical type values inJSONorJSON_SRas a number representing the decimal value.Value Converter Replace Null With Default: Specifies whether to replace fields that have a default value and that are null to the default value. When set to
true, the connector uses the default value; otherwise, it usesnull. Applies to theJSONconverter.Schema GUID For Key Converter: Sets the schema GUID to use for deserialization when using
ConfigSchemaIdDeserializer. This lets you specify a fixed schema GUID for deserializing message keys. This property is applicable only whenkey.converter.key.schema.id.deserializeris set toConfigSchemaIdDeserializer.Value Converter Schema ID Deserializer: Sets the class name of the schema ID deserializer for values. The deserializer reads schema IDs from message headers.
Schema GUID For Value Converter: Sets the schema GUID to use for deserialization when using
ConfigSchemaIdDeserializer. This lets you specify a fixed schema GUID for deserializing message values. This property is applicable only whenvalue.converter.value.schema.id.deserializeris set toConfigSchemaIdDeserializer.Value Converter Reference Subject Name Strategy: Sets the subject reference name strategy for values. Valid entries are
DefaultReferenceSubjectNameStrategyorQualifiedReferenceSubjectNameStrategy. You can use this strategy only withPROTOBUFformat; the default strategy isDefaultReferenceSubjectNameStrategy.Schema ID For Value Converter: Sets the schema ID to use for deserialization when using
ConfigSchemaIdDeserializer. This lets you specify a fixed schema ID for deserializing message values. This property is applicable only whenvalue.converter.value.schema.id.deserializeris set toConfigSchemaIdDeserializer.Value Converter Schemas Enable: Includes schema within each of the serialized values. Input messages must contain
schemaandpayloadfields and must not contain additional fields. For plainJSONdata, set this tofalse. Applies to theJSONconverter.Errors Tolerance: Use this property to configure the connector’s error handling behavior.
Warning
Use this property with caution for sink connectors, as it can lead to data loss. If you set this property to
all, the connector does not fail on errant records, but logs them (and sends to DLQ for sink connectors) and continues processing. If you set this property tonone, the connector task fails on errant records.Value Converter Connect Meta Data: Enables the Connect converter to add its metadata to the output schema. Applies to Avro converters.
Value Converter Value Subject Name Strategy: Determines how to construct the subject name under which the value schema is registered with Schema Registry.
Key Converter Key Subject Name Strategy: Determines how to construct the subject name for key schema registration.
Value Converter Ignore Default For Nullables: When set to
true, this property ensures that the corresponding record in Kafka isnull, instead of showing the default column value. Applies to theAVRO,PROTOBUF, andJSON_SRconverters.Key Converter Schema ID Deserializer: Sets the class name of the schema ID deserializer for keys. The deserializer reads schema IDs from message headers.
Schema ID For Key Converter: Sets the schema ID to use for deserialization when using
ConfigSchemaIdDeserializer. This lets you specify a fixed schema ID for deserializing message keys. This property is applicable only whenkey.converter.key.schema.id.deserializeris set toConfigSchemaIdDeserializer.
Auto-restart policy
Enable Connector Auto-restart: Enables the auto-restart behavior of the connector and its task in the event of user-actionable errors. Defaults to
true, enabling the connector to automatically restart in case of user-actionable errors. Set this property tofalseto disable auto-restart for failed connectors. If disabled, you must manually restart the connector.
Consumer configuration
Max poll interval(ms): Sets the maximum delay between subsequent consume requests to Kafka. Use this property to improve connector performance in cases when the connector cannot send records to the sink system. The default is 300,000 milliseconds (5 minutes).
Max poll records: Sets the maximum number of records to consume from Kafka in a single request. Use this property to improve connector performance in cases when the connector cannot send records to the sink system. The default is 500 records.
Transforms
Single Message Transformations: To add a new SMT, see Add transforms. For more information about unsupported SMTs, see Unsupported transformations.
Processing position
Set offsets: Click Set offsets to define a specific offset for this connector to begin procession data from. For more information on managing offsets, see Manage offsets.
See Configuration Properties for all property values and definitions.
Click Continue.
Based on the number of topic partitions you select, you will be provided with a recommended number of tasks.
To change the number of recommended tasks, enter the number of tasks for the connector to use in the Tasks field.
Click Continue.
Verify the connection details.
Click Launch.
The status for the connector should go from Provisioning to Running.
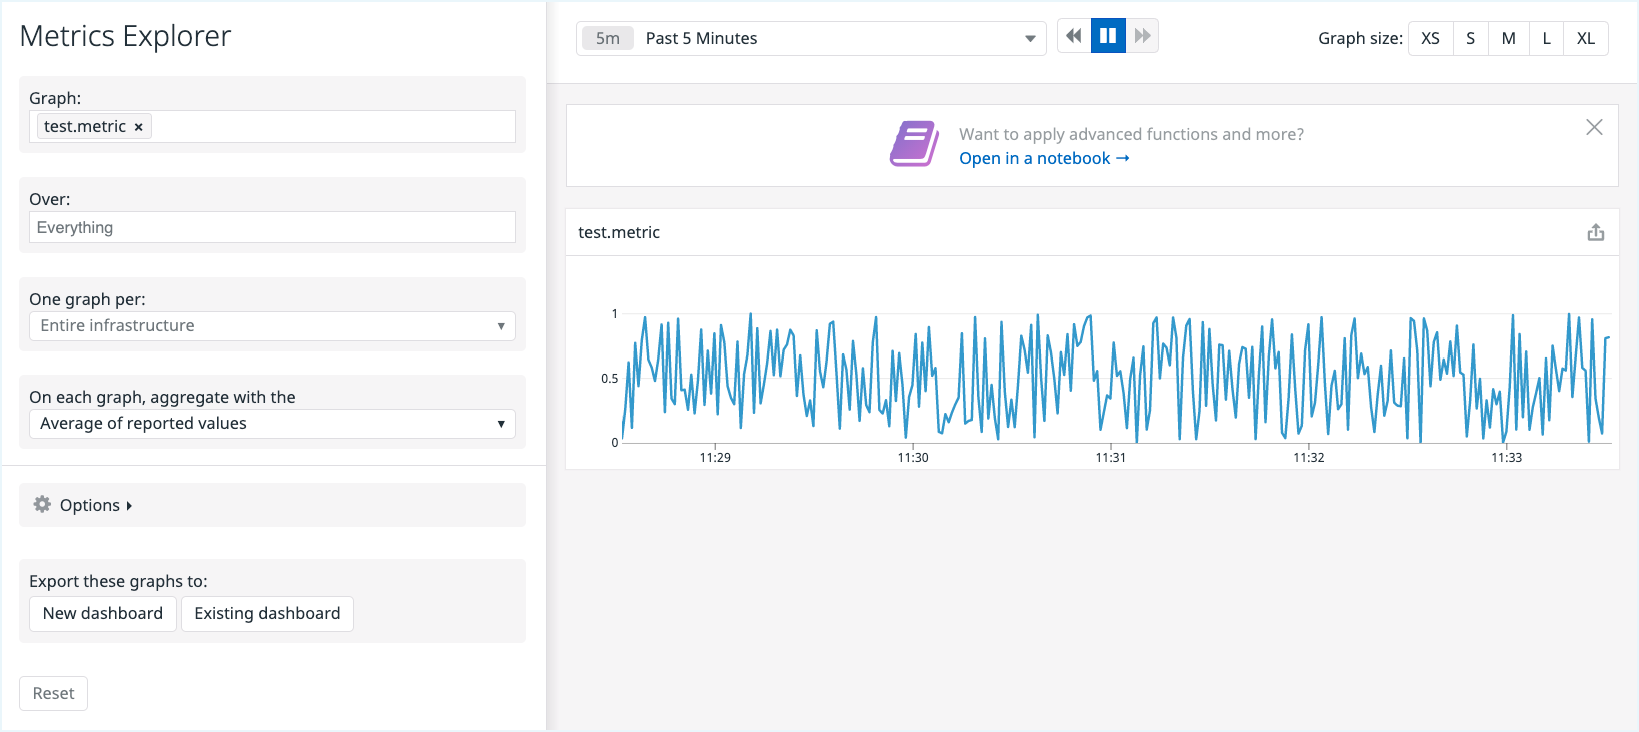
Step 5: Check for records
Verify that metrics are being produced. Go to the Metrics Explorer in your Datadog project and search for the graph with the name you used for the Kafka topic metric property (for example, "metric": "test.metric").
For more information and examples to use with the Confluent Cloud API for Connect, see the Confluent Cloud API for Connect Usage Examples section.
Tip
When you launch a connector, a Dead Letter Queue topic is automatically created. See View Connector Dead Letter Queue Errors in Confluent Cloud for details.
Using the Confluent CLI
Complete the following steps to set up and run the connector using the Confluent CLI.
Note
Make sure you have all your prerequisites completed.
Step 1: List the available connectors
Enter the following command to list available connectors:
confluent connect plugin list
Step 2: List the connector configuration properties
Enter the following command to show the connector configuration properties:
confluent connect plugin describe <connector-plugin-name>
The command output shows the required and optional configuration properties.
Step 3: Create the connector configuration file
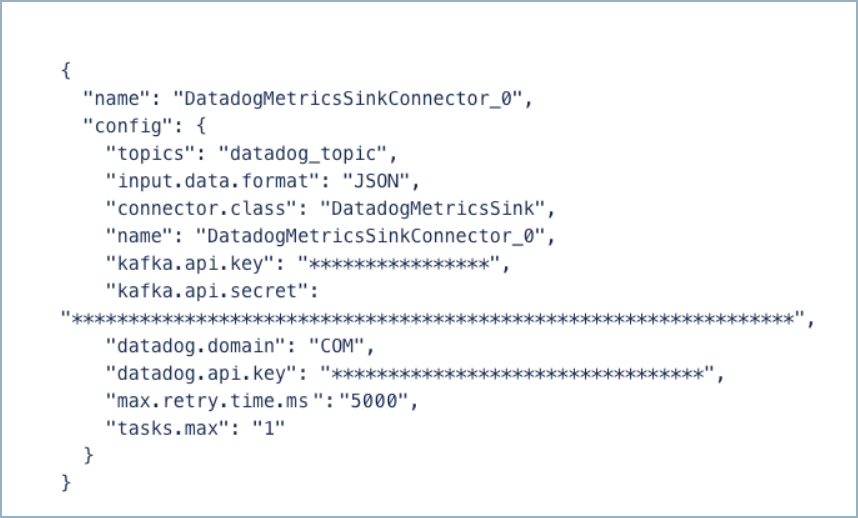
Create a JSON file that contains the connector configuration properties. The following example shows the required connector properties.
{
  "connector.class": "DatadogMetricsSink",
  "input.data.format": "JSON",
  "name": "DatadogMetricsSinkConnector_0",
  "kafka.auth.mode": "KAFKA_API_KEY",
  "kafka.api.key": "****************",
  "kafka.api.secret": "****************************************************************",
  "datadog.domain": "COM",
  "datadog.api.key": "**************************************************",
  "tasks.max": "1",
  "topics": "<topic-1>, <topic-2>",
  "max.retry.time.ms": "5000"
}
Note the following property definitions:
"connector.class": Identifies the connector plugin name."input.data.format": Sets the input Kafka record value format (data coming from the Kafka topic). Valid entries are AVRO, JSON_SR, PROTOBUF, JSON, or BYTES. You must have Confluent Cloud Schema Registry configured if using a schema-based message format (for example, Avro, JSON_SR (JSON Schema), or Protobuf)."name": Sets a name for your new connector.
"kafka.auth.mode": Identifies the connector authentication mode you want to use. There are two options:SERVICE_ACCOUNTorKAFKA_API_KEY(the default). To use an API key and secret, specify the configuration propertieskafka.api.keyandkafka.api.secret, as shown in the example configuration (above). To use a service account, specify the Resource ID in the propertykafka.service.account.id=<service-account-resource-ID>. To list the available service account resource IDs, use the following command:confluent iam service-account list
For example:
confluent iam service-account list

   Id     | Resource ID |       Name        |    Description
+---------+-------------+-------------------+-------------------
   123456 | sa-l1r23m   | sa-1              | Service account 1
   789101 | sa-l4d56p   | sa-2              | Service account 2
"datadog.domain": Use either COM or EU, depending on the domain where your Datadog project is located."datadog.api.key": This is the API key for your Datadog project. To create an API key, see Add an API key or client token."tasks.max": Enter the maximum number of tasks for the connector to use. More tasks may improve performance (that is, consumer lag is reduced with multiple tasks running)."topics": Enter the topic name or a comma-separated list of topic names."max.retry.time.ms": When a post request error occurs, the connector will retry until the amount of time entered elapses. You should set this value to be at least1000milliseconds (ms). The default retry time is5000ms (5 seconds).
SMTs: For details about adding SMTs using the Confluent CLI, see the Single Message Transformations documentation. For a list of SMTs that are not supported with this connector, see Unsupported transformations.
See Configuration Properties for all property values and definitions.
Step 4: Load the properties file and create the connector
Enter the following command to load the configuration and start the connector:
confluent connect cluster create --config-file <file-name>.json
For example:
confluent connect cluster create --config-file datadog-metrics-sink-config.json
Example output:
Created connector DatadogMetricsSinkConnector_0 lcc-do6vzd
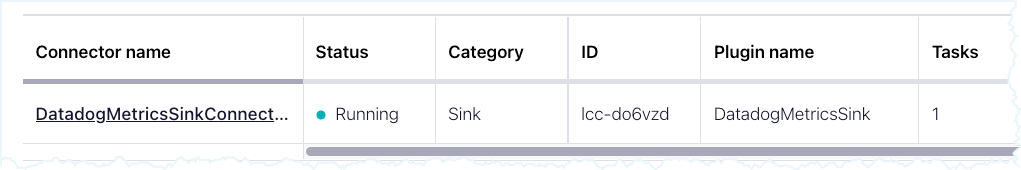
Step 5: Check the connector status
Enter the following command to check the connector status:
confluent connect cluster list
Example output:
ID           |             Name              | Status  | Type | Trace
+------------+-------------------------------+---------+------+-------+
lcc-do6vzd   | DatadogMetricsSinkConnector_0 | RUNNING | sink |
Step 6: Check for records.
Verify that metrics are being produced. Go to the Metrics Explorer in your Datadog project and search for the graph with the name you used for the Kafka topic metric property (for example, "metric": "test.metric").
For more information and examples to use with the Confluent Cloud API for Connect, see the Confluent Cloud API for Connect Usage Examples section.
Tip
When you launch a connector, a Dead Letter Queue topic is automatically created. See View Connector Dead Letter Queue Errors in Confluent Cloud for details.
Configuration Properties
Use the following configuration properties with the fully-managed connector. For self-managed connector property definitions and other details, see the connector docs in Self-managed connectors for Confluent Platform.
Which topics do you want to get data from?
topics.regexA regular expression that matches the names of the topics to consume from. This is useful when you want to consume from multiple topics that match a certain pattern without having to list them all individually.
Type: string
Importance: low
topicsIdentifies the topic name or a comma-separated list of topic names.
Type: list
Importance: high
errors.deadletterqueue.topic.nameThe name of the topic to be used as the dead letter queue (DLQ) for messages that result in an error when processed by this sink connector, or its transformations or converters. Defaults to ‘dlq-${connector}’ if not set. The DLQ topic will be created automatically if it does not exist. You can provide
${connector}in the value to use it as a placeholder for the logical cluster ID.Type: string
Default: dlq-${connector}
Importance: low
reporter.result.topic.nameThe name of the topic to produce records to after successfully processing a sink record. Defaults to ‘success-${connector}’ if not set. You can provide
${connector}in the value to use it as a placeholder for the logical cluster ID.Type: string
Default: success-${connector}
Importance: low
reporter.error.topic.nameThe name of the topic to produce records to after each unsuccessful record sink attempt. Defaults to ‘error-${connector}’ if not set. You can provide
${connector}in the value to use it as a placeholder for the logical cluster ID.Type: string
Default: error-${connector}
Importance: low
Schema Config
schema.context.nameAdd a schema context name. A schema context represents an independent scope in Schema Registry. It is a separate sub-schema tied to topics in different Kafka clusters that share the same Schema Registry instance. If not used, the connector uses the default schema configured for Schema Registry in your Confluent Cloud environment.
Type: string
Default: default
Importance: medium
Input messages
input.data.formatSets the input Kafka record value format. Valid entries are AVRO, JSON_SR, PROTOBUF, JSON or BYTES. Note that you need to have Confluent Cloud Schema Registry configured if using a schema-based message format like AVRO, JSON_SR, and PROTOBUF.
Type: string
Default: JSON
Importance: high
How should we connect to your data?
nameSets a name for your connector.
Type: string
Valid Values: A string at most 64 characters long
Importance: high
Kafka Cluster credentials
kafka.auth.modeKafka Authentication mode. It can be one of KAFKA_API_KEY or SERVICE_ACCOUNT. It defaults to KAFKA_API_KEY mode, whenever possible.
Type: string
Valid Values: SERVICE_ACCOUNT, KAFKA_API_KEY
Importance: high
kafka.api.keyKafka API Key. Required when kafka.auth.mode==KAFKA_API_KEY.
Type: password
Importance: high
kafka.service.account.idThe Service Account that will be used to generate the API keys to communicate with Kafka Cluster.
Type: string
Importance: high
kafka.api.secretSecret associated with Kafka API key. Required when kafka.auth.mode==KAFKA_API_KEY.
Type: password
Importance: high
How should we connect to Datadog?
datadog.api.keyDatadog API key is required by the Datadog agent to submit metrics and events to datadog
Type: password
Importance: high
datadog.siteDatadog site to which the datadog account belongs to. There are five possible values:
US1,US3,US5,EU1orUS1-FED. This setting is used to determine the Datadog API, connector will use to post metrics to. In case this config is not configured, Datadog API is determined bydatadog.domainconfig value.Type: string
Default: “”
Importance: high
datadog.domainDatadog domain to which the datadog account belongs to. The two possible values are
EUorCOM. Ifdatadog.siteis not configured, then this setting will determine the Datadog API which connector will use to post metrics to. The value EU will map to https://api.datadoghq.eu and COM will map to https://api.datadoghq.com.Type: string
Default: COM
Importance: low
Datadog Details
max.retry.time.msIn case of error, while executing a post request, the connector will retry until this time (in ms) elapses. The default value is 5000 (5 seconds). It’s recommended to set this value to be at least 1 second.
Type: int
Default: 5000 (5 seconds)
Valid Values: [1000,…]
Importance: low
How should we handle errors?
behavior.on.errorError handling behavior setting when an error occurs while extracting metric from Kafka record value. Valid options are ‘log’ and ‘fail’. ‘log’ logs the error message in error-<connector-id> topic and continues processing, ‘fail’ stops the connector in case of an error.
Type: string
Default: log
Importance: low
Consumer configuration
max.poll.interval.msThe maximum delay between subsequent consume requests to Kafka. This configuration property may be used to improve the performance of the connector, if the connector cannot send records to the sink system. Defaults to 300000 milliseconds (5 minutes).
Type: long
Default: 300000 (5 minutes)
Valid Values: [60000,…,1800000] for non-dedicated clusters and [60000,…] for dedicated clusters
Importance: low
max.poll.recordsThe maximum number of records to consume from Kafka in a single request. This configuration property may be used to improve the performance of the connector, if the connector cannot send records to the sink system. Defaults to 500 records.
Type: long
Default: 500
Valid Values: [1,…,500] for non-dedicated clusters and [1,…] for dedicated clusters
Importance: low
Number of tasks for this connector
tasks.maxMaximum number of tasks for the connector.
Type: int
Valid Values: [1,…]
Importance: high
Additional Configs
consumer.override.auto.offset.resetDefines the behavior of the consumer when there is no committed position (which occurs when the group is first initialized) or when an offset is out of range. You can choose either to reset the position to the “earliest” offset (the default) or the “latest” offset. You can also select “none” if you would rather set the initial offset yourself and you are willing to handle out of range errors manually. More details: https://docs.confluent.io/platform/current/installation/configuration/consumer-configs.html#auto-offset-reset
Type: string
Importance: low
consumer.override.isolation.levelControls how to read messages written transactionally. If set to read_committed, consumer.poll() will only return transactional messages which have been committed. If set to read_uncommitted (the default), consumer.poll() will return all messages, even transactional messages which have been aborted. Non-transactional messages will be returned unconditionally in either mode. More details: https://docs.confluent.io/platform/current/installation/configuration/consumer-configs.html#isolation-level
Type: string
Importance: low
header.converterThe converter class for the headers. This is used to serialize and deserialize the headers of the messages.
Type: string
Importance: low
key.converter.use.schema.guidThe schema GUID to use for deserialization when using ConfigSchemaIdDeserializer. This allows you to specify a fixed schema GUID to be used for deserializing message keys. Only applicable when key.converter.key.schema.id.deserializer is set to ConfigSchemaIdDeserializer.
Type: string
Importance: low
key.converter.use.schema.idThe schema ID to use for deserialization when using ConfigSchemaIdDeserializer. This allows you to specify a fixed schema ID to be used for deserializing message keys. Only applicable when key.converter.key.schema.id.deserializer is set to ConfigSchemaIdDeserializer.
Type: int
Importance: low
value.converter.allow.optional.map.keysAllow optional string map key when converting from Connect Schema to Avro Schema. Applicable for Avro Converters.
Type: boolean
Importance: low
value.converter.auto.register.schemasSpecify if the Serializer should attempt to register the Schema.
Type: boolean
Importance: low
value.converter.connect.meta.dataAllow the Connect converter to add its metadata to the output schema. Applicable for Avro Converters.
Type: boolean
Importance: low
value.converter.enhanced.avro.schema.supportEnable enhanced schema support to preserve package information and Enums. Applicable for Avro Converters.
Type: boolean
Importance: low
value.converter.enhanced.protobuf.schema.supportEnable enhanced schema support to preserve package information. Applicable for Protobuf Converters.
Type: boolean
Importance: low
value.converter.flatten.unionsWhether to flatten unions (oneofs). Applicable for Protobuf Converters.
Type: boolean
Importance: low
value.converter.generate.index.for.unionsWhether to generate an index suffix for unions. Applicable for Protobuf Converters.
Type: boolean
Importance: low
value.converter.generate.struct.for.nullsWhether to generate a struct variable for null values. Applicable for Protobuf Converters.
Type: boolean
Importance: low
value.converter.int.for.enumsWhether to represent enums as integers. Applicable for Protobuf Converters.
Type: boolean
Importance: low
value.converter.latest.compatibility.strictVerify latest subject version is backward compatible when use.latest.version is true.
Type: boolean
Importance: low
value.converter.object.additional.propertiesWhether to allow additional properties for object schemas. Applicable for JSON_SR Converters.
Type: boolean
Importance: low
value.converter.optional.for.nullablesWhether nullable fields should be specified with an optional label. Applicable for Protobuf Converters.
Type: boolean
Importance: low
value.converter.optional.for.proto2Whether proto2 optionals are supported. Applicable for Protobuf Converters.
Type: boolean
Importance: low
value.converter.scrub.invalid.namesWhether to scrub invalid names by replacing invalid characters with valid characters. Applicable for Avro and Protobuf Converters.
Type: boolean
Importance: low
value.converter.use.latest.versionUse latest version of schema in subject for serialization when auto.register.schemas is false.
Type: boolean
Importance: low
value.converter.use.optional.for.nonrequiredWhether to set non-required properties to be optional. Applicable for JSON_SR Converters.
Type: boolean
Importance: low
value.converter.use.schema.guidThe schema GUID to use for deserialization when using ConfigSchemaIdDeserializer. This allows you to specify a fixed schema GUID to be used for deserializing message values. Only applicable when value.converter.value.schema.id.deserializer is set to ConfigSchemaIdDeserializer.
Type: string
Importance: low
value.converter.use.schema.idThe schema ID to use for deserialization when using ConfigSchemaIdDeserializer. This allows you to specify a fixed schema ID to be used for deserializing message values. Only applicable when value.converter.value.schema.id.deserializer is set to ConfigSchemaIdDeserializer.
Type: int
Importance: low
value.converter.wrapper.for.nullablesWhether nullable fields should use primitive wrapper messages. Applicable for Protobuf Converters.
Type: boolean
Importance: low
value.converter.wrapper.for.raw.primitivesWhether a wrapper message should be interpreted as a raw primitive at root level. Applicable for Protobuf Converters.
Type: boolean
Importance: low
errors.toleranceUse this property if you would like to configure the connector’s error handling behavior. WARNING: This property should be used with CAUTION for SOURCE CONNECTORS as it may lead to dataloss. If you set this property to ‘all’, the connector will not fail on errant records, but will instead log them (and send to DLQ for Sink Connectors) and continue processing. If you set this property to ‘none’, the connector task will fail on errant records.
Type: string
Default: all
Importance: low
key.converter.key.schema.id.deserializerThe class name of the schema ID deserializer for keys. This is used to deserialize schema IDs from the message headers.
Type: string
Default: io.confluent.kafka.serializers.schema.id.DualSchemaIdDeserializer
Importance: low
key.converter.key.subject.name.strategyHow to construct the subject name for key schema registration.
Type: string
Default: TopicNameStrategy
Importance: low
value.converter.decimal.formatSpecify the JSON/JSON_SR serialization format for Connect DECIMAL logical type values with two allowed literals:
BASE64 to serialize DECIMAL logical types as base64 encoded binary data and
NUMERIC to serialize Connect DECIMAL logical type values in JSON/JSON_SR as a number representing the decimal value.
Type: string
Default: BASE64
Importance: low
value.converter.flatten.singleton.unionsWhether to flatten singleton unions. Applicable for Avro and JSON_SR Converters.
Type: boolean
Default: false
Importance: low
value.converter.ignore.default.for.nullablesWhen set to true, this property ensures that the corresponding record in Kafka is NULL, instead of showing the default column value. Applicable for AVRO,PROTOBUF and JSON_SR Converters.
Type: boolean
Default: false
Importance: low
value.converter.reference.subject.name.strategySet the subject reference name strategy for value. Valid entries are DefaultReferenceSubjectNameStrategy or QualifiedReferenceSubjectNameStrategy. Note that the subject reference name strategy can be selected only for PROTOBUF format with the default strategy being DefaultReferenceSubjectNameStrategy.
Type: string
Default: DefaultReferenceSubjectNameStrategy
Importance: low
value.converter.replace.null.with.defaultWhether to replace fields that have a default value and that are null to the default value. When set to true, the default value is used, otherwise null is used. Applicable for JSON Converter.
Type: boolean
Default: true
Importance: low
value.converter.schemas.enableInclude schemas within each of the serialized values. Input messages must contain schema and payload fields and may not contain additional fields. For plain JSON data, set this to false. Applicable for JSON Converter.
Type: boolean
Default: false
Importance: low
value.converter.value.schema.id.deserializerThe class name of the schema ID deserializer for values. This is used to deserialize schema IDs from the message headers.
Type: string
Default: io.confluent.kafka.serializers.schema.id.DualSchemaIdDeserializer
Importance: low
value.converter.value.subject.name.strategyDetermines how to construct the subject name under which the value schema is registered with Schema Registry.
Type: string
Default: TopicNameStrategy
Importance: low
Auto-restart policy
auto.restart.on.user.errorEnable connector to automatically restart on user-actionable errors.
Type: boolean
Default: true
Importance: medium
Frequently asked questions
The frequently asked questions (FAQs) address common questions and issues encountered while using the fully-managed Datadog Metrics Sink connector for Confluent Cloud.
Connectivity and authentication
How do I troubleshoot the error “Datadog failed to respond on a put request. The connector will retry sending metrics again.”?
This error indicates that the connector’s HTTP client did not receive a response from the Datadog API endpoint. It is typically caused by network-level interruptions, Datadog-side issues, or configuration errors. To troubleshoot:
Verify the Datadog endpoint is reachable. Use connectivity test tools such as
telnetornetcatto confirm the endpoint host and port are accessible.Validate your API key. Use the Datadog Validate Key API to confirm your key is valid. For example:
curl -X GET "https://api.datadoghq.com/api/v1/validate" \
  -H "Accept: application/json" \
  -H "DD-API-KEY: <YOUR_API_KEY>" \
  -v
Verify the
datadog.domainsetting. The connector only supportsCOMandEU. The valueCOMmaps tohttps://api.datadoghq.comandEUmaps tohttps://api.datadoghq.eu. Using an incorrect domain causes connectivity failures.Check for Datadog outages. Review the Datadog Status Page for any ongoing incidents in your region.
Adjust the retry time. Increase the
max.retry.time.msconfiguration property (default:5000ms) to allow more time for transient network issues to resolve before the connector reports an error.
What values are supported for the datadog.domain configuration?
Only COM and EU are supported. Use COM if your Datadog project is on datadoghq.com and EU if it is on datadoghq.eu. These values determine which Datadog API endpoint the connector uses to submit metrics.
Data format and schema
What record format does the Datadog Metrics Sink connector expect?
The connector expects a struct-type Kafka record with the following required fields:
name(string): The metric name.timestamp(long): The metric timestamp in UNIX epoch format.values(struct): Contains adoubleValue(double) field for the metric value.
Optional fields include:
type(string): The metric type (gauge,rate, orcount). Defaults togaugeif not specified.dimensions(struct): Supportshost(string),interval(int), and custom tag key-value pairs for metrics filtering.
Records that are missing the required fields or use an incorrect format are recorded in the error topic, and the connector continues to run.
What metric types are supported?
The connector supports Gauge, Rate, and Count metric types. Each Kafka topic that contains a specific metric type must have records that adhere to the corresponding schema. For details on each type, see Datadog Metric Types.
Consumer lag and dead letter queue (DLQ)
Why does consumer lag remain high even though records are being routed to the dead letter queue?
The Datadog Metrics Sink connector does not commit the offset of messages routed to the DLQ until a subsequent valid message is successfully processed and sent to Datadog. This means:
If all remaining messages in a partition are invalid and routed to the DLQ, consumer lag does not decrease until a valid message is produced to the topic.
This is expected behavior for sink connectors that use
preCommitfor offset management, which includes the Datadog Metrics Sink connector.
To investigate:
Check the DLQ topic (
dlq-<connector-ID>) for records and inspect the DLQ message headers to understand why records are failing.Ensure that the records in your source topic match the expected schema for the configured metric type.
How do I view and process records in the dead letter queue?
Navigate to the DLQ topic (dlq-<connector-ID>) in the Cloud Console and inspect the message headers for error details. The headers contain the exception class, message, and stack trace that caused the record to fail. For more details, see Dead Letter Queue.
Monitoring
How do I monitor the Datadog Metrics Sink connector itself using Datadog?
You can use the Datadog Confluent Cloud integration to scrape connector metrics directly into Datadog. To set this up:
Install the Confluent Cloud integration tile in your Datadog account.
Add your Confluent Cloud Cloud API key.
Add your Confluent Cloud cluster ID (
lkc-xxxxx).Add the connector ID (
lcc-xxxxx) for each connector you want to monitor.
This provides visibility into metrics such as connector record throughput and consumer lag. For details, see the Datadog integration data collected documentation and the Confluent Cloud Metrics.
Performance
How does the connector batch metrics for Datadog API requests?
The connector batches multiple metrics into a single payload for each API request, up to the Datadog maximum payload size of 3.2 MB. This batching improves throughput and reduces the number of API calls. To further improve performance, increase the number of tasks using the tasks.max configuration property to reduce consumer lag.
Next Steps
For an example that shows fully-managed Confluent Cloud connectors in action with Confluent Cloud for Apache Flink, see the Cloud ETL Demo. This example also shows how to use Confluent CLI to manage your resources in Confluent Cloud.