
Track Data with Stream Lineage on Confluent Cloud
To move forward with updates to mission-critical applications or answer questions on important subjects like data regulation and compliance, teams need an easy means of comprehending the big picture journey of data in motion.
Stream Lineage provides a graphical view of event streams and data relationships with both a bird’s eye view and drill-down magnification for answering questions like:
Where did data come from?
Where is it going?
Where, when, and how was it transformed?
Answers to questions like these allow developers to trust the data they’ve found, and gain the visibility needed to make sure their changes won’t cause any negative or unexpected downstream impact. Developers can learn and make decisions quickly with live metrics and metadata inspection embedded directly within lineage graphs.
Note
If you are working with secured data:
The following tutorial assumes that you have role-based access to the clusters and topics you need.
The tutorial assumes that you have role-based access to Stream Lineage. If you do not have this access, Stream Lineage will not show up as an option on any screen.
Developer roles do not grant access to Stream Lineage. You can give developers access to Stream Lineage by granting them additional roles with appropriate scope for need-to-know; such as Operator role at the cluster level. To learn more, see Access control (RBAC) for Stream Lineage and Role-based Access Control (RBAC) on Confluent Cloud.
First look
What Stream Lineage shows
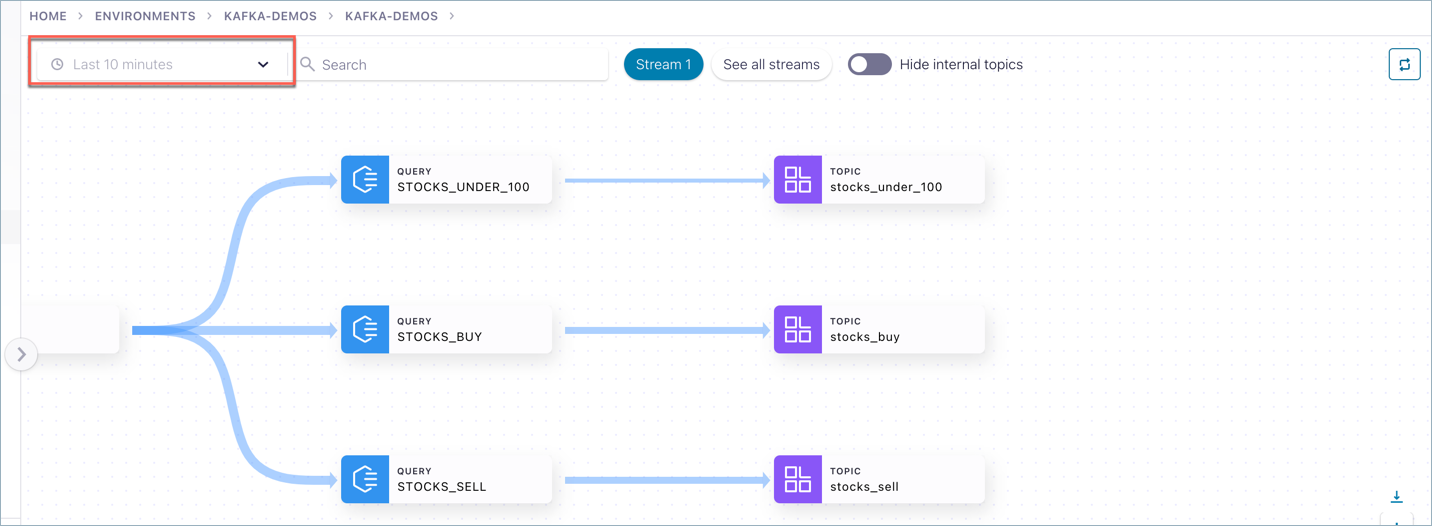
Stream Lineage in Confluent Cloud is represented visually to show the movement of data from source to destination, and how it is transformed as it moves. The lineage graph always shows the activity of producers and consumers of data for the last 10 minutes.
How to access Stream Lineage views
There are multiple ways to get into the Stream Lineage view, as described in Summary of navigation paths. This example shows one path.
To view the Stream Lineage for a topic:
Log on to the Confluent Cloud Console.
Select an environment.
Select a cluster.
Select a topic.
Click Explore Stream Lineage in the top right of the topic page.
Tip
If you do not see the option Explore Stream Lineage, then you do not have the required permissions. To learn more, see Access control (RBAC) for Stream Lineage.
The Stream Lineage for that topic is shown.
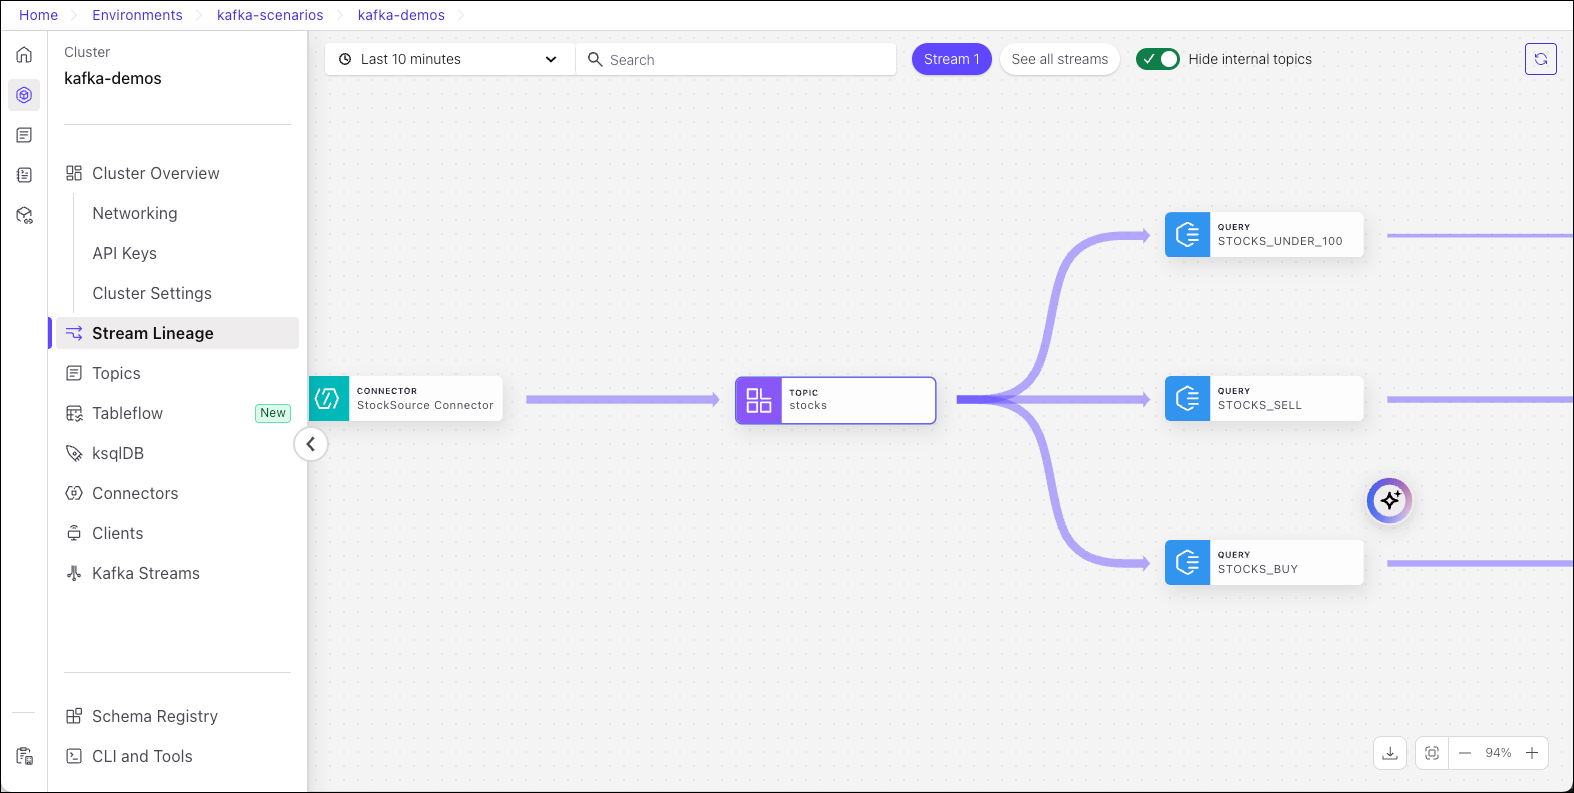
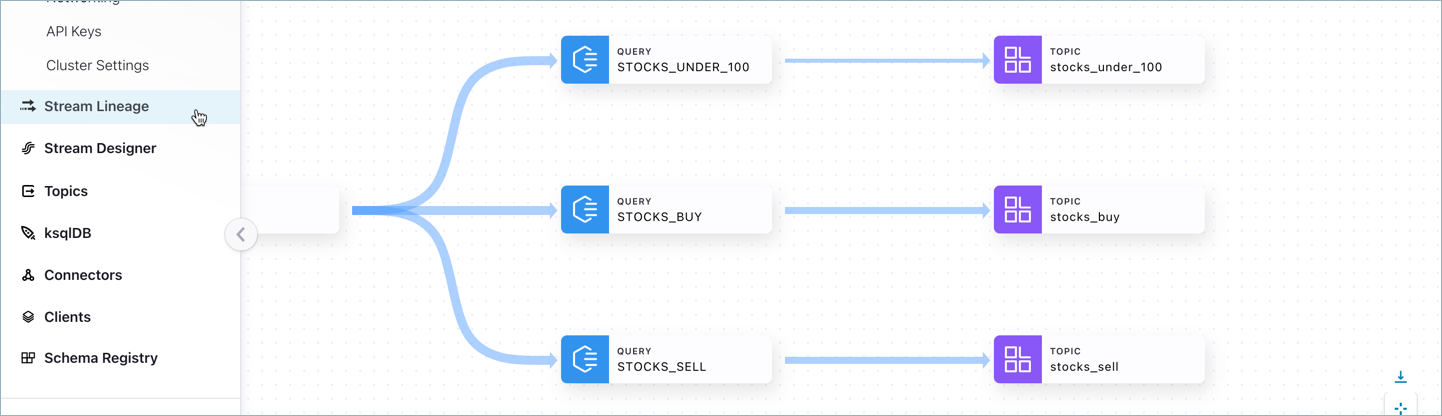
The Stream Lineage shown in this example is the result of setting up a data pipeline based on several ksqlDB query streams. If you haven’t set up a data pipeline yet, your lineage view may only show a single, lonely event node.
To get an interesting lineage like the one shown above, take a spin through the tutorial in the next section!
View Stream Lineage for Confluent Platform with USM
After you register a Confluent Platform cluster with Unified Stream Manager, you can view its topic lineage directly in the Cloud Console. Stream Lineage visually represents your data’s journey from source to destination, including any transformations. The graph shows producer and consumer activity from the last 10 minutes, offering a real-time view of your data streams.
To view the Stream Lineage for a Confluent Platform cluster with USM, follow these steps:
In the Cloud Console, select the environment that contains your Confluent Platform cluster.
From Clusters list, select your Confluent Platform cluster.
To open the lineage graph, choose one of the following options:
For an overall cluster view: Click Stream Lineage in the left menu.
For a specific topic’s view: Go to the topic’s details page and click the Explore Stream Lineage button.
This displays the complete Stream Lineage graph for your selection.
Summary of navigation paths
You can get into a Stream Lineage view from any of the following paths and resources on the Cloud Console:
Select a topic from the topic list for a cluster (Environments > <cluster> > Topics). An embedded mini-view of the stream lineage for the selected topic is shown. From here, you can click View full lineage to open the complete lineage diagram.
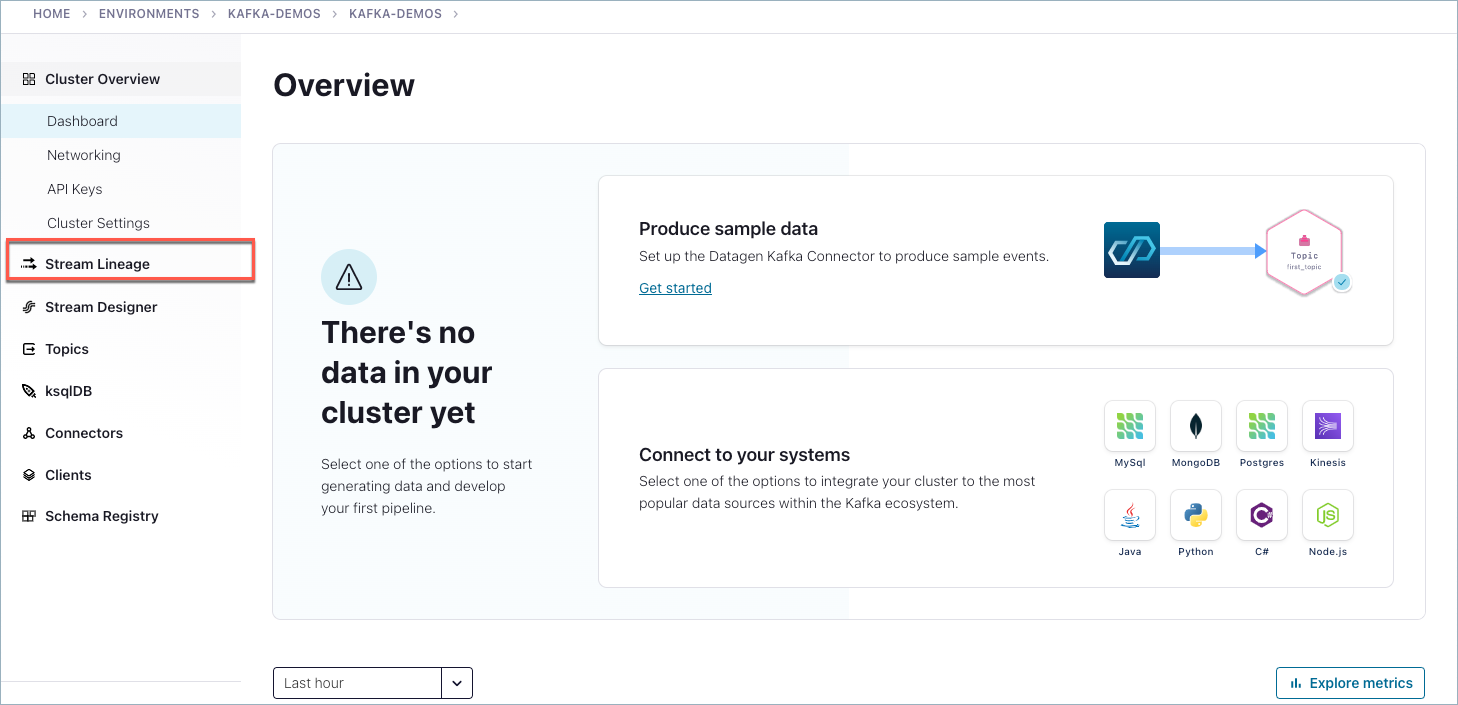
On the left menu from anywhere within a cluster on the Cloud Console, click Stream Lineage.
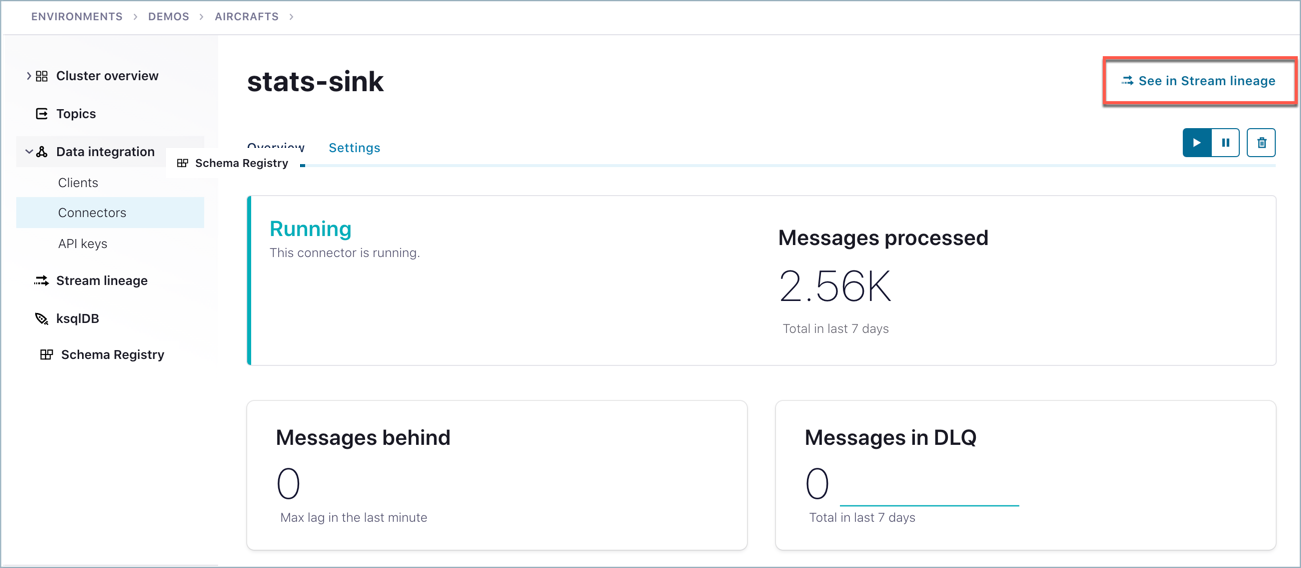
From a connector, click Explore Stream Lineage in the top right of the connector page.
Tutorial
In order to really see Stream Lineage in action, you need to configure topics, producers, and consumers to create a data pipeline. Once you have events flowing into your pipeline, you can use Stream Lineage to inspect where data is coming from, what transformations are applied to it, and where it’s going.
Select an environment, cluster, and Schema Registry
Add an environment or select an existing one.
Add a cluster or select an existing one on which to run the demo.
If you create a new cluster:
You must select a cluster type. You can choose any cluster type.
Choose a cloud provider and region.
Click Continue to review configuration and costs, usage limits, and uptime service level agreement (SLA)
Then click Launch Cluster
The Schema Registry settings and information will be available on the Schema Registry tab for the environment.
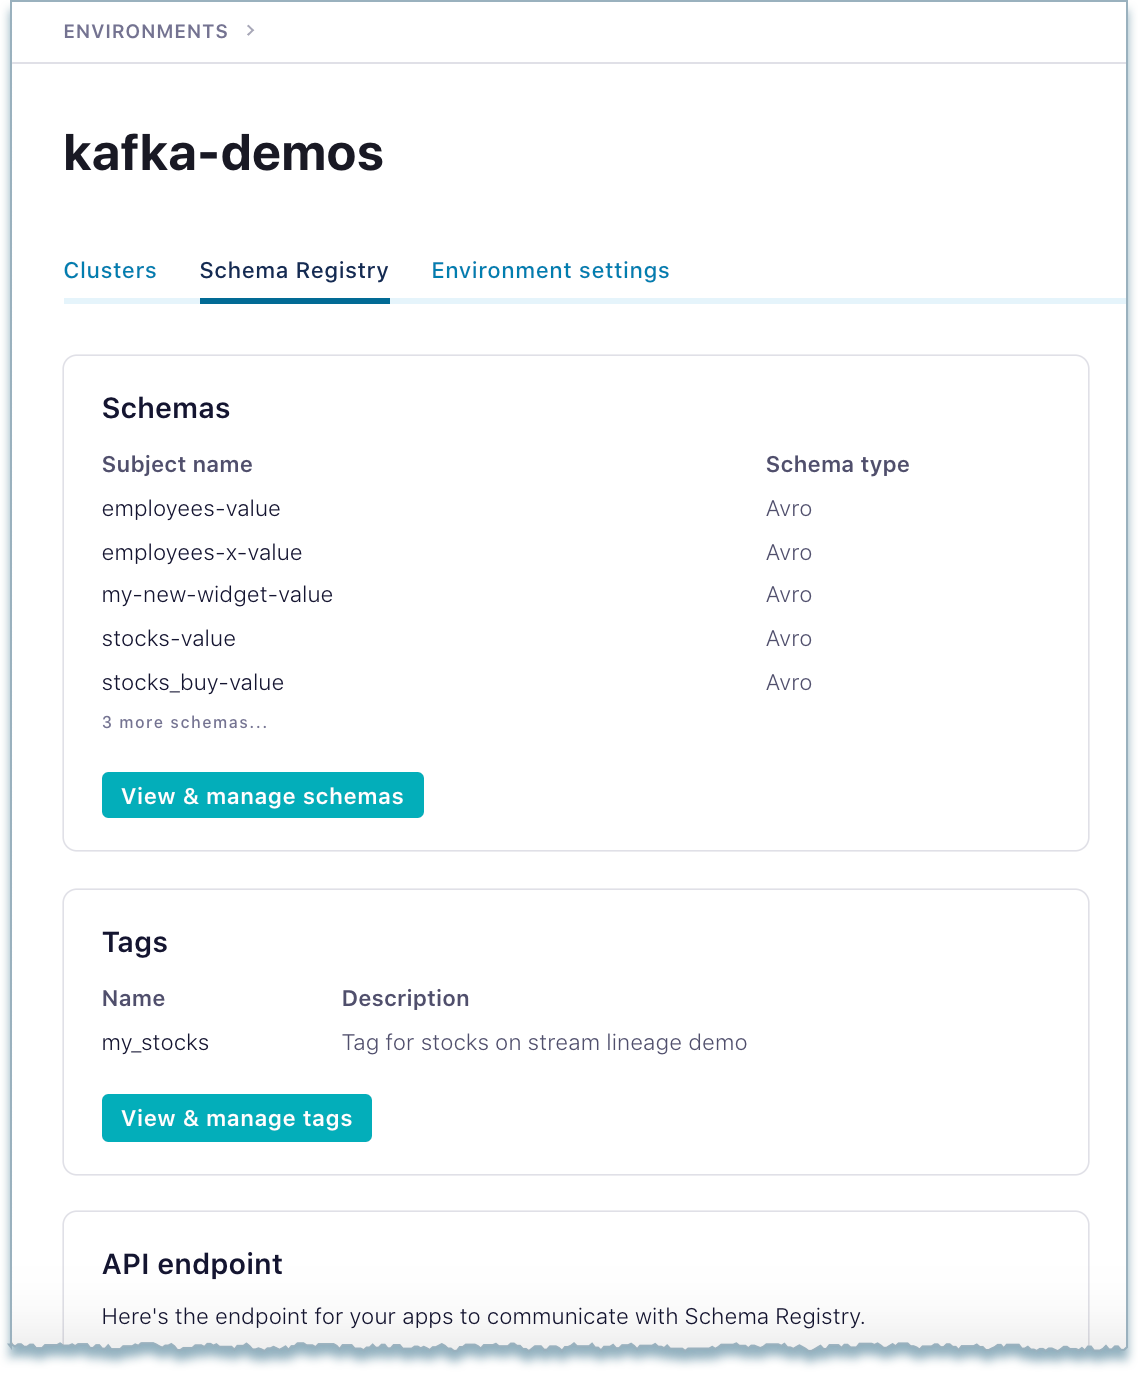
Generate and save the Schema Registry API key and secret for this Schema Registry. (Save the key to use later on step 10 of this procedure.)
If you need help with these initial steps, see Quick Start for Confluent Cloud.
Create the “stocks” topic and generate data
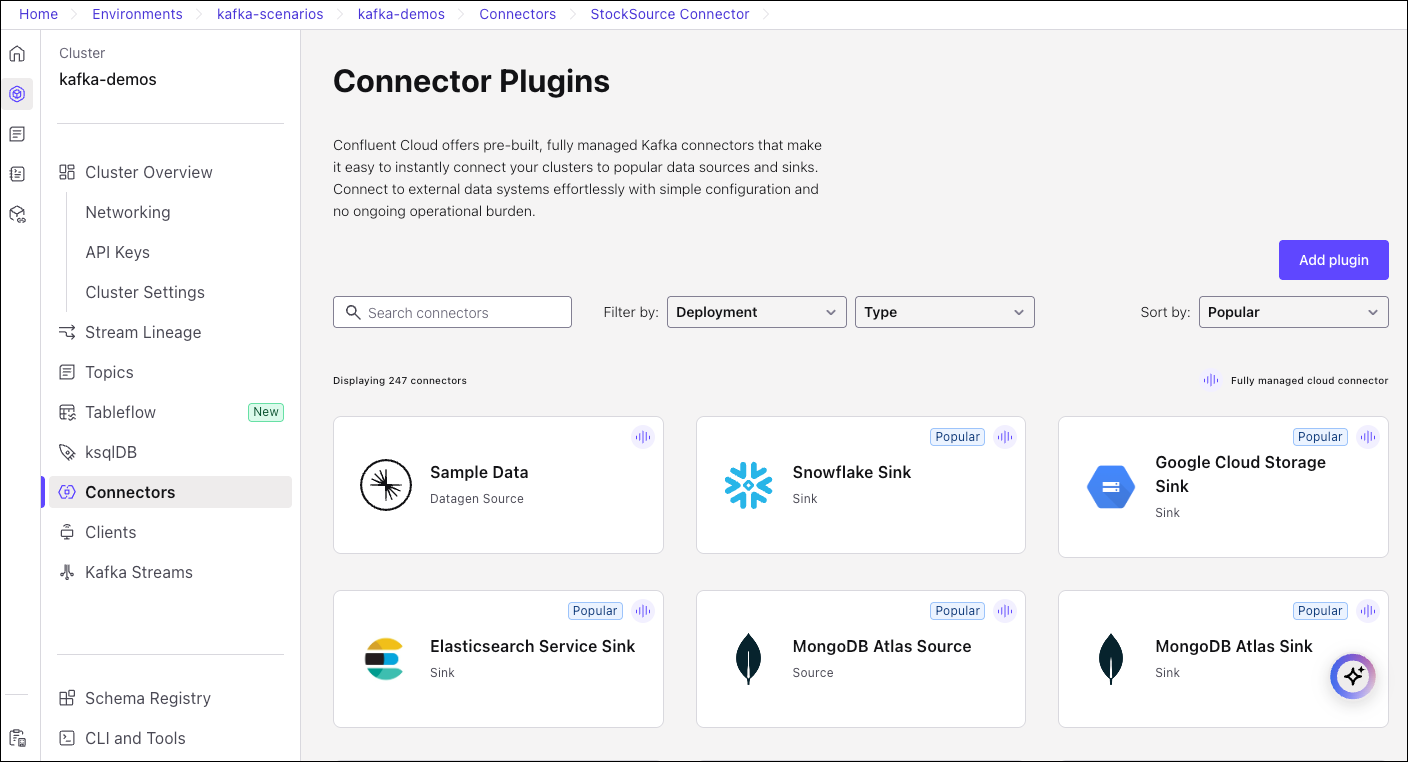
Choose Connectors from the menu, and select the Sample Data (Datagen) source connector.
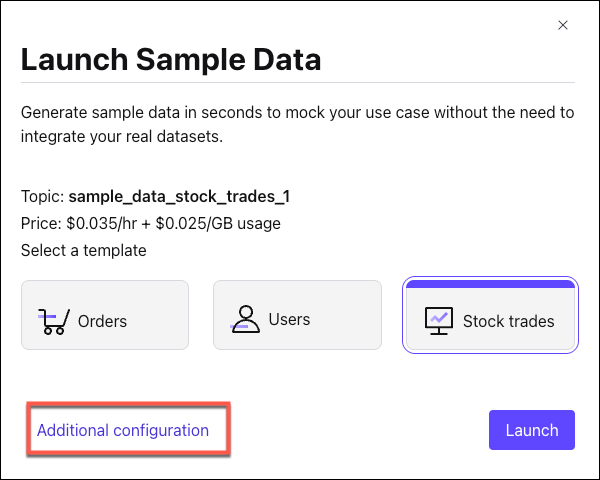
Select the Stock trades template and click Additional configuration.
On Topic selection dialog, click Add new topic, and name the topic
stocks.Accept the defaults for the other settings, and click Create with defaults. (It may take a moment to generate and appear in the list.)
Select the
stockstopic, and click Continue.
On the Kafka credentials dialog, choose My account to allow your connector to globally access everything that you have access to (as this is for development level testing, not for production).
Download and save the key and secret, and click Continue.
On the Configuration dialog, choose the following options, then click Continue.
Output record format: AVRO
Schema: Stock trades
On the Sizing dialog, take the defaults, and click Continue.
On the Review and launch dialog, change the Connector name to StockSource Connector.
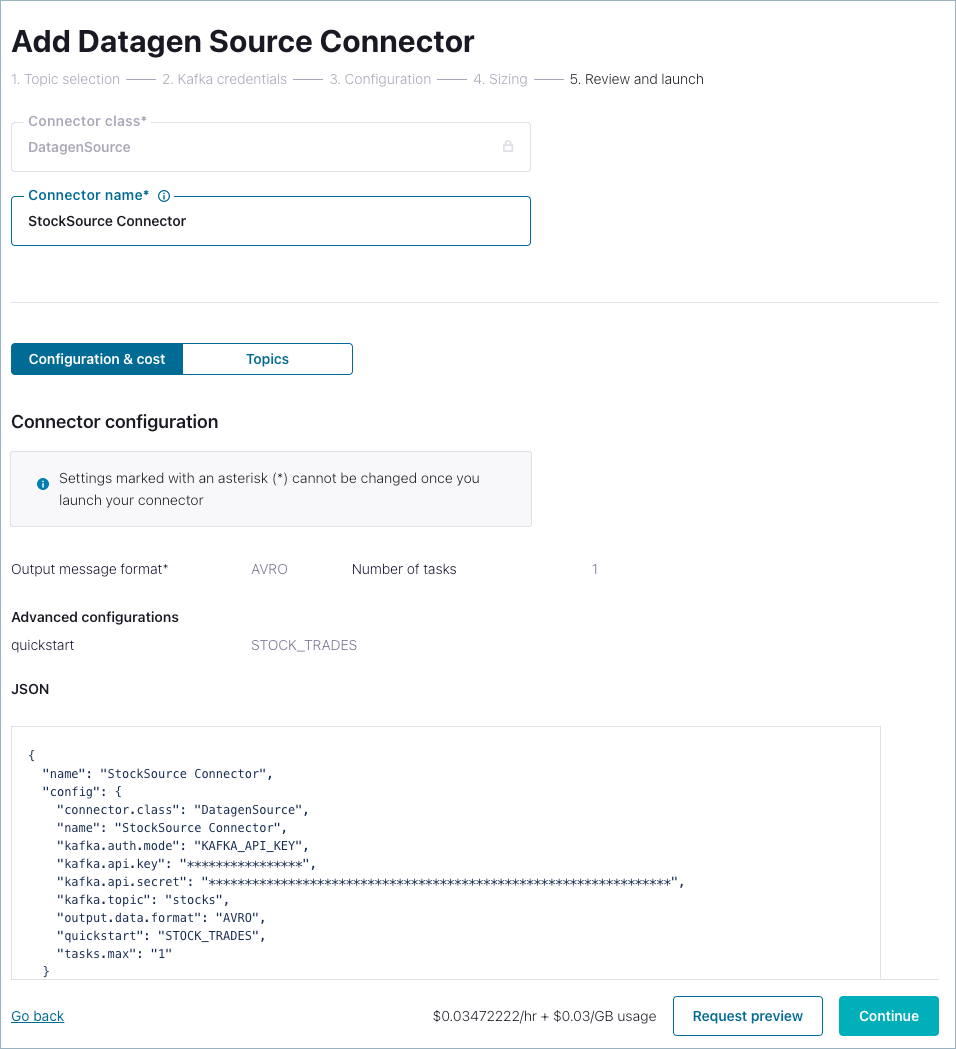
You have added the Connect Datagen source connector to generate sample data. The connector will use AVRO as the output record format, and start sending data to your target topic,
stocks.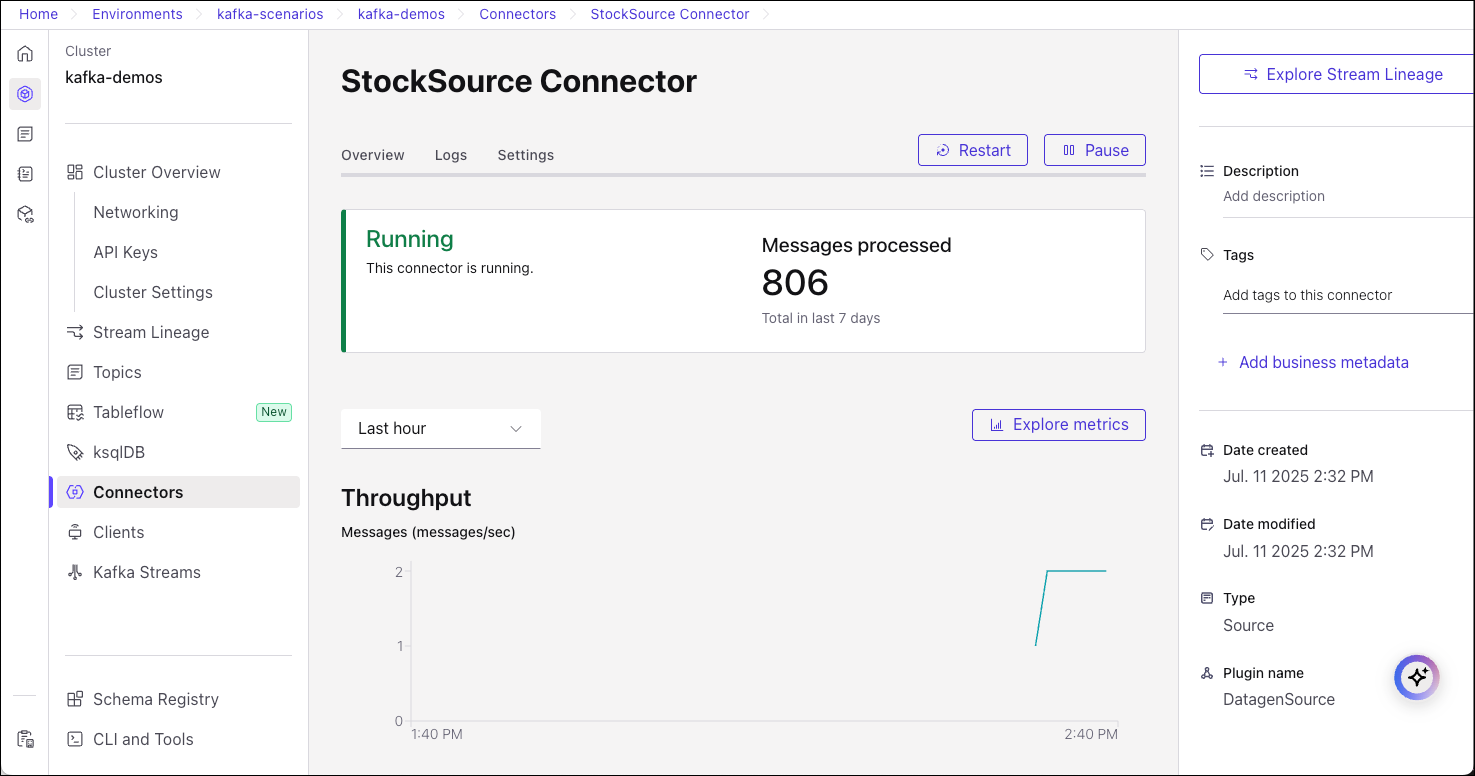
Create a ksqlDB app
Navigate to ksqlDB
Click Create cluster.
For “Access control”, select either My account, then click Continue.
Provide a cluster name, such as
ksqlDB_stocks, and accept the defaults for cluster size.Click Launch cluster.
Tip
Provisioning will take some time. In some cases, it can take up to an hour.
By creating the ksqlDB app with global access, you avoid having to create specific ACLs for the app itself. With global access, the ksqlDB cluster is running with the same level of access to Kafka as the user who provisions ksqlDB. If you are interested in learning how to manage ACLs on a ksqlDB cluster with granular access, see Appendix A: Creating a ksqlDB app with granular access and assigning ACLs.
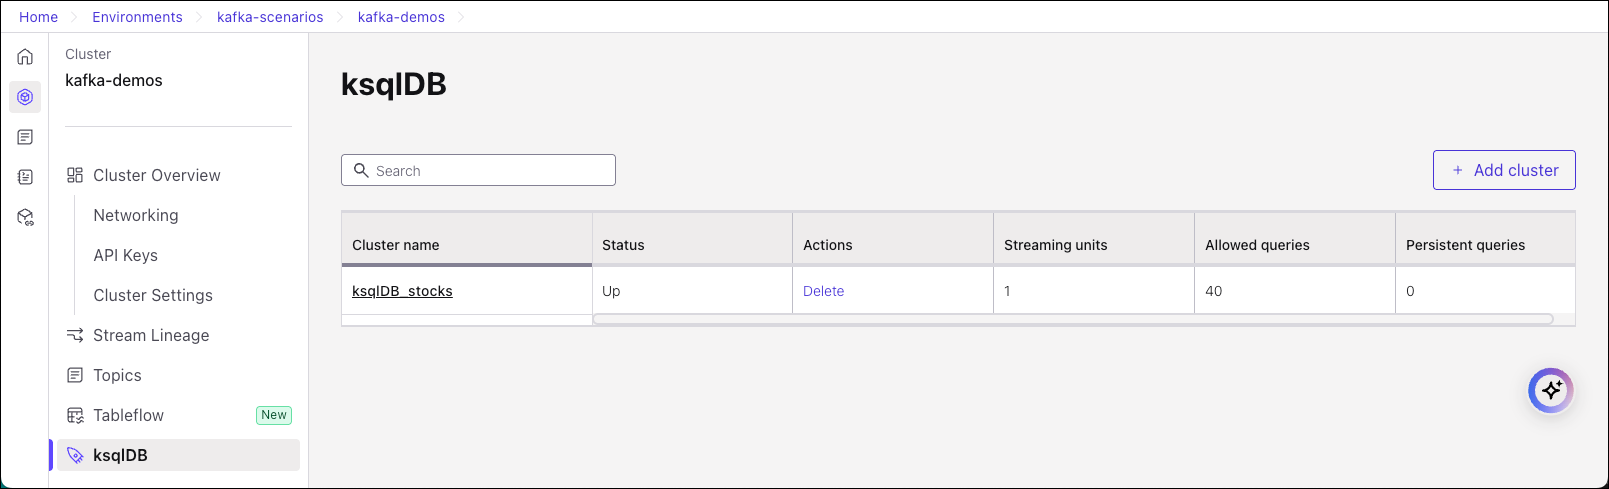
Verify your ksqlDB app is running
Return to the list of ksqlDB apps on the Cloud Console.
Your ksqlDB app should have completed Provisioning, and show a status of Up.
Create persistent streams in ksqlDB to filter on stock prices
Navigate to the ksqlDB Editor and click into your ksqlDB app, ksqlDB_stocks (ksqlDB_stocks > Editor), to create the following persistent streams.
Specify each query statement in the Editor and click Run query to start the query. You can click the Streams tab to view a list of running queries.
Create a stream for the
stockstopic, then create a persistent stream that filters on stocks with price <= 100. This feed the results to thestocks_under_100topic.You’ll need to specify and run three separate queries for this step. You start by creating the
stocksstream, then add the filters to find and list stocks under $100. After each of these, click Run query, then clear the editor to specify the next statement.CREATE STREAM stocks WITH (KAFKA_TOPIC = 'stocks', VALUE_FORMAT = 'AVRO');
CREATE STREAM stocks_under_100 WITH (KAFKA_TOPIC='stocks_under_100', PARTITIONS=10, REPLICAS=3) AS SELECT * FROM stocks WHERE (price <= 100);
SELECT * FROM stocks_under_100 EMIT CHANGES;
When you have these running, click the Streams tab. You should have two new streams,
STOCKSandSTOCKS_UNDER_100. (The last statement is a transient query on the stream,STOCKS_UNDER_100, to display data in the Cloud Console.)Switch back to the Editor for the next step.
Create a persistent stream that filters on stocks to BUY, and feed the results to the
stocks_buytopic.You’ll need to specify and run two separate queries for this step. After each of these, click Run query, then clear the editor to specify the next statement.
CREATE STREAM stocks_buy WITH (KAFKA_TOPIC='stocks_buy', PARTITIONS=10, REPLICAS=3) AS SELECT * FROM stocks WHERE side='BUY';
SELECT * FROM stocks_buy EMIT CHANGES;
Switch to the Streams tab to view your recent additions to the Streams list.
Click the Editor for the next step. (Switching back and forth will also give some time for the queries to start up.)
Create a persistent stream that filters on stocks to SELL.
You’ll need to specify and run two separate queries for this step. After each of these, click Run query, then clear the editor to specify the next statement.
CREATE STREAM stocks_sell WITH (KAFKA_TOPIC='stocks_sell', PARTITIONS=10, REPLICAS=3) AS SELECT * FROM stocks WHERE side='SELL';
SELECT * FROM stocks_sell EMIT CHANGES;
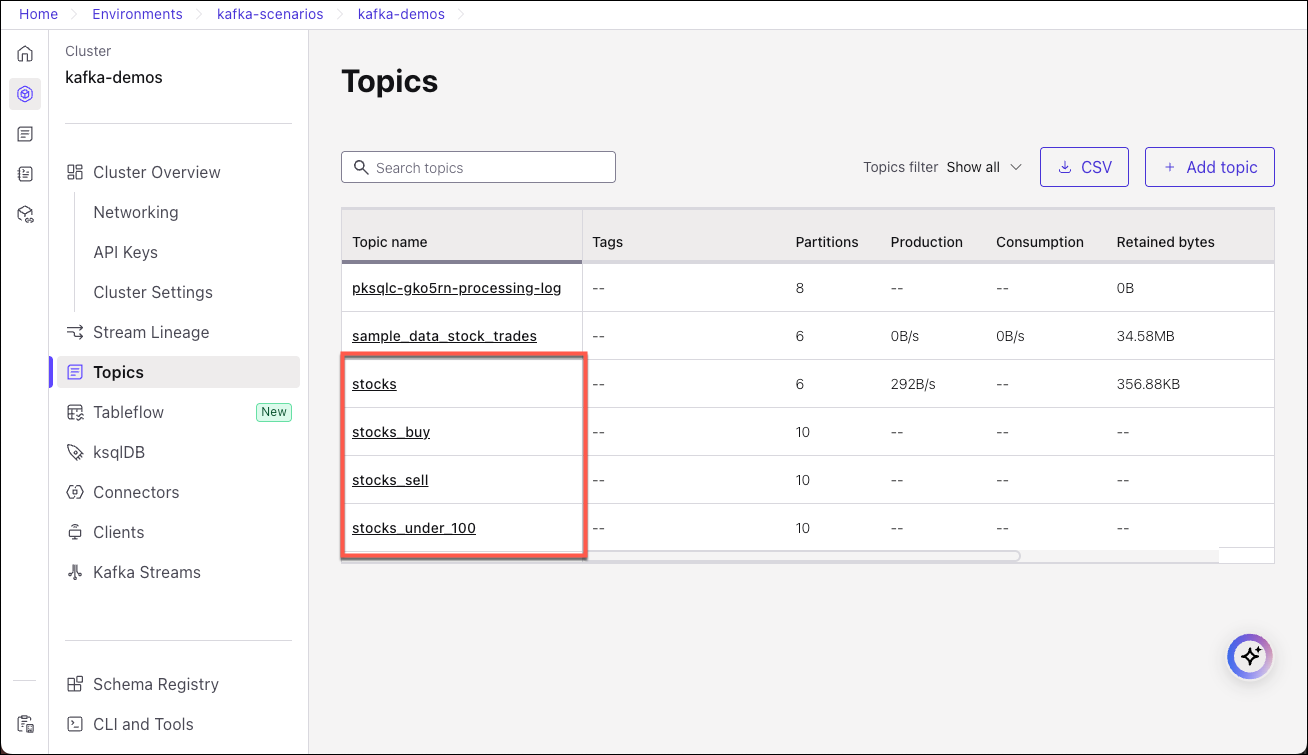
When you have completed these steps, click the ksqlDB > Streams tab. You should have four persistent ksqlDB query streams producing data to their associated topics:
STOCKSSTOCKS_BUYSTOCKS_SELLSTOCKS_UNDER_100
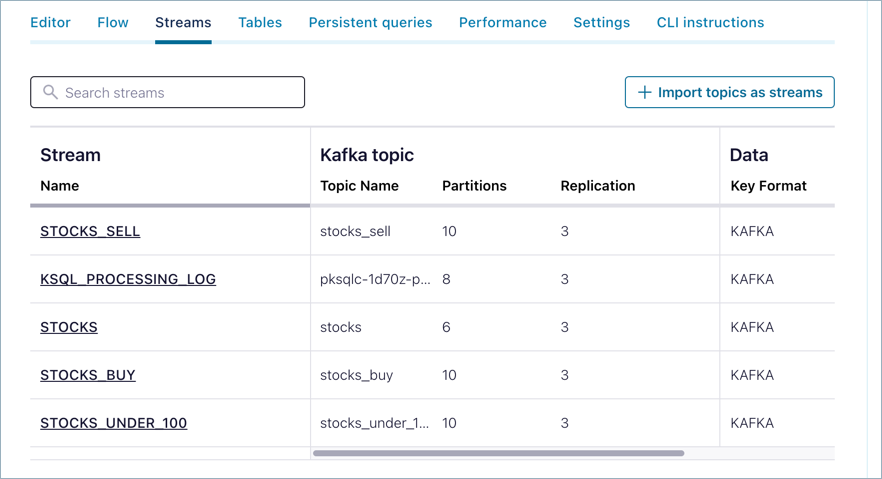
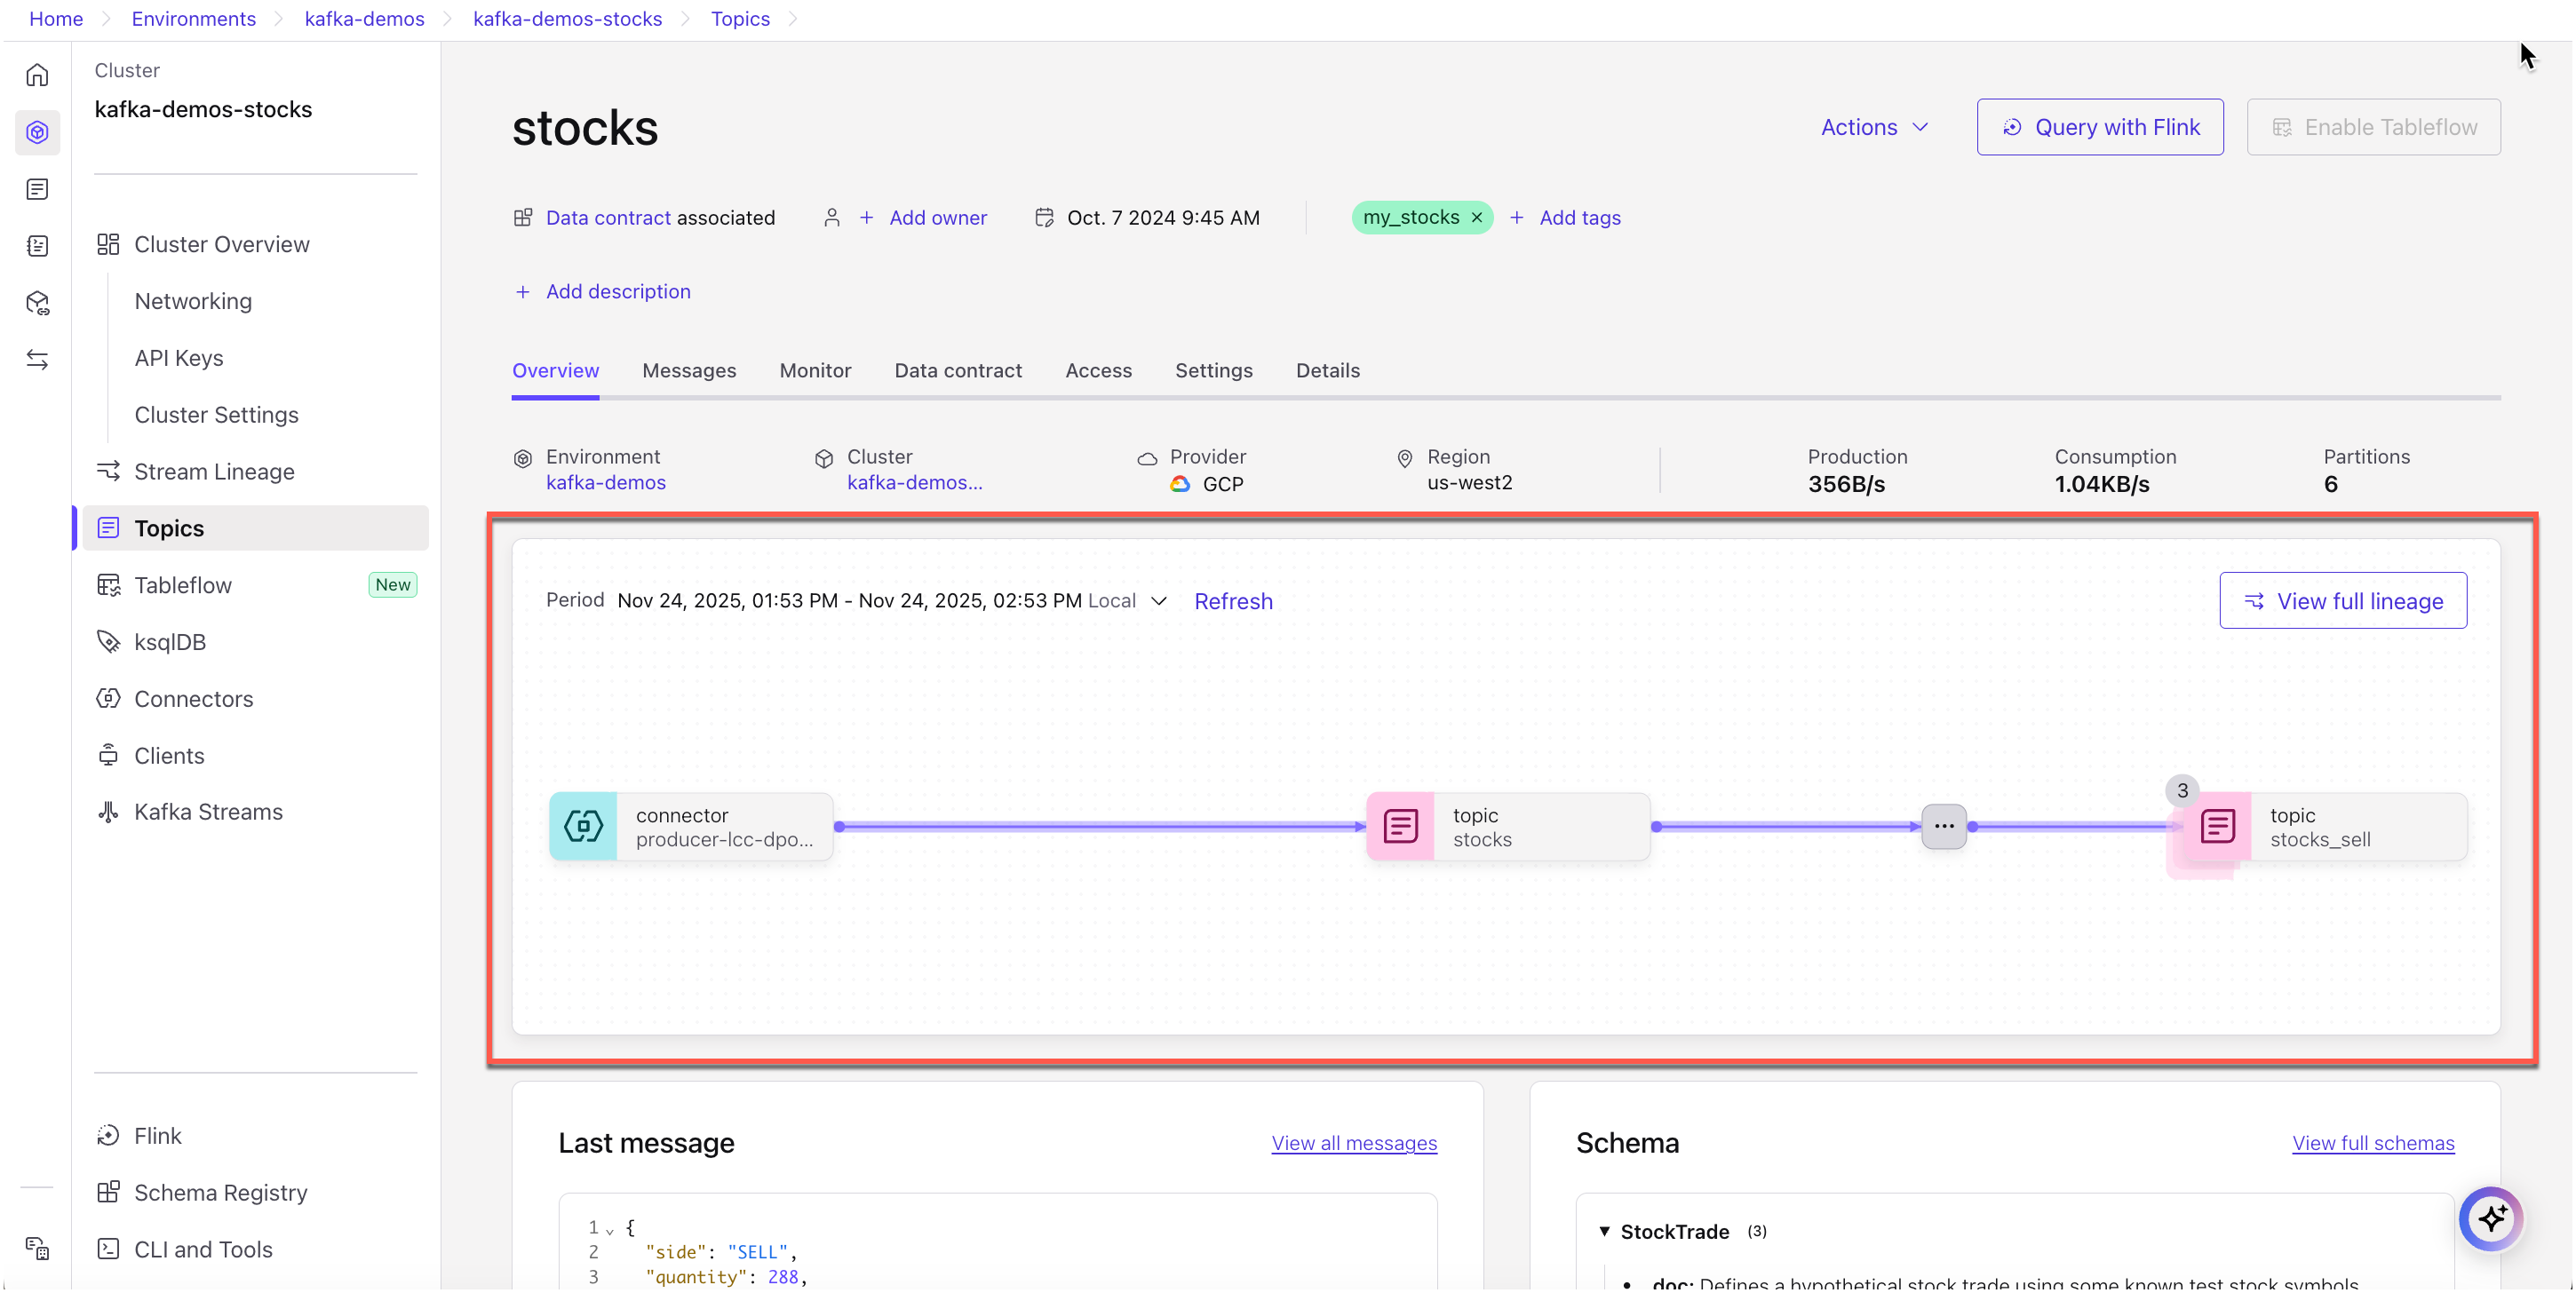
The associated topics and schemas will be listed on those pages, respectively. Here is an example of the Topics page.
Consume events from the “stocks” topic
Now, set up a consumer using the Confluent CLI to consume events from your stocks topic.
Tip
Got Confluent CLI? Make sure it’s up-to-date.
If you already have the Confluent CLI, run
confluent updateto get the latest version. Once you’ve upgraded, check out this handy CLI confluent commands reference available here.To learn more about the Confluent CLI and migration paths, see Install Confluent CLI, Migrate to the latest version of the Confluent CLI, and Run multiple CLIs in parallel.
Log on using the Confluent CLI. (Provide username and password at prompts.)
confluent login --url https://confluent.cloud
List the environments to verify you are on the environment.
confluent environment list
If needed, re-select the environment you’ve been using for this demo. (The active environment should have an asterisk beside it.):
confluent environment use <ENVIRONMENT_ID>
List the clusters to verify you are on the right cluster.
confluent kafka cluster list
If needed, re-select the cluster you’ve been using for this demo. (The active cluster should have an asterisk beside it.)
confluent kafka cluster use <KAFKA_CLUSTER_ID>
Create Kafka API credentials for the consumer.
Create an API key.
confluent api-key create --resource <KAFKA_CLUSTER_ID>
Use the API key.
confluent api-key use <API_KEY> --resource <KAFKA_CLUSTER_ID>
Alternatively, you can store the key.
confluent api-key store --resource <KAFKA_CLUSTER_ID>
Run a CLI consumer.
confluent kafka topic consume stocks_buy --value-format avro --group buy_group
When prompted, provide the Schema Registry API key you generated in the first steps.
You should see the consumer data being generated to the consumer at the command line, for example:
My-MacBook-Pro:~ my$ confluent kafka topic consume stocks_buy --value-format avro --group buy_group
Starting Kafka Consumer. ^C or ^D to exit
{"SIDE":{"string":"BUY"},"QUANTITY":{"int":959},"SYMBOL":{"string":"ZVZZT"},"PRICE":{"int":704},"ACCOUNT":{"string":"XYZ789"},"USERID":{"string":"User_8"}}
{"ACCOUNT":{"string":"ABC123"},"USERID":{"string":"User_1"},"SIDE":{"string":"BUY"},"QUANTITY":{"int":1838},"SYMBOL":{"string":"ZWZZT"},"PRICE":{"int":405}}
{"QUANTITY":{"int":2163},"SYMBOL":{"string":"ZTEST"},"PRICE":{"int":78},"ACCOUNT":{"string":"ABC123"},"USERID":{"string":"User_8"},"SIDE":{"string":"BUY"}}
{"PRICE":{"int":165},"ACCOUNT":{"string":"LMN456"},"USERID":{"string":"User_2"},"SIDE":{"string":"BUY"},"QUANTITY":{"int":4675},"SYMBOL":{"string":"ZJZZT"}}
{"QUANTITY":{"int":1702},"SYMBOL":{"string":"ZJZZT"},"PRICE":{"int":82},"ACCOUNT":{"string":"XYZ789"},"USERID":{"string":"User_7"},"SIDE":{"string":"BUY"}}
{"ACCOUNT":{"string":"LMN456"},"USERID":{"string":"User_9"},"SIDE":{"string":"BUY"},"QUANTITY":{"int":2982},"SYMBOL":{"string":"ZVV"},"PRICE":{"int":643}}
{"SIDE":{"string":"BUY"},"QUANTITY":{"int":3687},"SYMBOL":{"string":"ZJZZT"},"PRICE":{"int":514},"ACCOUNT":{"string":"ABC123"},"USERID":{"string":"User_5"}}
{"USERID":{"string":"User_5"},"SIDE":{"string":"BUY"},"QUANTITY":{"int":289},"SYMBOL":{"string":"ZJZZT"},"PRICE":{"int":465},"ACCOUNT":{"string":"XYZ789"}}
...
Explore the data pipeline in Stream Lineage
Stream data quick tour
With the producers and consumers up and running, you can use Stream Lineage to visualize and explore the flow of data from the source connector to the STOCKS topic, where queries filter the data on specified limits and generate lists to your three topics: - STOCKS_BUY - STOCKS_SELL - STOCKS_UNDER_100
Search for
stockstopic on the search box, then clickstocksunder Topic in that list.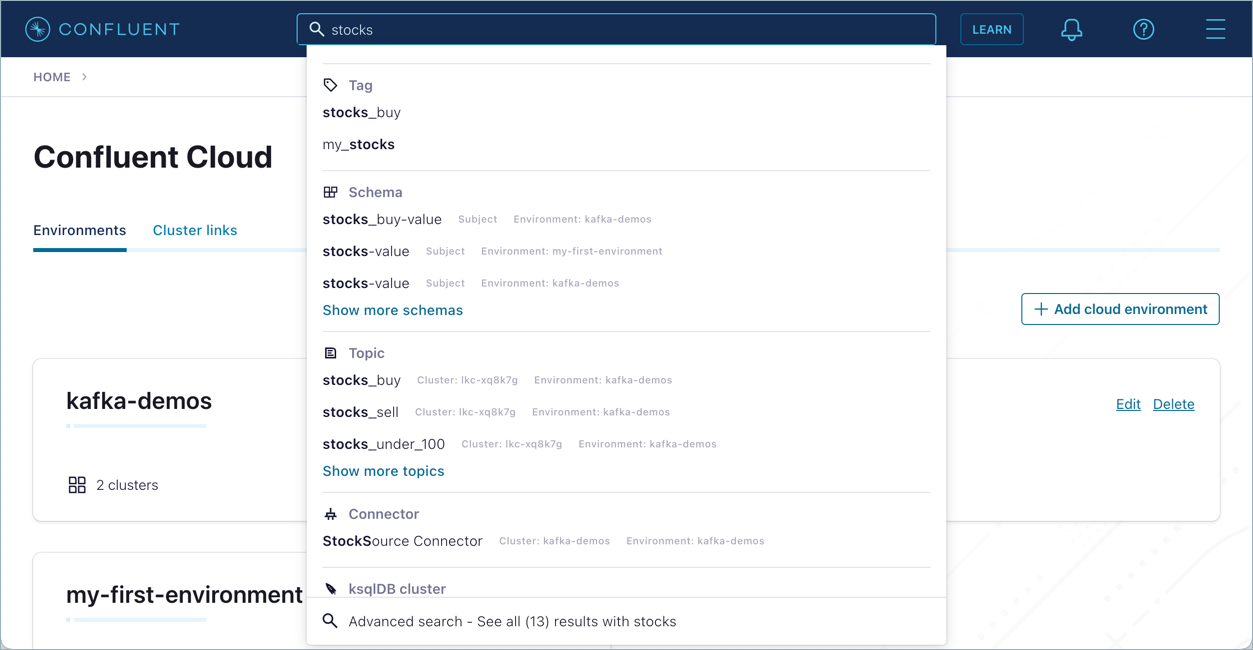
On the
stockstopic page, in the embedded lineage view, click View full lineage.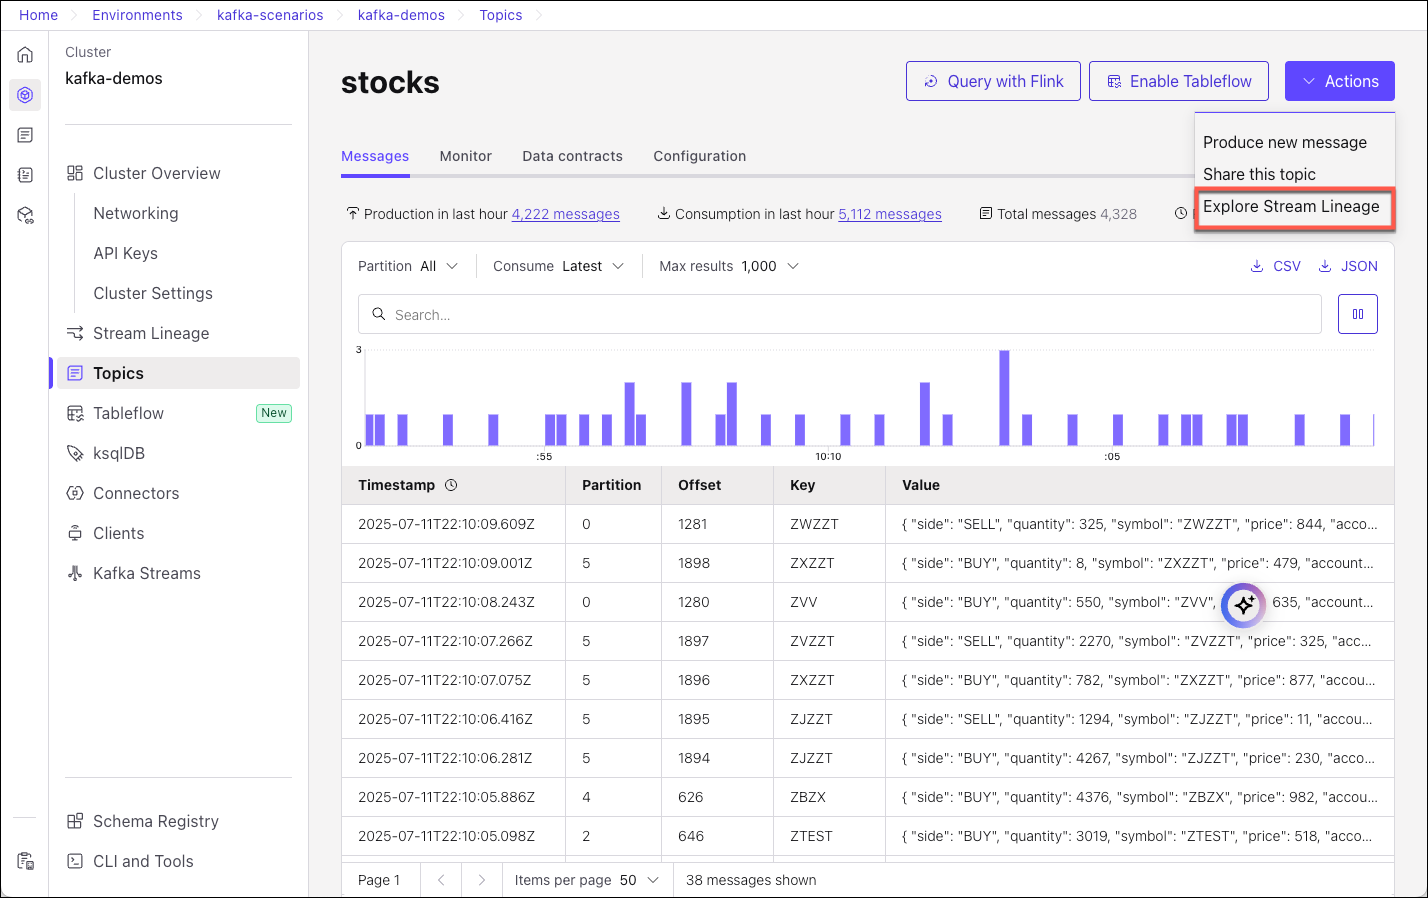
The Stream Lineage for the
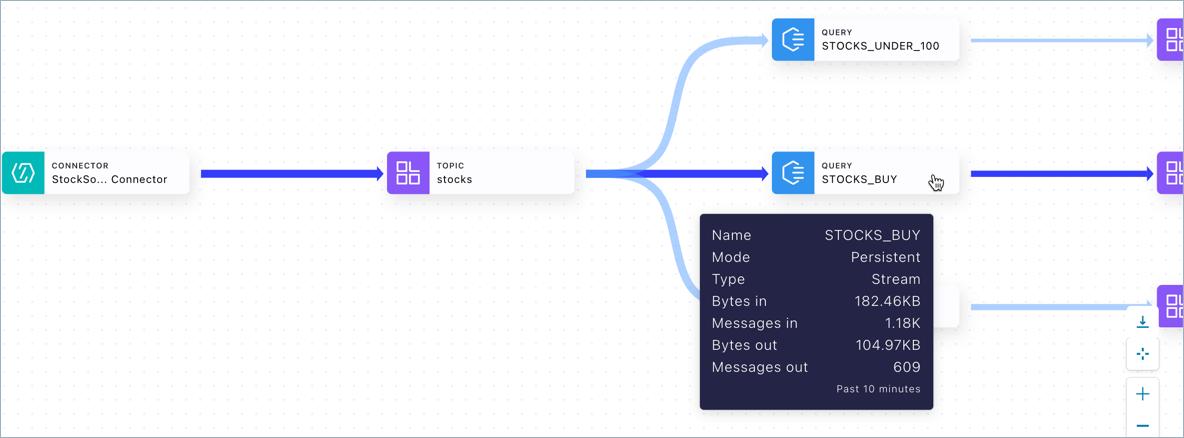
stockstopic is shown.Hover on a node for a high level description of the data source and throughput.
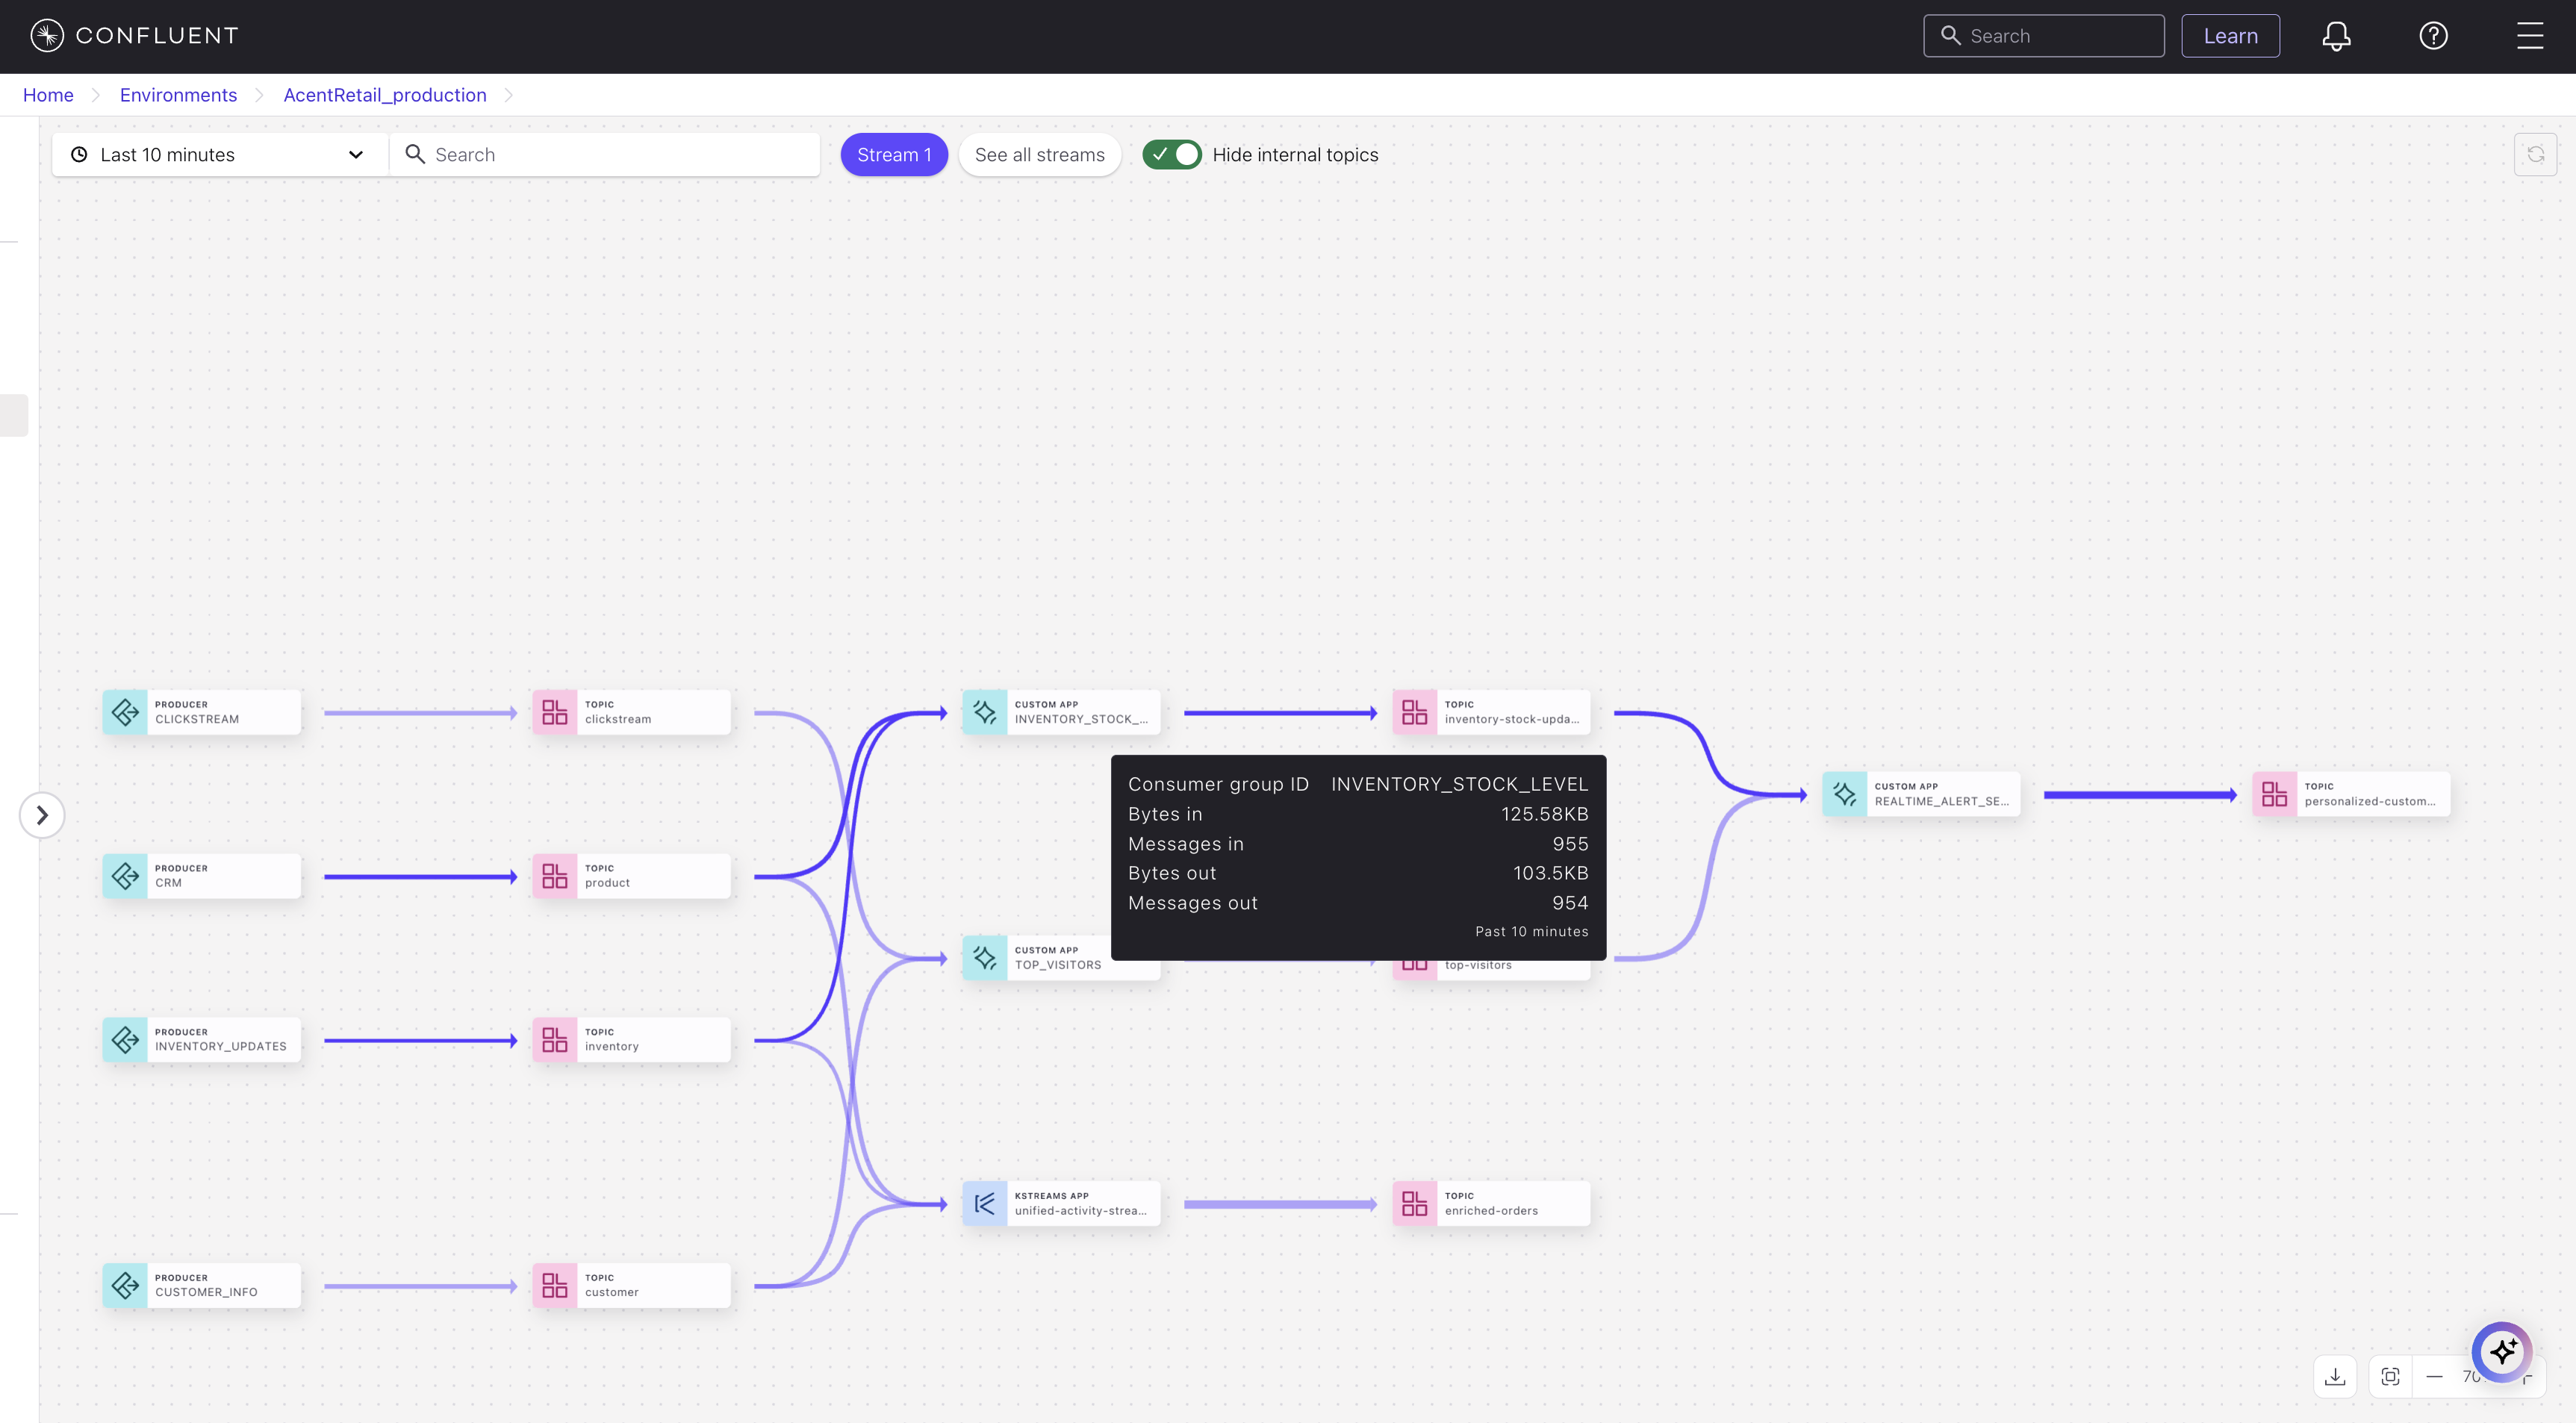
This example shows a ksqlDB query node
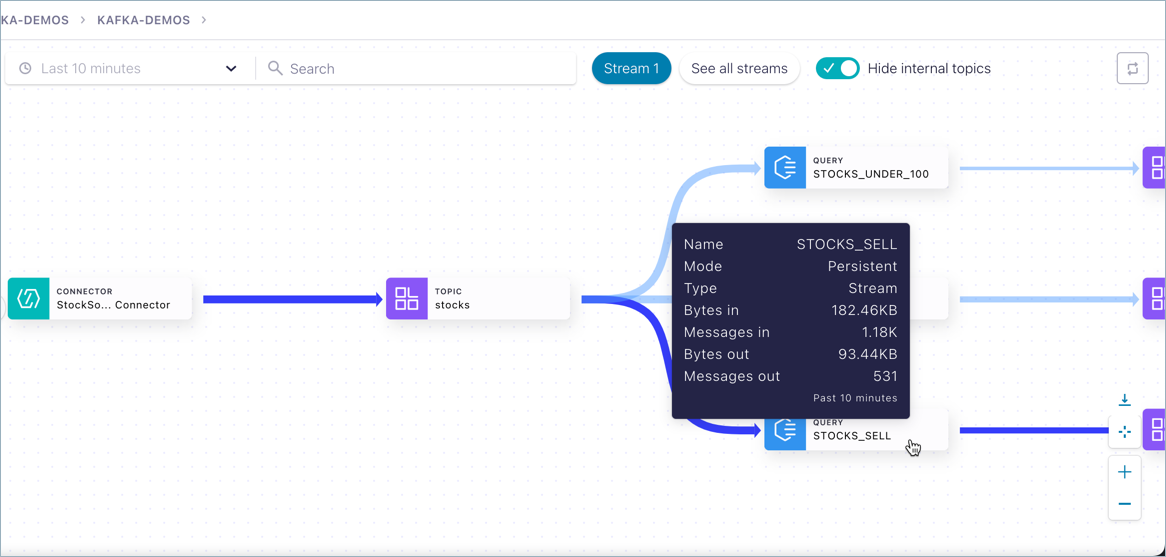
The thumbnail in this case shows:
Mode and type: persistent stream
Total number of bytes in and out of the flow for the last 10 minutes
Total number of messages in and out of the flow for the last 10 minutes
This example shows a topic node:
The thumbnail in this case shows:
Topic name
Schema format (can be Avro, Protobuf, or JSON schema)
Number of partitions for the topic
Total number of bytes into the topic during the last 10 minutes
Total number of messages received by the topic in the last 10 minutes
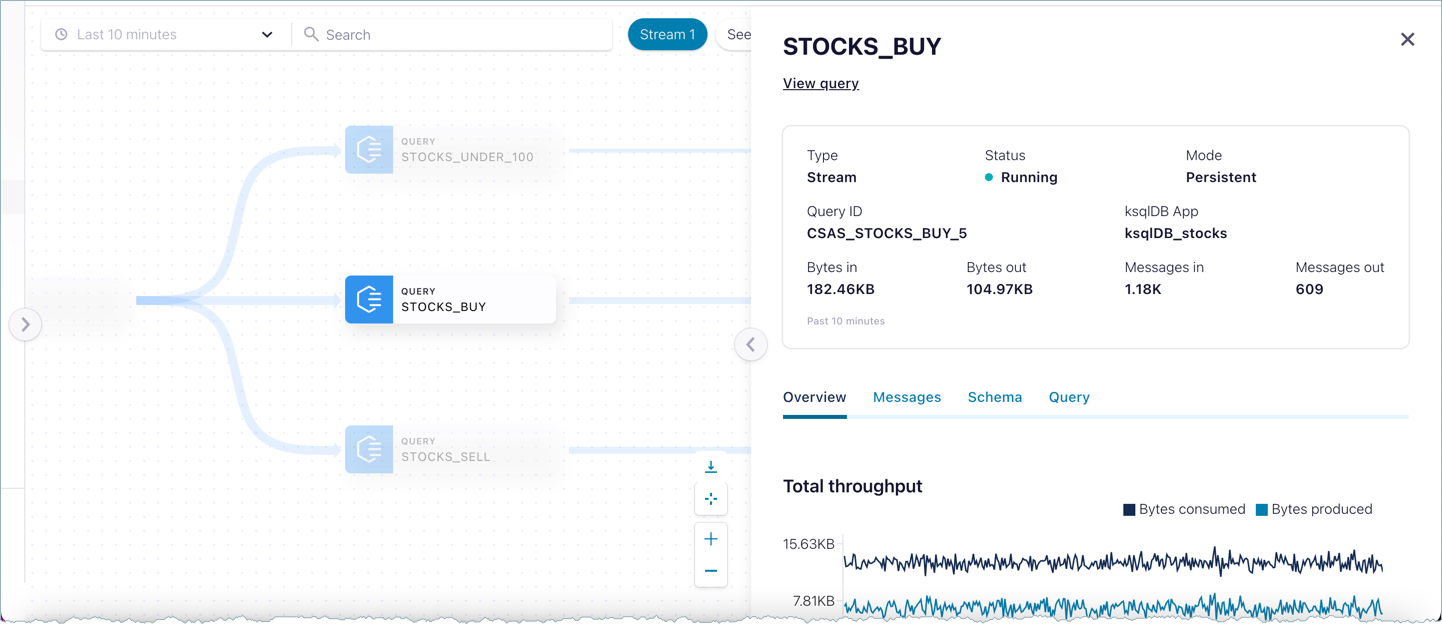
Click a node to inspect.
Return to the diagram, and hover on an edge to get a description of the flow between the given nodes.
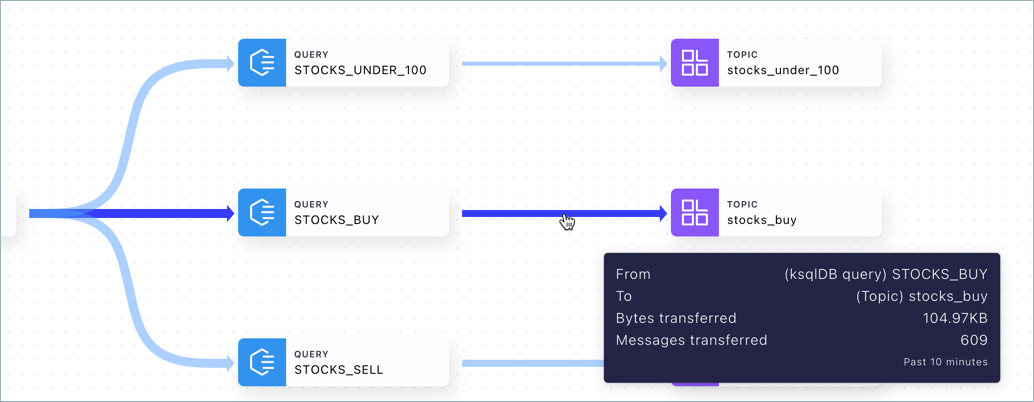
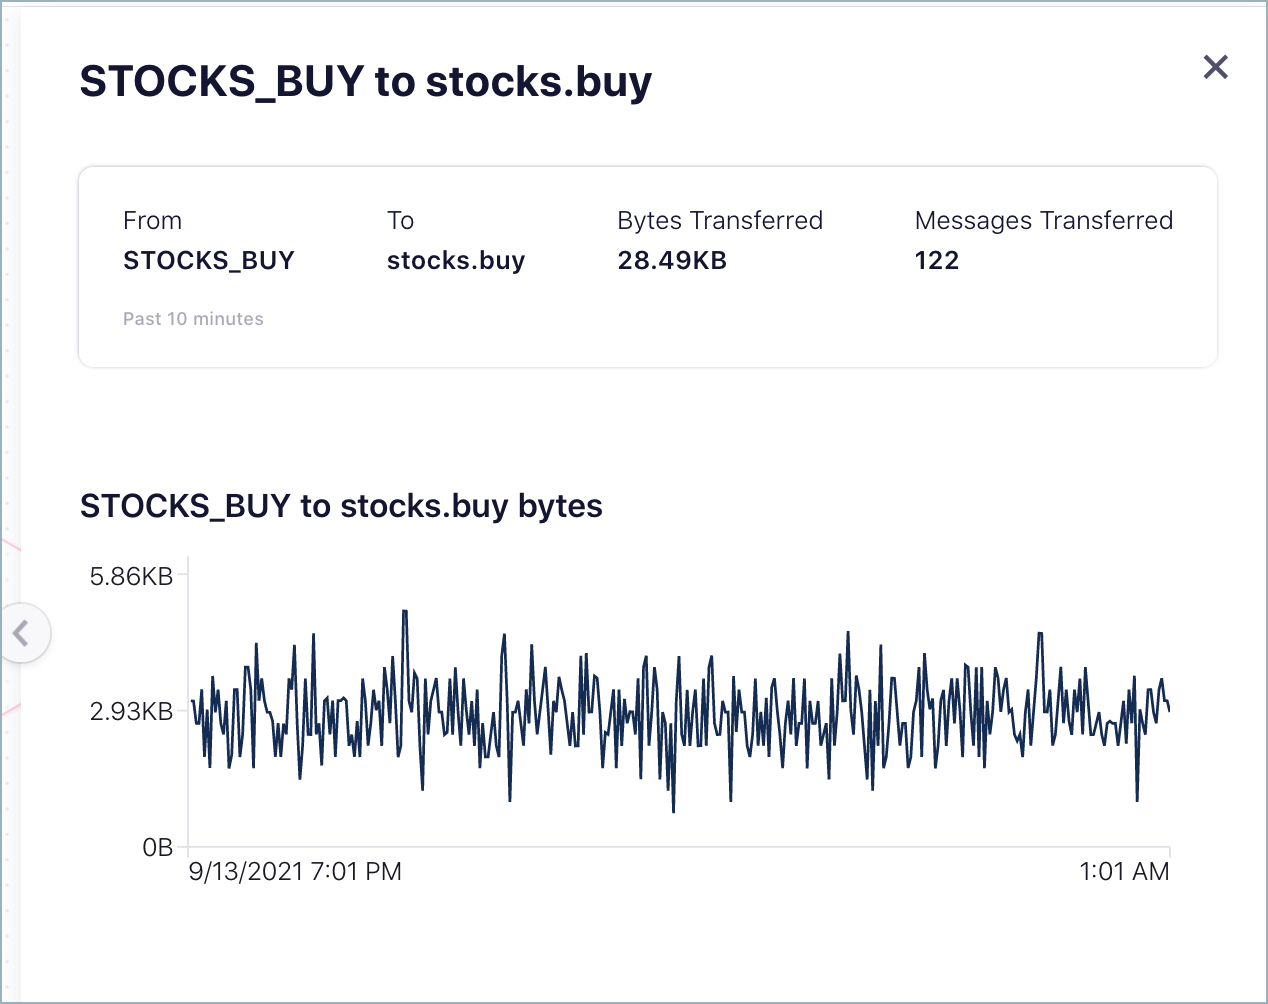
Click the edge to inspect.
Tabs on node drilldown to inspect queries
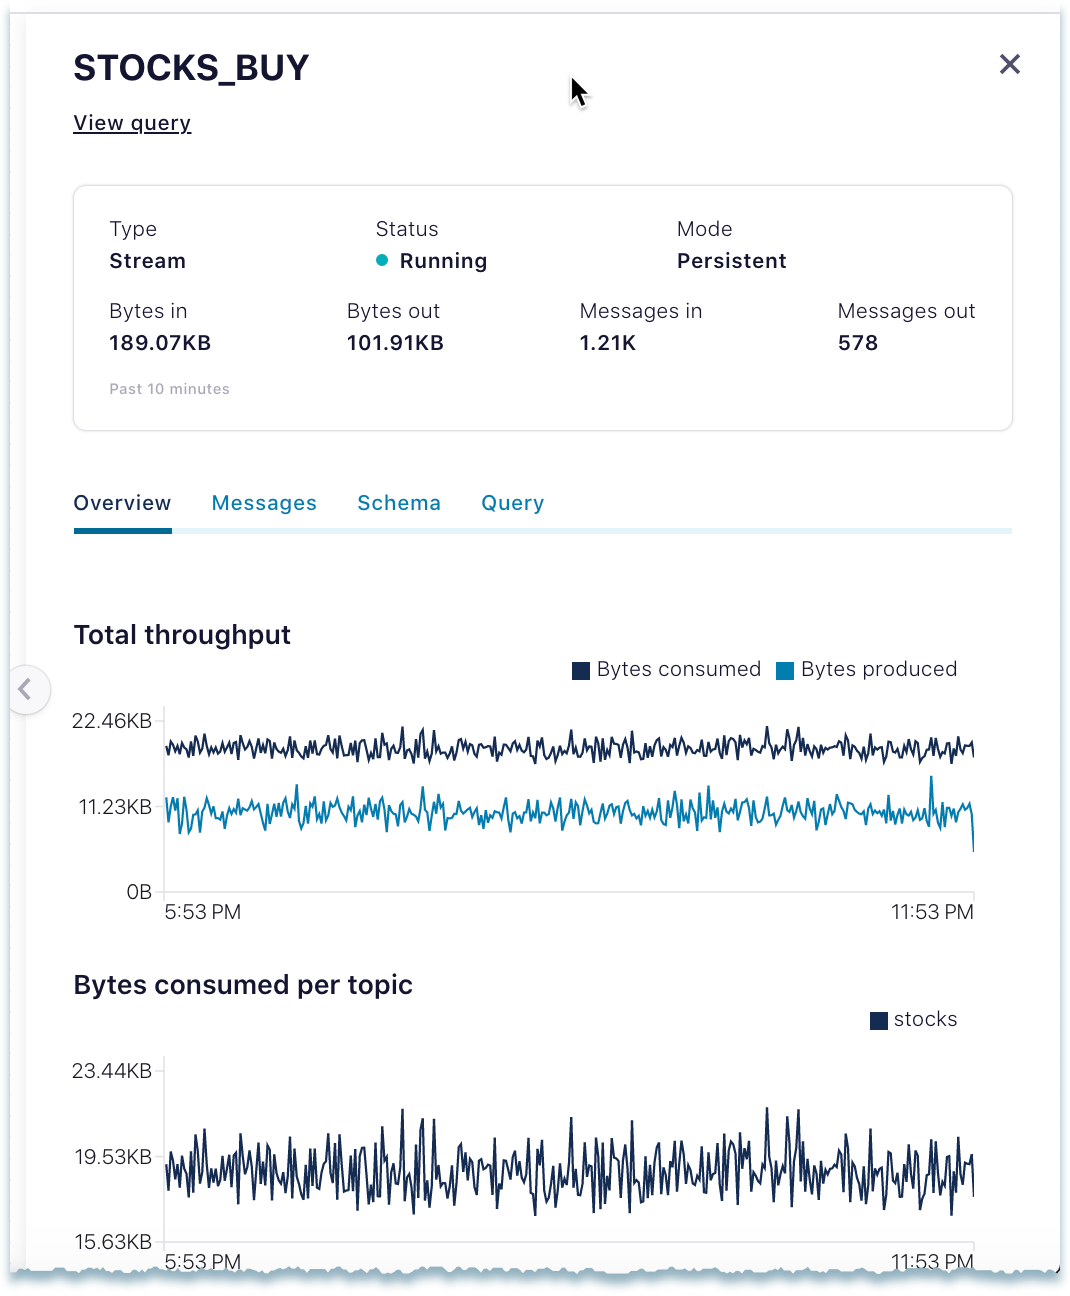
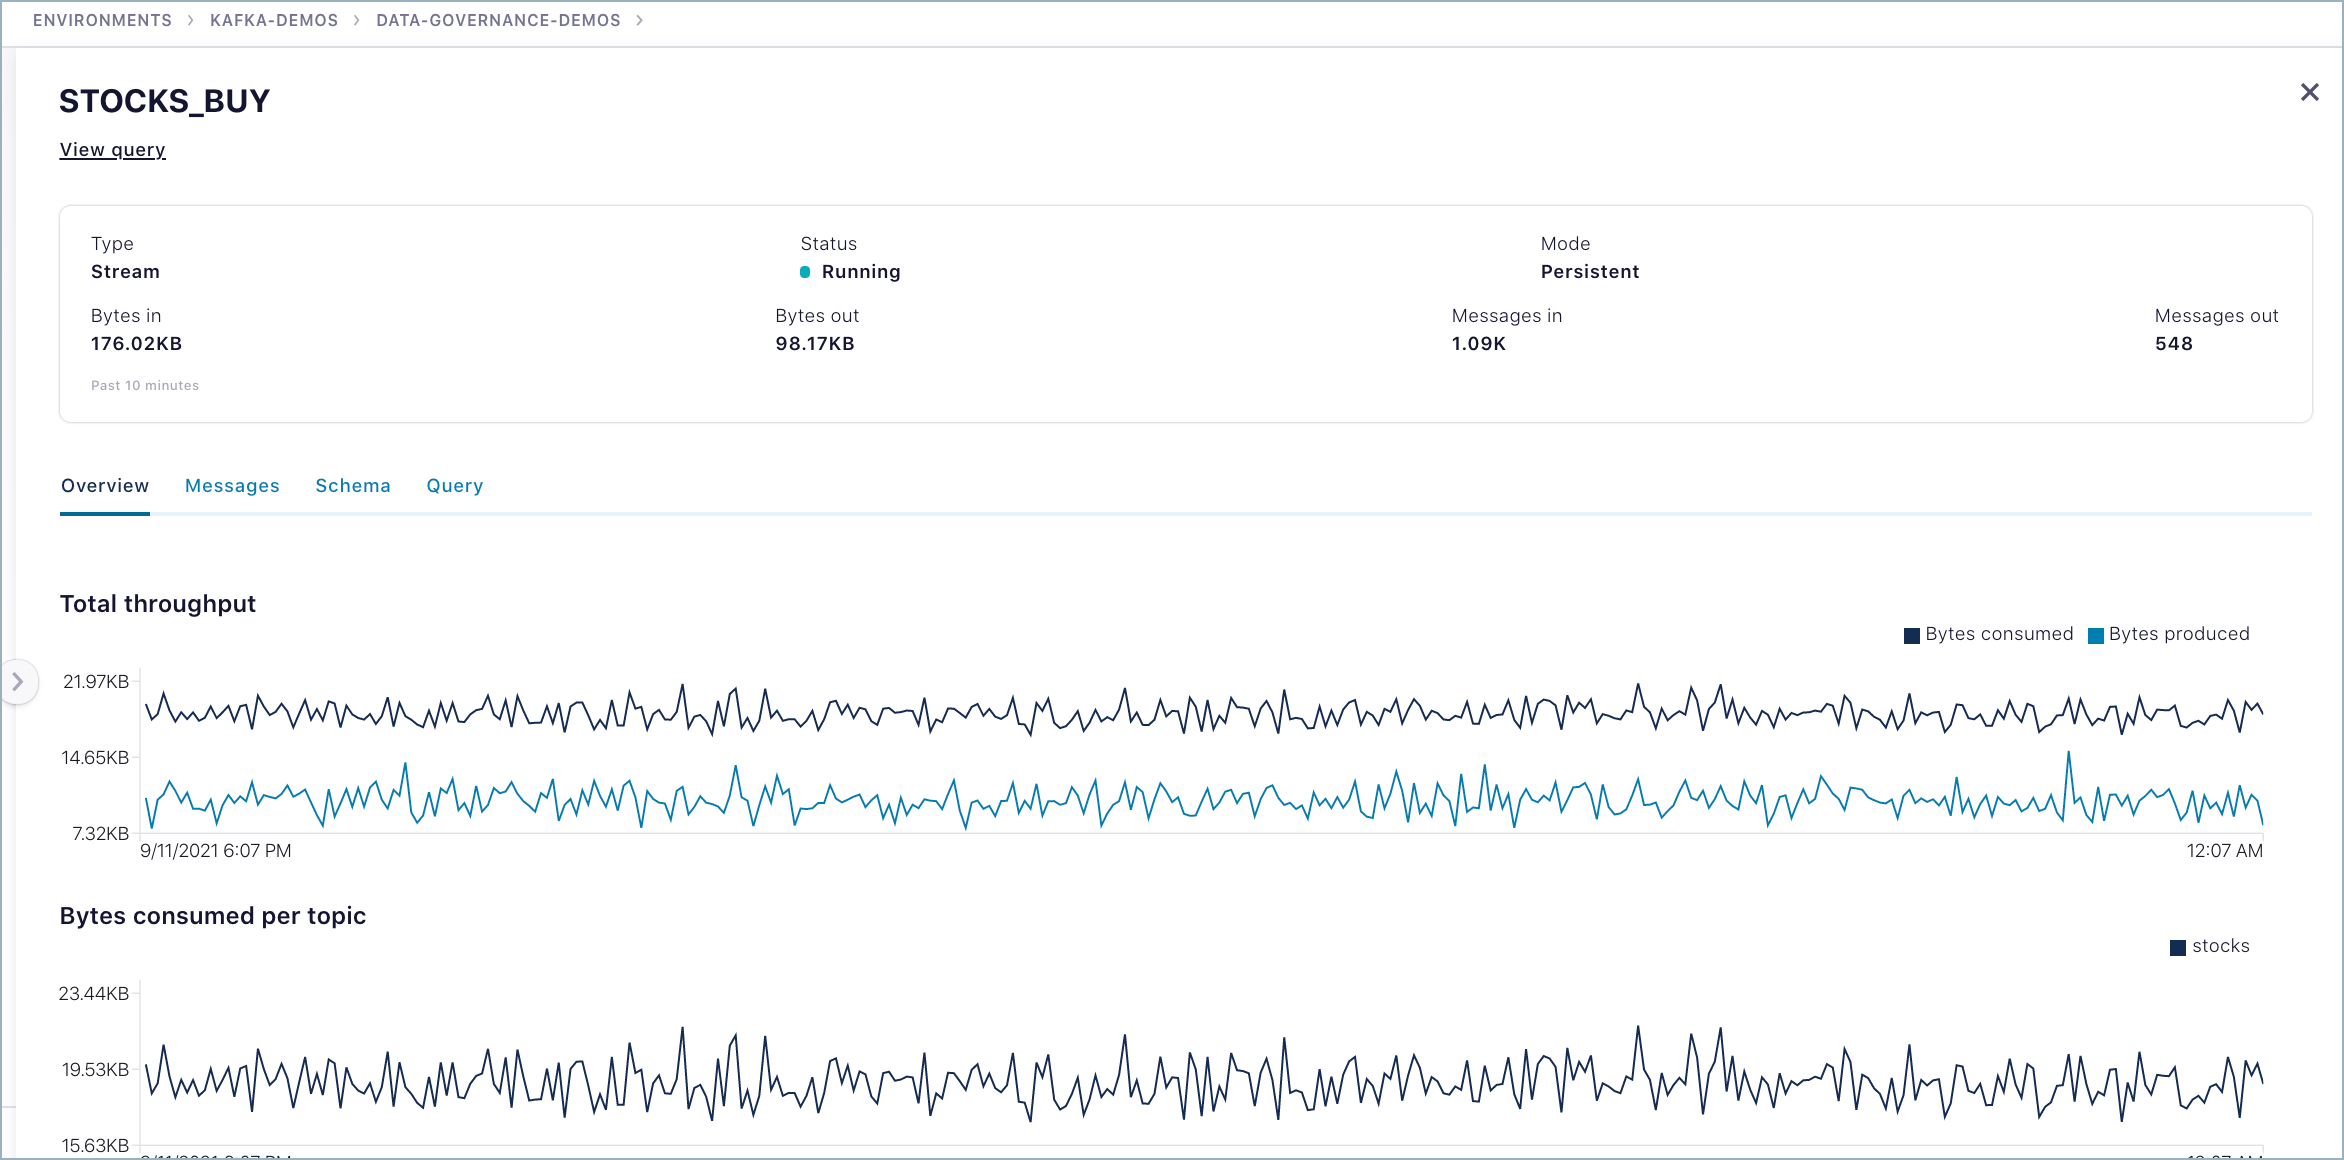
The Stream Lineage inspect panel surfaces details and metrics about the queries based on the nodes you select. The tabs available and details shown will vary, depending on the query. For example:
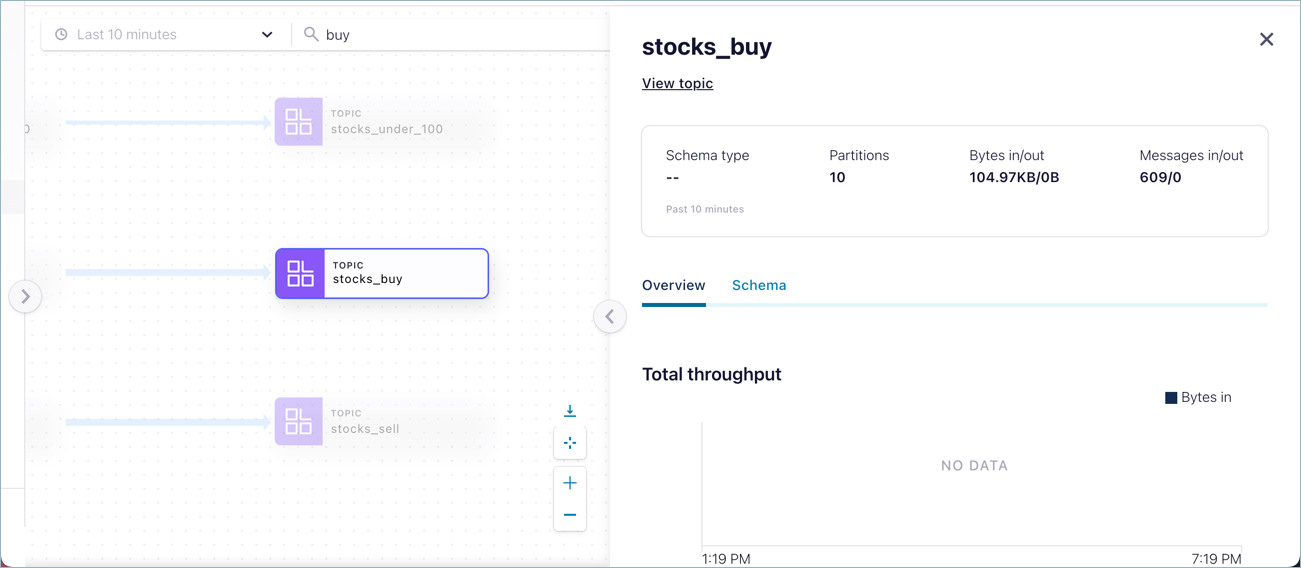
Overview tab - Shows per topic throughput, along with bytes consumed and produced.
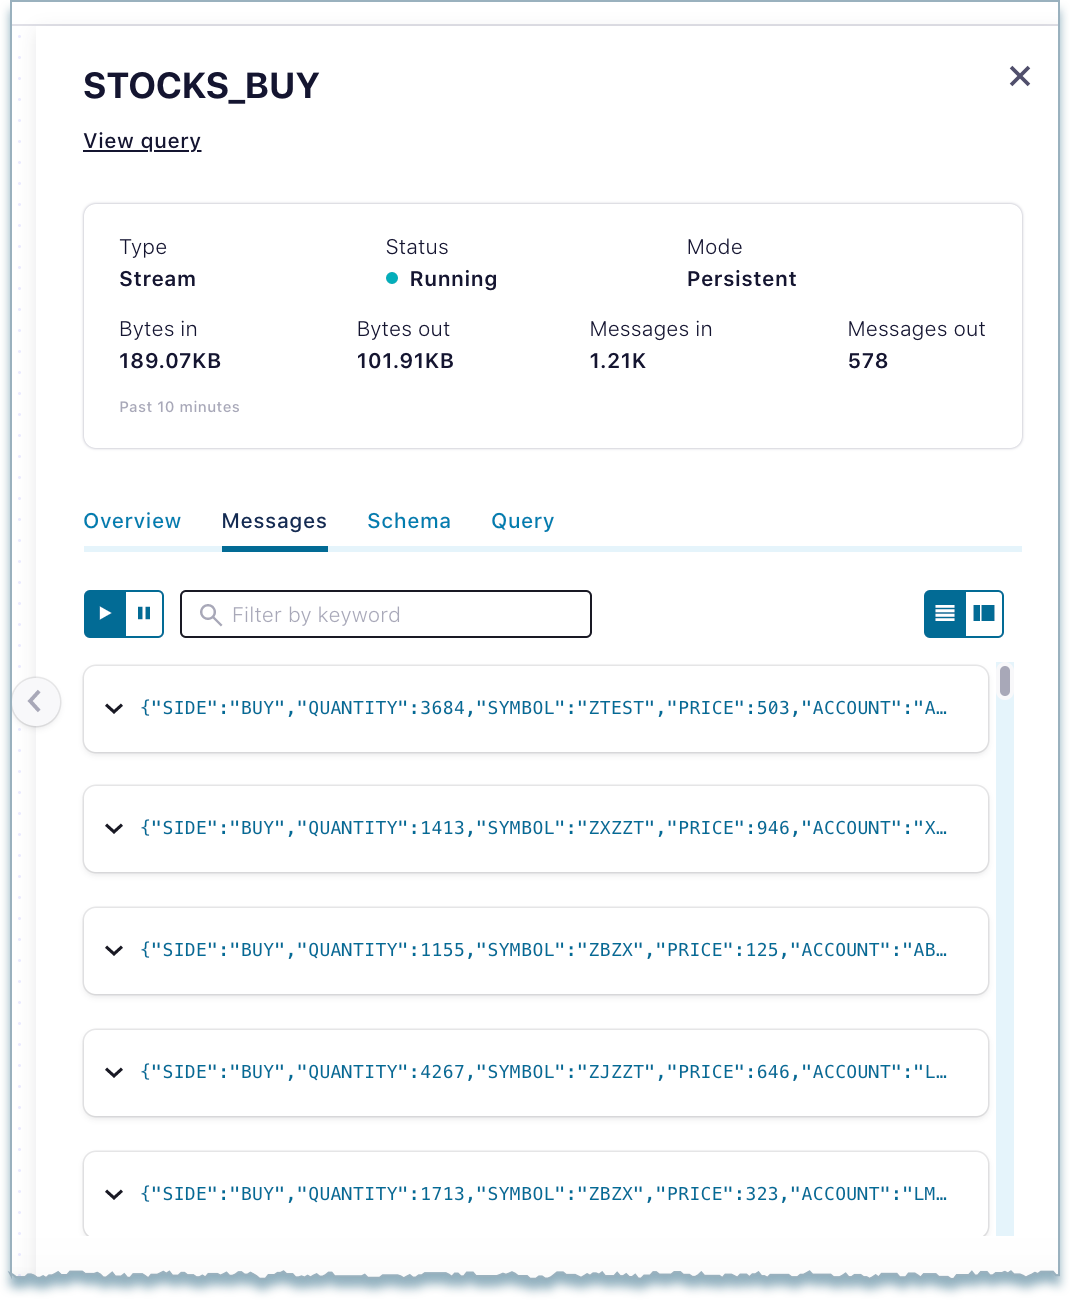
Messages tab - Shows the list of messages the topic received.
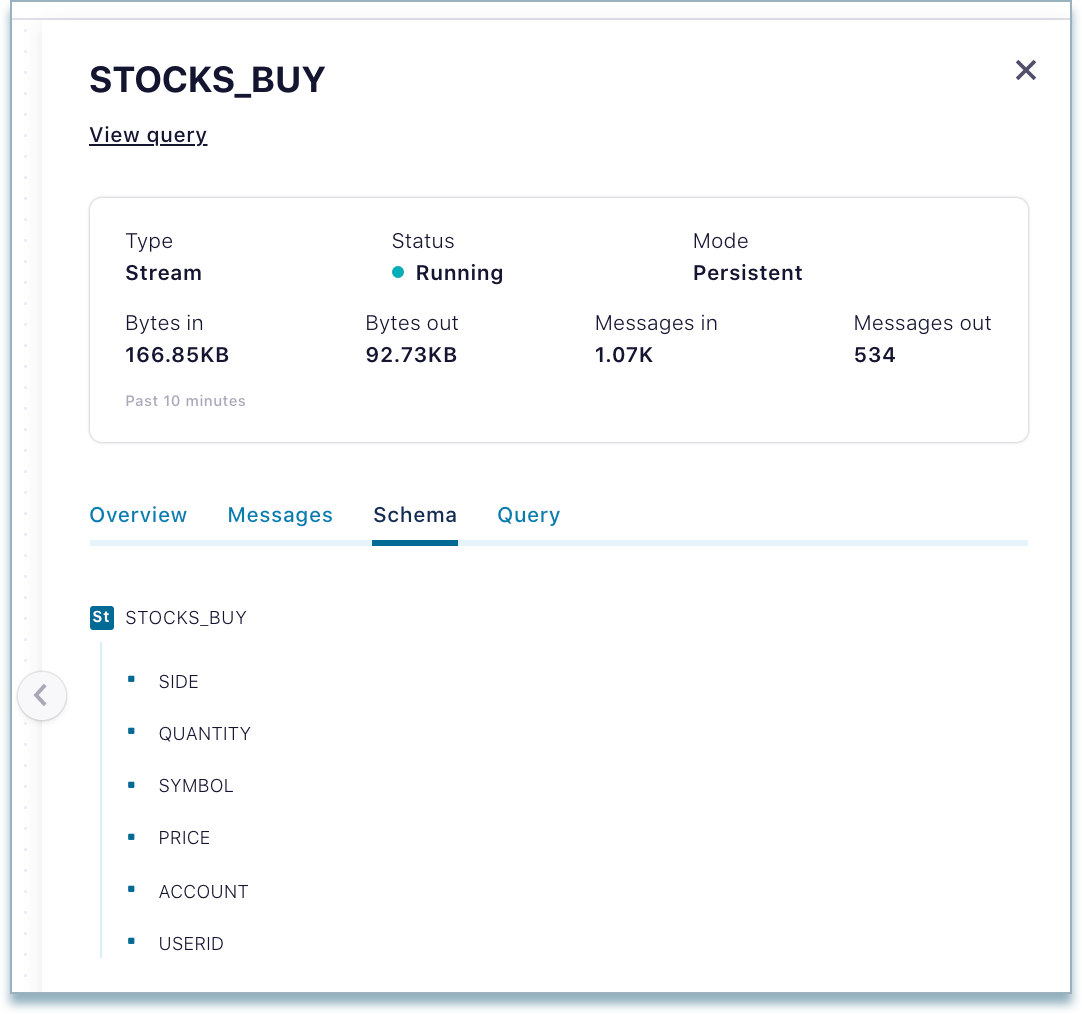
Schema tab - Shows a view-only copy of the schema for the topic. An editable version is available directly from the topic (see Manage Schemas and Data Contracts in Confluent Cloud).
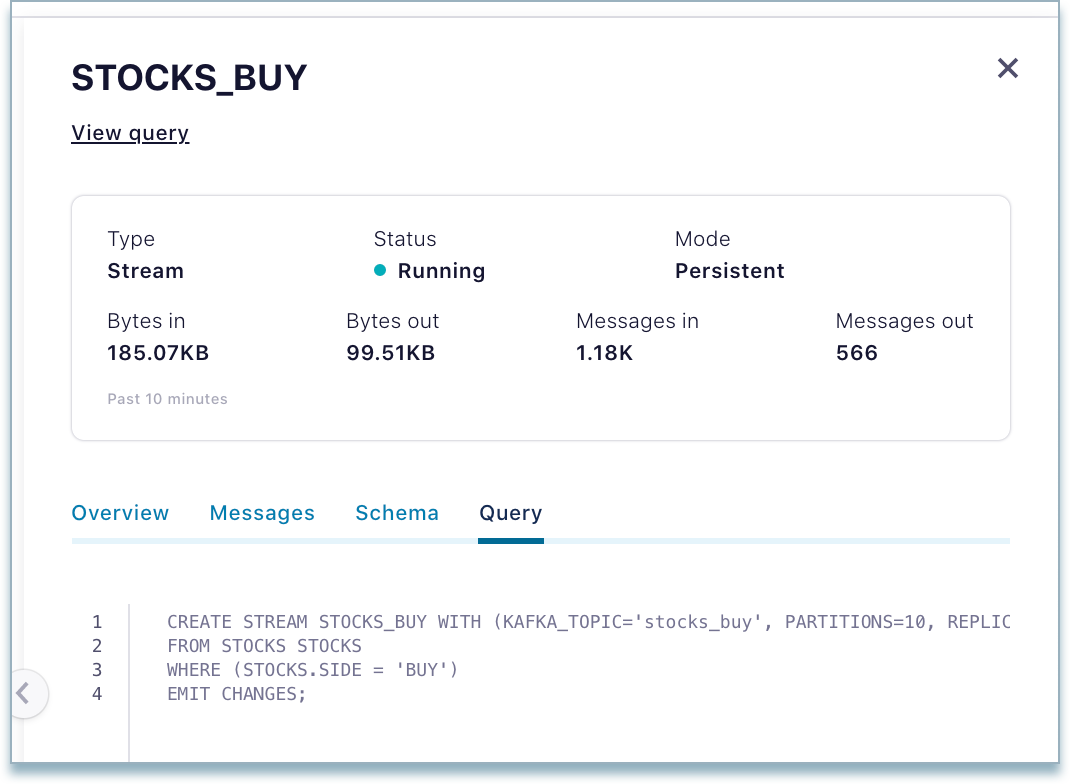
Query tab - Shows a view-only copy of the persistent query that is sending results to the topic. (For details on stream processing, see ksqlDB Stream Processing.)
View and navigate options
From anywhere on the Stream Lineage view:
Click the tab on the left side of the lineage view at any time to show/hide a navigation panel.
From a drilldown on a ksqlDB query, within the lineage tabs:
Click View query at the top of the tabs view to jump directly to the ksqlDB stream associated with the persistent ksqlDB query.
Click the tab handle to the left of the tab view to expand the tab to full. Click again to collapse.
In addition to the above, the lineage view provides options to link directly into topics, schemas, queries, and connectors at various points on the Cloud Console.
Try this
Click the stocks topic node, and scroll through the message throughput timelines on the Overview tab, then click View topic to go directly to the topic.
Click the stocks_buy topic node, then click the Schema tab to view its associated schema.
Click a query, such as stocks_buy query, and click the Schema tab. This shows you a menu style view of the same schema because the schema associated with the stocks_buy topic is coming from the stocks_buy query.
To verify this, click View query to link to the ksqlDB_stocks query, then click the Flow tab under that app, and click stocks_buy on that diagram. (Note that you also can visualize a data flow particular to that query from directly within the ksqlDB app, but not the combined flows of all queries to all topics, as is shown on Stream Lineage.)
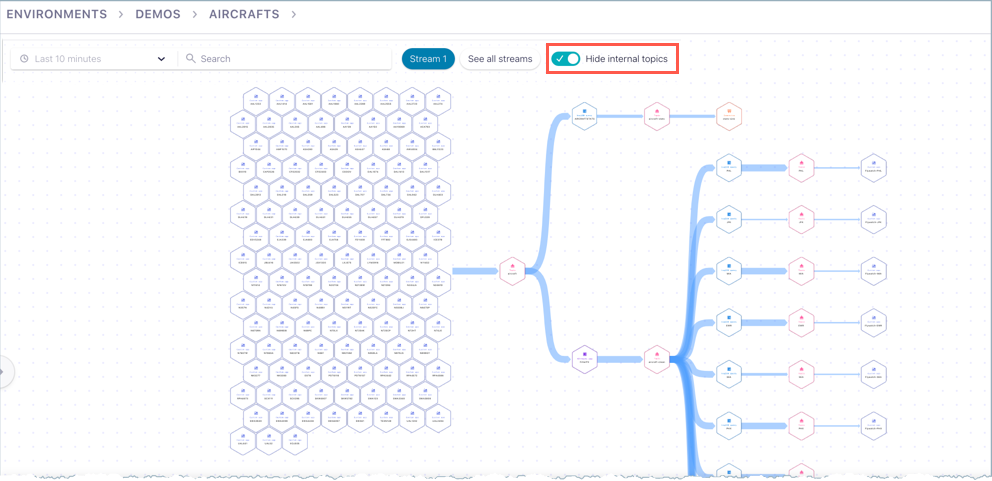
Hide or show internal topics
From any Stream Lineage graph view, you have the option to hide or show internal (system) topics. System topics are those that manage and track Confluent Cloud metadata, such as replication factors, partition counts, and so forth. Typically, this system metadata is of less interest than data related your own topics, and you’ll want to hide it.
Browsing the diagram view
Set the diagram to a point in time (point in time lineage)
What is it?
Point-in-time lineage allows to visualize the flow of data at a point in time in the past. The Essentials package only allow users to visualize the flow of data from the past 10 minutes, but with point-in-time feature, only available on Advanced package, a user can choose to see last 10 minutes, 30 minutes, 1 hour, 4 hours, 8 hours, 12 hours, 24 hours and 1 hour window on any of the last 7 days.
Why is it important?
Sometimes the flow of data is not always continuous, might be that you ingest data at a regular non real-time cadence, or some issue might interrupt the flow of the data. In those cases looking at the last 10 minutes might not show anything in Stream Lineage. Another important use case might be to troubleshoot a potential data breach where you want to navigate to a point in time to understand who were all the data consumers at that point.
This blog post explains the use of point-in-time lineage and the main use cases for Stream Lineage: How to Visualize Your Apache Kafka Data the Easy Way with Stream Lineage
How to use it
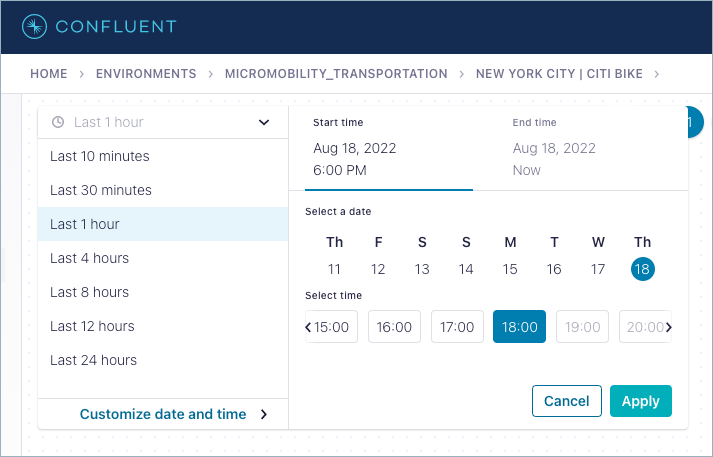
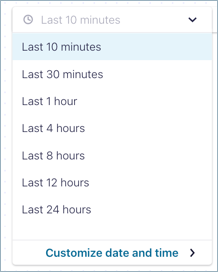
By default, graphs represent the last 10 minutes of data flowing through the system. You can navigate and search the graphs in this default time window, or set a specific time window. These settings apply to all data on the cluster, whether that data is currently on-screen or not. (The example shows the time window re-set to “Last 24 hours”.)
Pre-set windows are available for:
Last 10 minutes
Last 30 minutes
Last 1 hour
Last 4 hours
Last 8 hours
Last 12 hours
Last 24 hours (maximum size of a pre-set time window)
You can also set a custom date and time window for your search, going back 7 days for a selected 1 hour block.
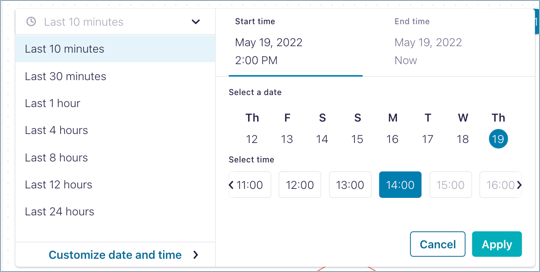
The graphs, nodes, and available data will change depending on the selected time window. For example, a custom setting to show data only from last Friday from 6:00-7:00 AM will not show streams created later in the week. Similarly, the graph search is dependent on the time window setting, and will not find data that isn’t available in the current time window.
Search the graph (Stream Lineage search)
What is it?
Lineage search enables searches within the lineage graph for particular entities by partial or full names. The search finds topic names, connector names, ksqlDB query names, consumer groups, and producer client IDs and spans globally across the cluster, not just the on-screen nodes in the current diagram.
Why is it important?
Many time customers have very complex streaming topologies with dozens if not hundreds of applications, services, topics, queries, and so on. With this feature they can easily isolate on the graph what they are interested in knowing more about.
How to use it
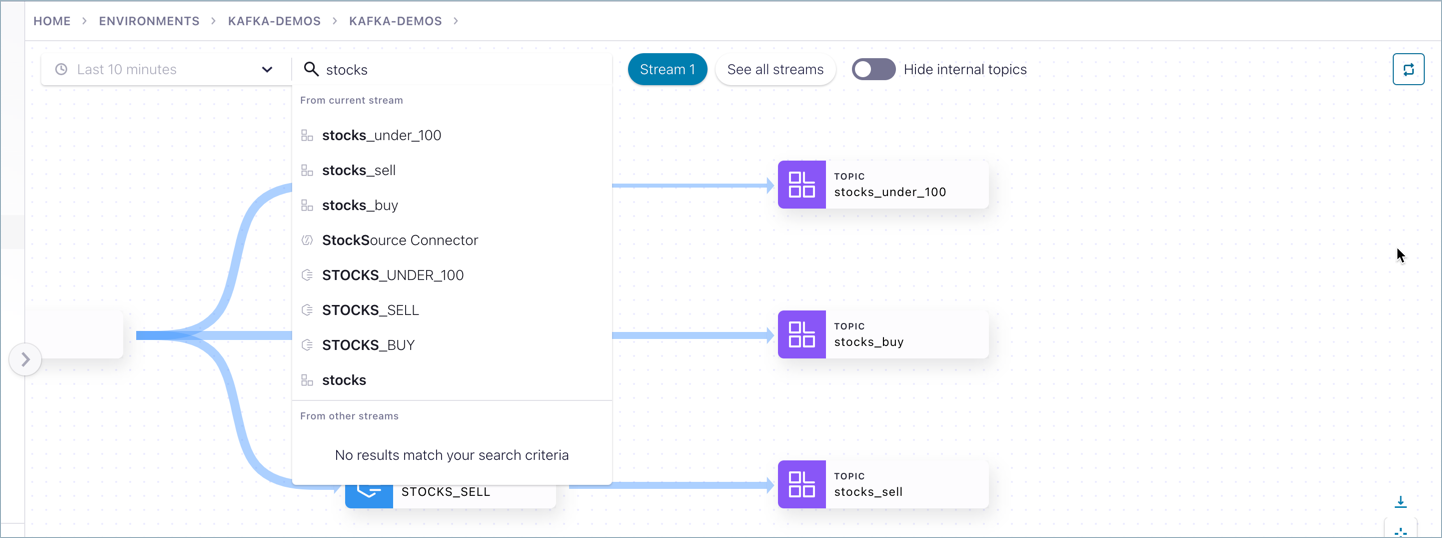
You can search the graph for partial or full names of entities. The search finds topic names, connector names, ksqlDB query names, consumer groups, and producer client IDs. The search spans globally across the cluster, not just on-screen nodes in the current diagram.
Keep in mind that the search applies to data available across the cluster for the selected time window.
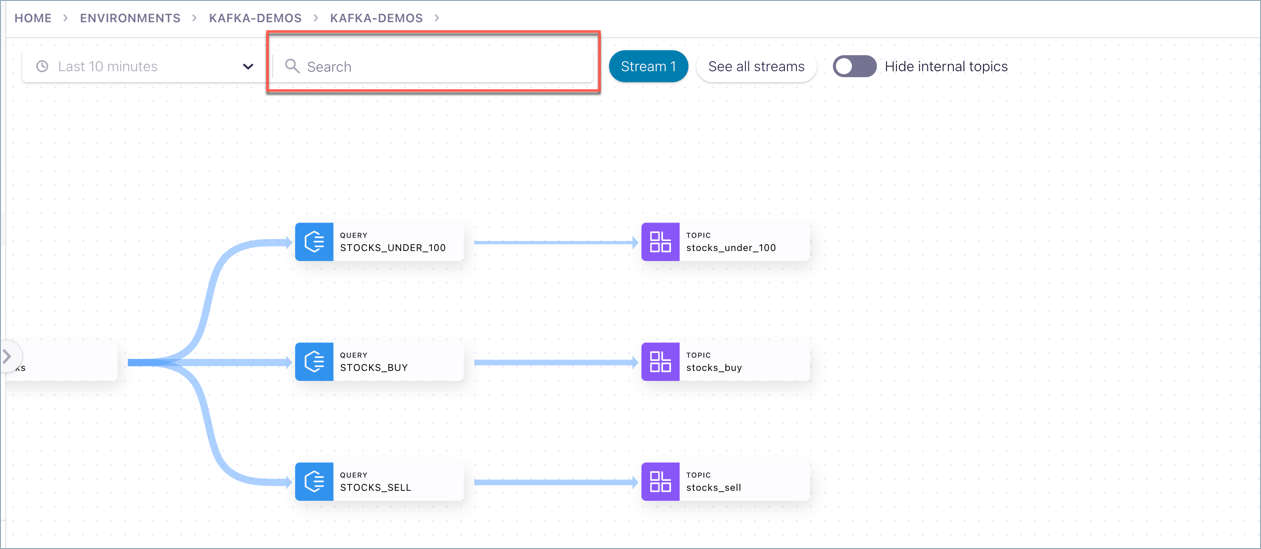
To execute a graph search, click into the Search bar and type a name (such as buy in this example).
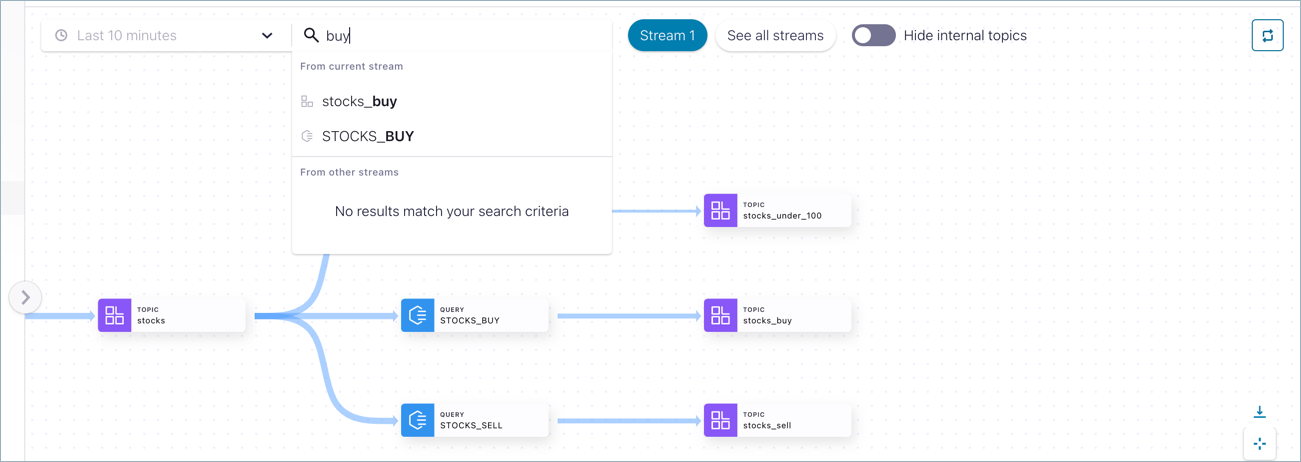
Next, select a search result by clicking it (for example STOCKS_BUY).
The drilldown for that entity is displayed.
Export a lineage diagram
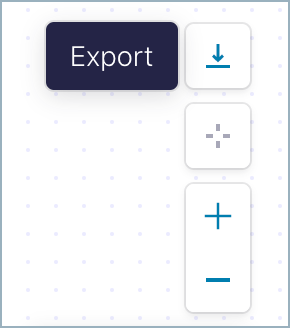
To export the current diagram, click the Export icon ![]() on the lower right tool panel.
on the lower right tool panel.
Reset the view
To reset the view to center on the entity that is the original focus of the diagram, click the Reset icon ![]() on the lower right tool panel.
on the lower right tool panel.
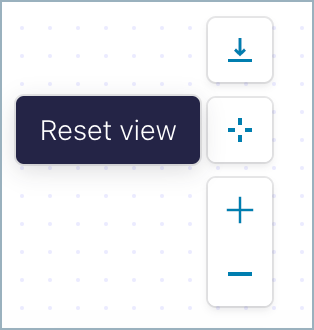
Reset view is only applicable when you launch the lineage diagram from within an entity, such as a topic, ksqlDB table or stream, producer, consumer, and so forth. It is not applicable if you launch the lineage diagram from the left menu or dashboard because that is a global view, not centered on any specific node to begin with.
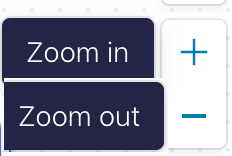
Zoom in or out
Use the + and - buttons on the lower right tool panel to zoom in or zoom out on the lineage diagram.
Traverse the Diagram
To explore the diagram, click, hold, and drag the cursor, or use analogous actions such as three-finger drag on a Mac trackpad.
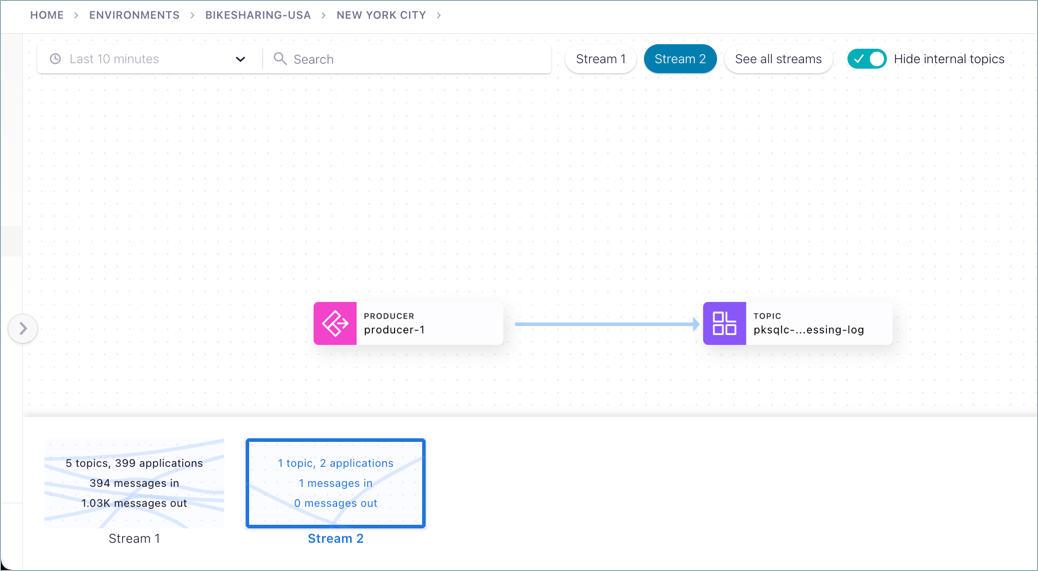
All streams
Click See all Streams on the upper part of a diagram to view cards representing the data flows.
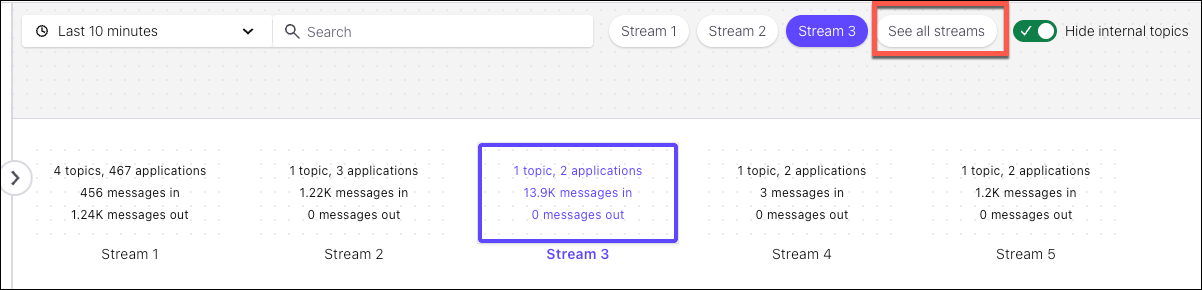
The default view shows Stream 1.
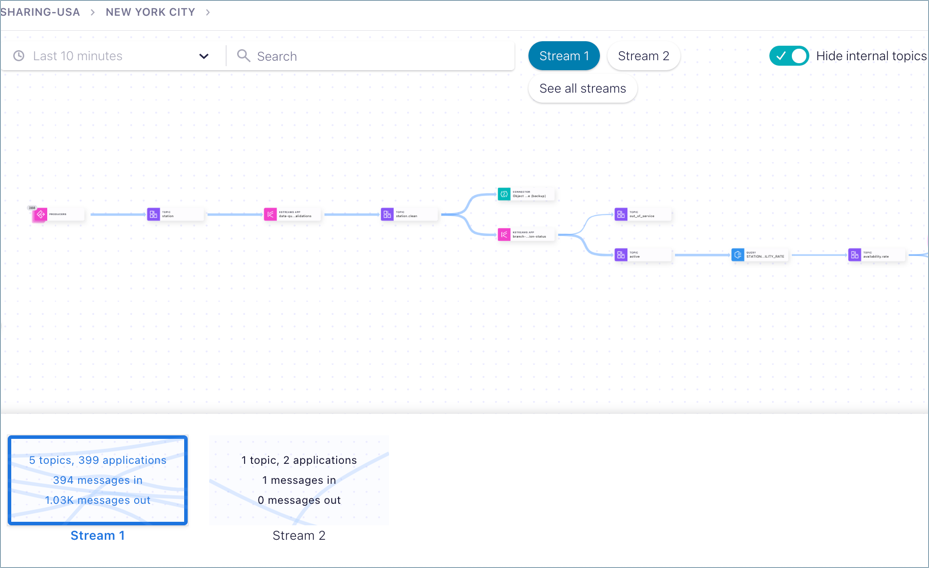
Click another card to focus in on a particular stream, for example Stream 2. The diagram updates to show only the selected stream.
Understanding data nodes
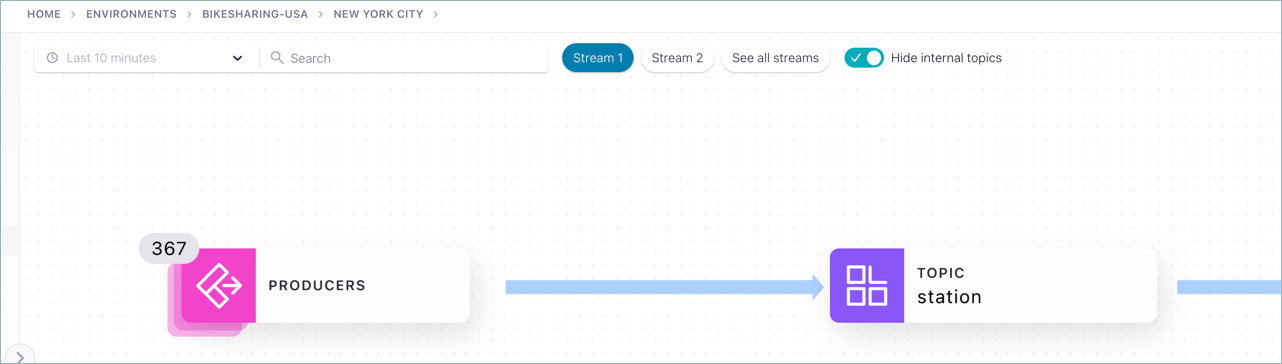
Consumers and producers are automatically grouped; that is, a group of consumers or producers is represented as a single node that expands upon drilldown to show the client IDs.
Node | Description |
|---|---|
| A topic node shows:
|
| A custom application node provides:
|
| A ksqlDB query node shows:
|
| A Kafka streams app includes:
|
| A Kafka Connector node shows:
|
| A CLI node shows monitoring data on producers and consumers running on the the Confluent CLI, producing to or reading from a topic on your Confluent Cloud cluster:
|


Understanding node groups
In cases where you have a threshold number of nodes of the same type in a workflow (24 or more like nodes), Stream Lineage collapses these into a single node group to save screen real estate and improve navigation. This grouping is purely for visual display of like nodes that are processing data to or from the same connection point.
To drill down on the individual nodes represented by a node group:
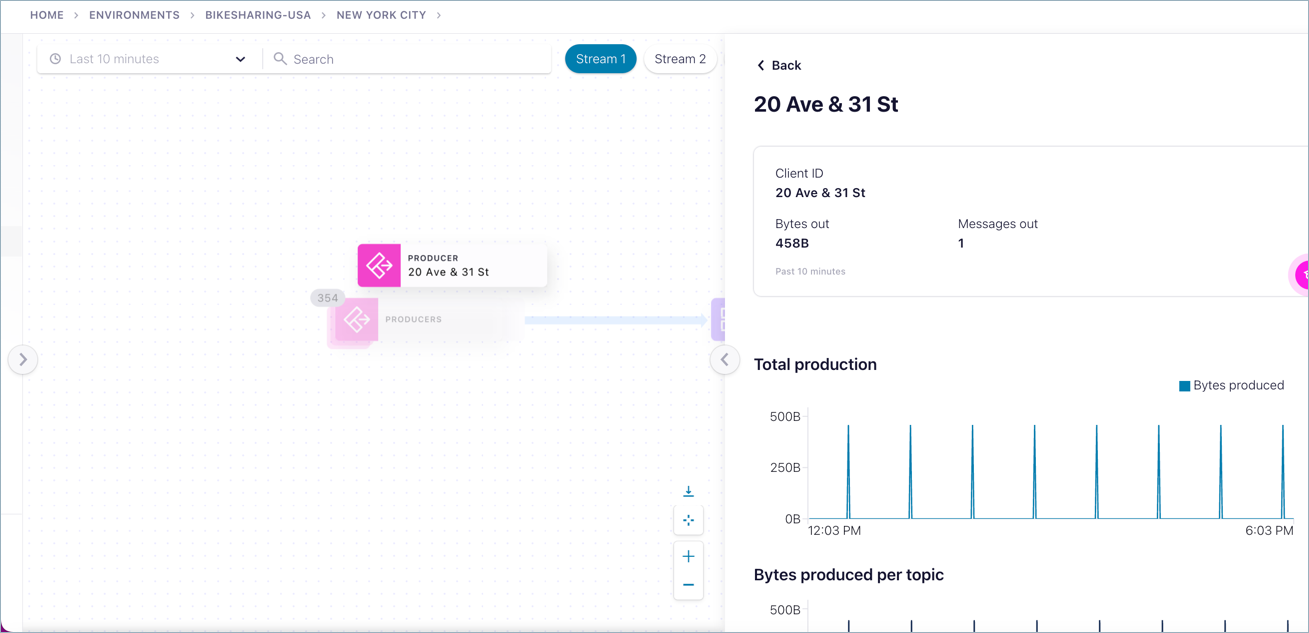
Click the composite node (node group) to display the individual nodes on the right.
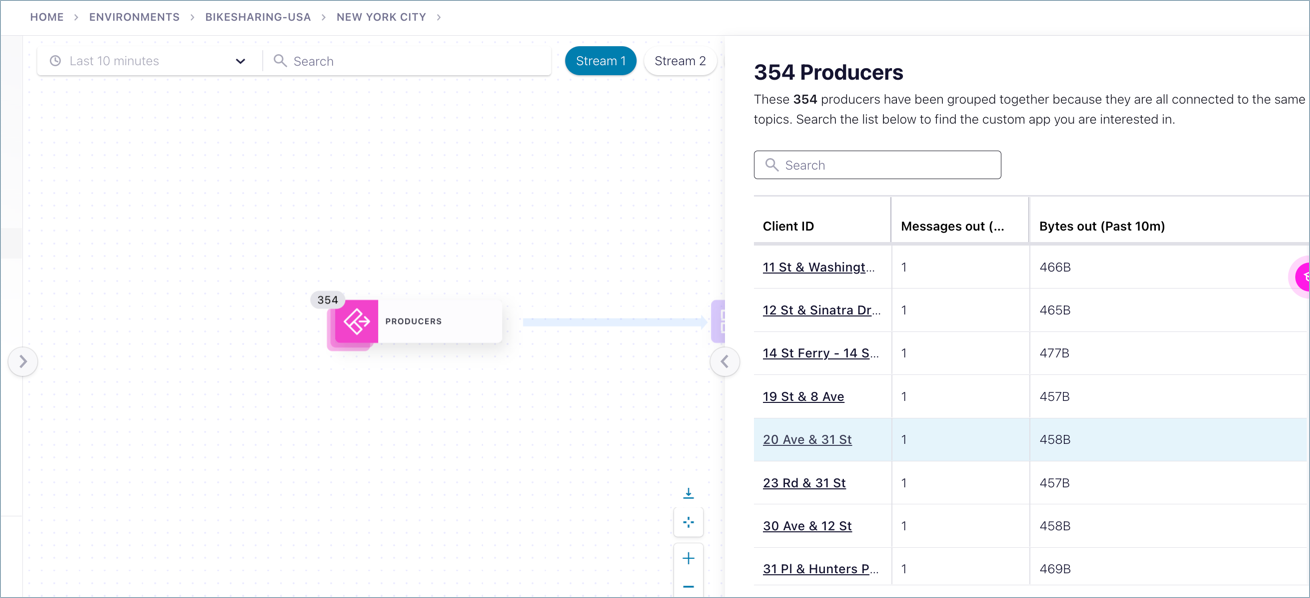
Select a node from the list on the right to inspect details of that node.
Automatic visual grouping of like nodes applies to any node type, but producers and consumers are the most common as there is a tendency to employ large numbers of these.
Understanding edges
Edge thumbnails and drilldowns describe the flow between the given nodes. They show:
The node where the data came from
The node where the data is going to
Bytes transferred
Number of messages transferred
The relative thickness of an edge indicates the amount of data that is moving through the connected nodes during the selected time range, also known as throughput. Thicker edges have a higher throughput than thinner edges. To get specific throughput numbers, use the drilldowns.
Hovering on an edge gives you the thumbnail.
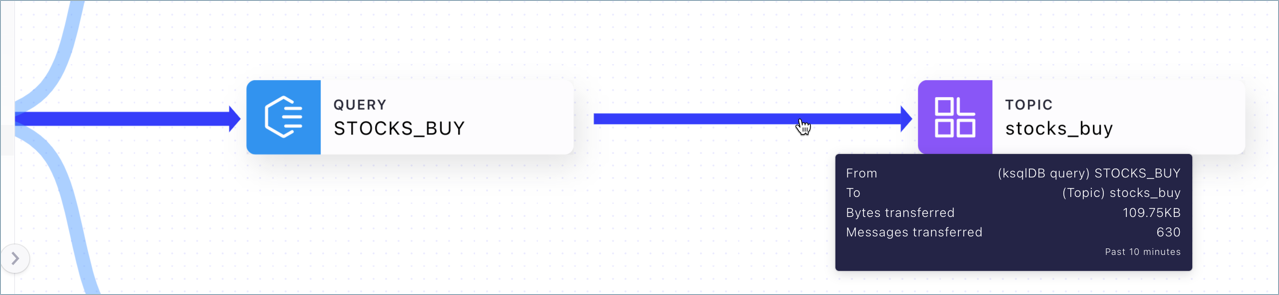
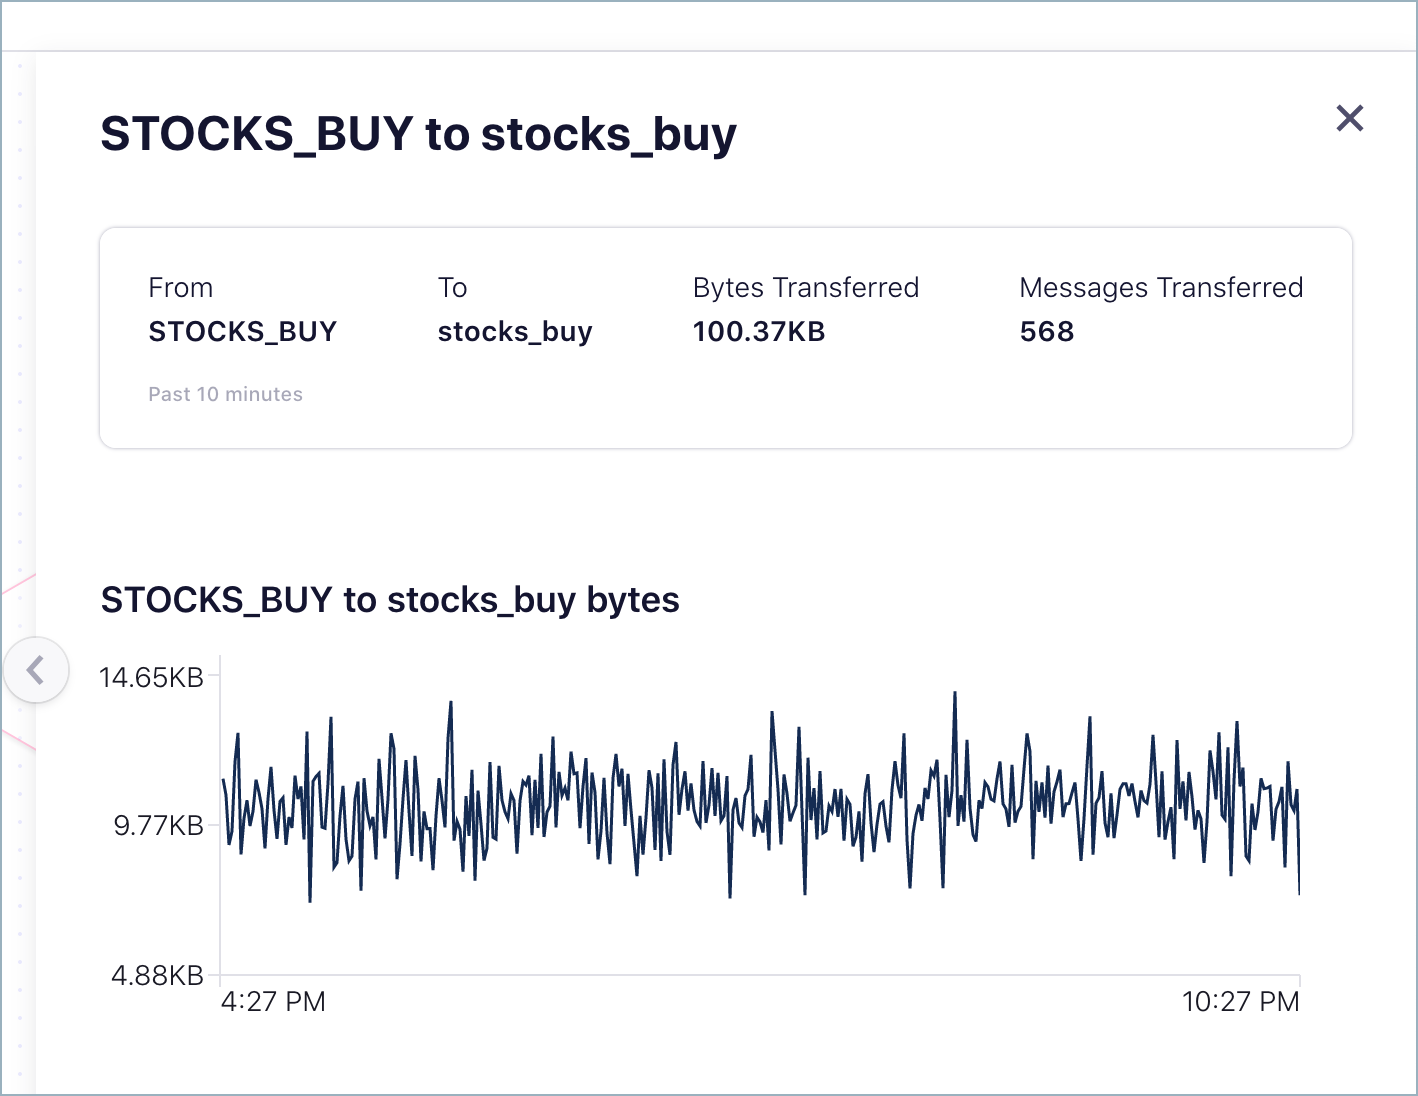
Drilldown on an edge provides the tab view.
Access control (RBAC) for Stream Lineage
If role-based access control (RBAC) is configured on your clusters, you must make sure you have access to the appropriate resources, such as clusters, topics, and features such as Stream Lineage views. This section provides a summary of roles related to Stream Lineage access.
For details on how to manage RBAC for these resources, see List the role bindings for a principal, Predefined RBAC Roles in Confluent Cloud, and List the role bindings for a principal.
The following roles have full access to Stream Lineage views:
Role
View Scope
Admin Scope
All
All
Organization, Support Plan, Users
All clusters in the environment, Schema Registry, Networking
Organization, Environment, Support Plan, Users, Schema Registry
Specified Cluster, Topics, ksqlDB applications, Connectors, Schema Subjects
Organization, Environment, Cluster
N/A
Organization, Environment
N/A
Environment
N/A
Note
Developer roles do not grant access to Stream Lineage. You can give developers access to Stream Lineage by granting them additional roles from the above table with appropriate scope for need-to-know; such as the Operator role at the cluster level. To learn more, see Access control (RBAC) for Stream Lineage and Role-based Access Control (RBAC) on Confluent Cloud.
The DataSteward and DataDiscovery roles have access to view the lineage but cannot access the actual message contents.
DataSteward and DataDiscovery do not have access to view details of a ksqlDB node.
To learn more, see Role-based Access Control (RBAC) on Confluent Cloud.
Pause or teardown
When you are ready to quit the demo, don’t forget to either pause or tear down resources so as not to incur unnecessary charges. The extent to which you want to maintain your setup will depend on your use case. Here are some options.
Pause data generation temporarily
If you want to keep your setup but minimize data traffic and cost when the system isn’t in use, do the following.
Stop the consumer.
On the Confluent CLI where the consumer is running, press Ctrl+C to stop consuming data.
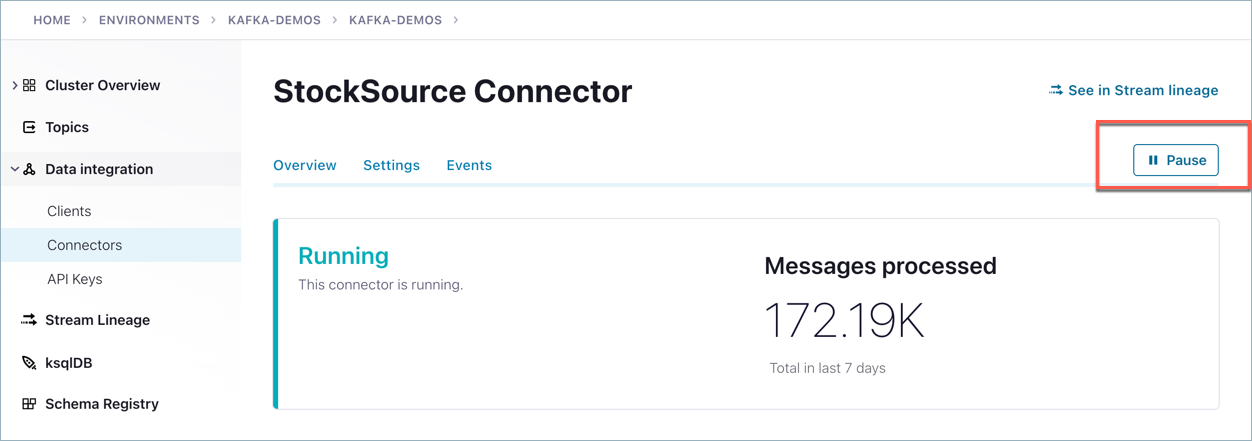
Pause the <kconnect> Datagen “StockSource” producers.
On the Cloud Console, navigate to the Datagen StockSource connector, click it to drill down, and pause the connector.
This will suspend data generation so that no messages are flowing through your cluster.
Tip
How to restart the demo
In this scenario, you can always resume using the stocks app at any time by clicking Resume on the StockSource connector, and restarting the consumer from the Confluent CLI.
Stop the queries and remove the cluster
To entirely tear down this instance, follow the “temporary pause” steps above, but also perform the following tasks on the Confluent Cloud Console:
Navigate to ksqlDB, click ksqlDB_stocks, click the Persistent queries tab, and click Terminate on each query.
After you pause the <kconnect> Datagen “StockSource”, delete the connector.
At the Environment level, delete the cluster.
Appendix A: Creating a ksqlDB app with granular access and assigning ACLs
As an alternative to creating the ksqlDB app with global access, you can create the app with granular access, assign a service account to it, and then create ACLs limited specifically to your ksqlDB app. There may be cases where you want to limit access to the ksqlDB cluster to specific topics or actions.
Navigate to ksqlDB
Click Create application myself.
Select Granular access and click Continue.
Under Create a service account:
Select Create a new one (unless you already have an account you want to use).
Provide a new service account name and description, such as
stocks_traderksqlDB_stocks.Check the box to add required ACLs when the ksqlDB app is created.
Provide access to the
stockstopic (this should already be selected), and click Continue.Create the ACLs for your ksqlDB app as follows (skip this step if you have done this previously for this app).
Log on to the Confluent Cloud by means of the Confluent CLI. (Provide username and password at prompts.)
confluent login --url https://confluent.cloud
List the environments to get the environment ID.
confluent environment list
Select the environment you’ve been using for this demo.
confluent environment use <ENVIRONMENT_ID>
List the clusters to get the right cluster ID.
confluent kafka cluster list
Select the cluster you’ve been using for this demo.
confluent kafka cluster use <KAFKA_CLUSTER_ID>
List the ksqlDB apps to get the ID for your app.
confluent ksql cluster list
Run this command to get the service account ID.
confluent ksql cluster configure-acls <KSQL_APP_ID> * --cluster <KAFKA_CLUSTER_ID> --dry-run
Copy the service account ID (after
User:<SERVICE_ACCOUNT_ID>in the output).Allow READ access to all topics on the ksql cluster for your service account ID.
confluent kafka acl create --allow --service-account <SERVICE_ACCOUNT_ID> --operations read --topic '*'
Allow WRITE access to all topics on the ksql cluster for your service account ID.
confluent kafka acl create --allow --service-account <SERVICE_ACCOUNT_ID> --operations write --topic "*"
Allow CREATE access for all topics on the ksql cluster for your service account ID.
confluent kafka acl create --allow --service-account <SERVICE_ACCOUNT_ID> --operations create --topic '*'