
Monitor Alerts for Confluent Platform Resources with USM
Unified Stream Manager (USM) provides alerting for your registered Confluent Platform clusters, so you can detect and respond to critical health and performance issues without running a separate monitoring stack. USM evaluates alert conditions against the telemetry that the USM Agent collects from your Confluent Platform environment. USM delivers alerts using Confluent Cloud notifications. You can route them to your Confluent Cloud Console dashboard, email, Slack, Microsoft Teams, or a generic webhook.
Alert thresholds are pre-configured and not user-configurable.
Before you begin
Register your Confluent Platform cluster with Confluent Cloud.
Confirm that you have the OrganizationAdmin or EnvironmentAdmin role. USM alerts follow the same access rules as other Confluent Cloud notifications.
Alert types
USM monitors the following conditions for each registered Confluent Platform cluster. Each alert fires within 10 minutes of the trigger condition being met, with the severity shown in the table.
Alert |
Scope |
Trigger condition |
Severity |
Description |
Recommended action |
|---|---|---|---|---|---|
Metrics delayed |
Cluster |
The cluster hasn’t reported telemetry to USM for at least 10 minutes. |
Warn |
If USM can’t reach the cluster, no other alert for that cluster can fire, so you lose all visibility into its health. |
Check connectivity between the USM Agent and Confluent Cloud, and verify that the cluster and its host or network are running and reachable. |
Cluster in critical state |
Cluster |
Active controller count is not equal to 1. |
Critical |
Composite alert that covers controller and quorum health. The
notification specifies the exact condition that triggered it,
for example |
Check broker health and controller connectivity, and verify that exactly one broker reports as the active controller for the cluster. |
Partitions Offline |
Cluster |
|
Critical |
At least one partition has no available leader, so reads and writes to that partition are unavailable. This condition is always urgent, because it represents a data availability or data loss risk. |
Identify the affected topic and partitions, and check the health and replication status of the brokers that host them. |
Broker Storage Over 80% |
Broker |
Disk usage exceeds 80% on any broker. |
Critical |
Storage exhaustion causes broker failure. When a broker’s disk fills up, it can’t write logs or create new segments. |
To resolve this alert:
|
Network Pool Over 80% |
Cluster |
Network processor pool usage exceeds 80%. |
Critical |
Network thread saturation degrades all client connections on the cluster. At this threshold, clients experience increased latency and connection failures. |
Review client connection counts and the broker’s network thread configuration, or scale the cluster to add capacity. |
Request Pool Over 80% |
Cluster |
Request handler pool usage exceeds 80%. |
Critical |
Request handler saturation causes produce, fetch, and admin requests to queue. At this threshold, request latency spikes and requests time out. |
Review request throughput patterns and the broker’s request handler thread configuration, or scale the cluster to add capacity. |
Connector Stopped Running |
Connector |
Any connector enters the |
Critical |
A connector in the |
Check the connector and task status and logs in your Confluent Platform environment to diagnose the failure. Then restart the connector or its tasks. |
Enable alerts
USM alert types are disabled by default. To enable an alert:
In the Confluent Cloud Console, click the notifications bell icon, and then click the gear icon to open Manage notifications for this organization.
Click Category and select Unified Stream Manager to show only USM alerts.
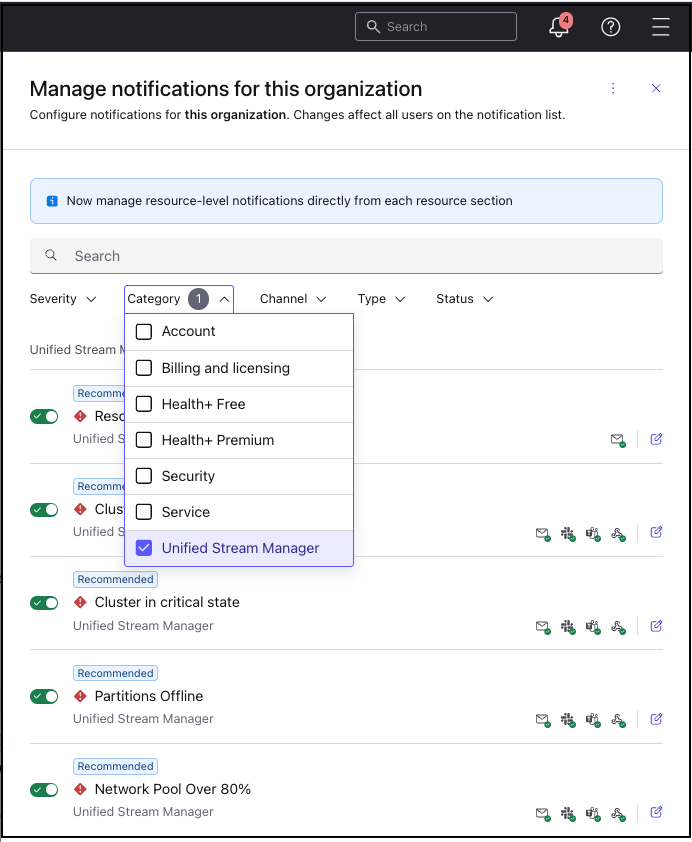
If the alert list is collapsed, click Show more to expand it.
Click the toggle next to the alert you want to enable.
For the full steps to open this panel, see Notifications for Confluent Cloud.
Alert notifications
USM alerts are delivered as Confluent Cloud notifications. This section describes the available channels, what a notification contains, and how to view your notification history.
Notification channels
USM alerts support the following notification channels:
Confluent Cloud: Shows the alert in your Cloud Console notification dashboard.
Email
Slack
Microsoft Teams
Generic webhook: Use a webhook to integrate with tools such as Datadog, Opsgenie, ServiceNow, and other custom incident-management systems.
You can add specific recipients for each alert type, such as email addresses or configured Slack, Microsoft Teams, or webhook integrations. For steps to configure these integrations, see Configure integrations and subscriptions.
What a notification contains
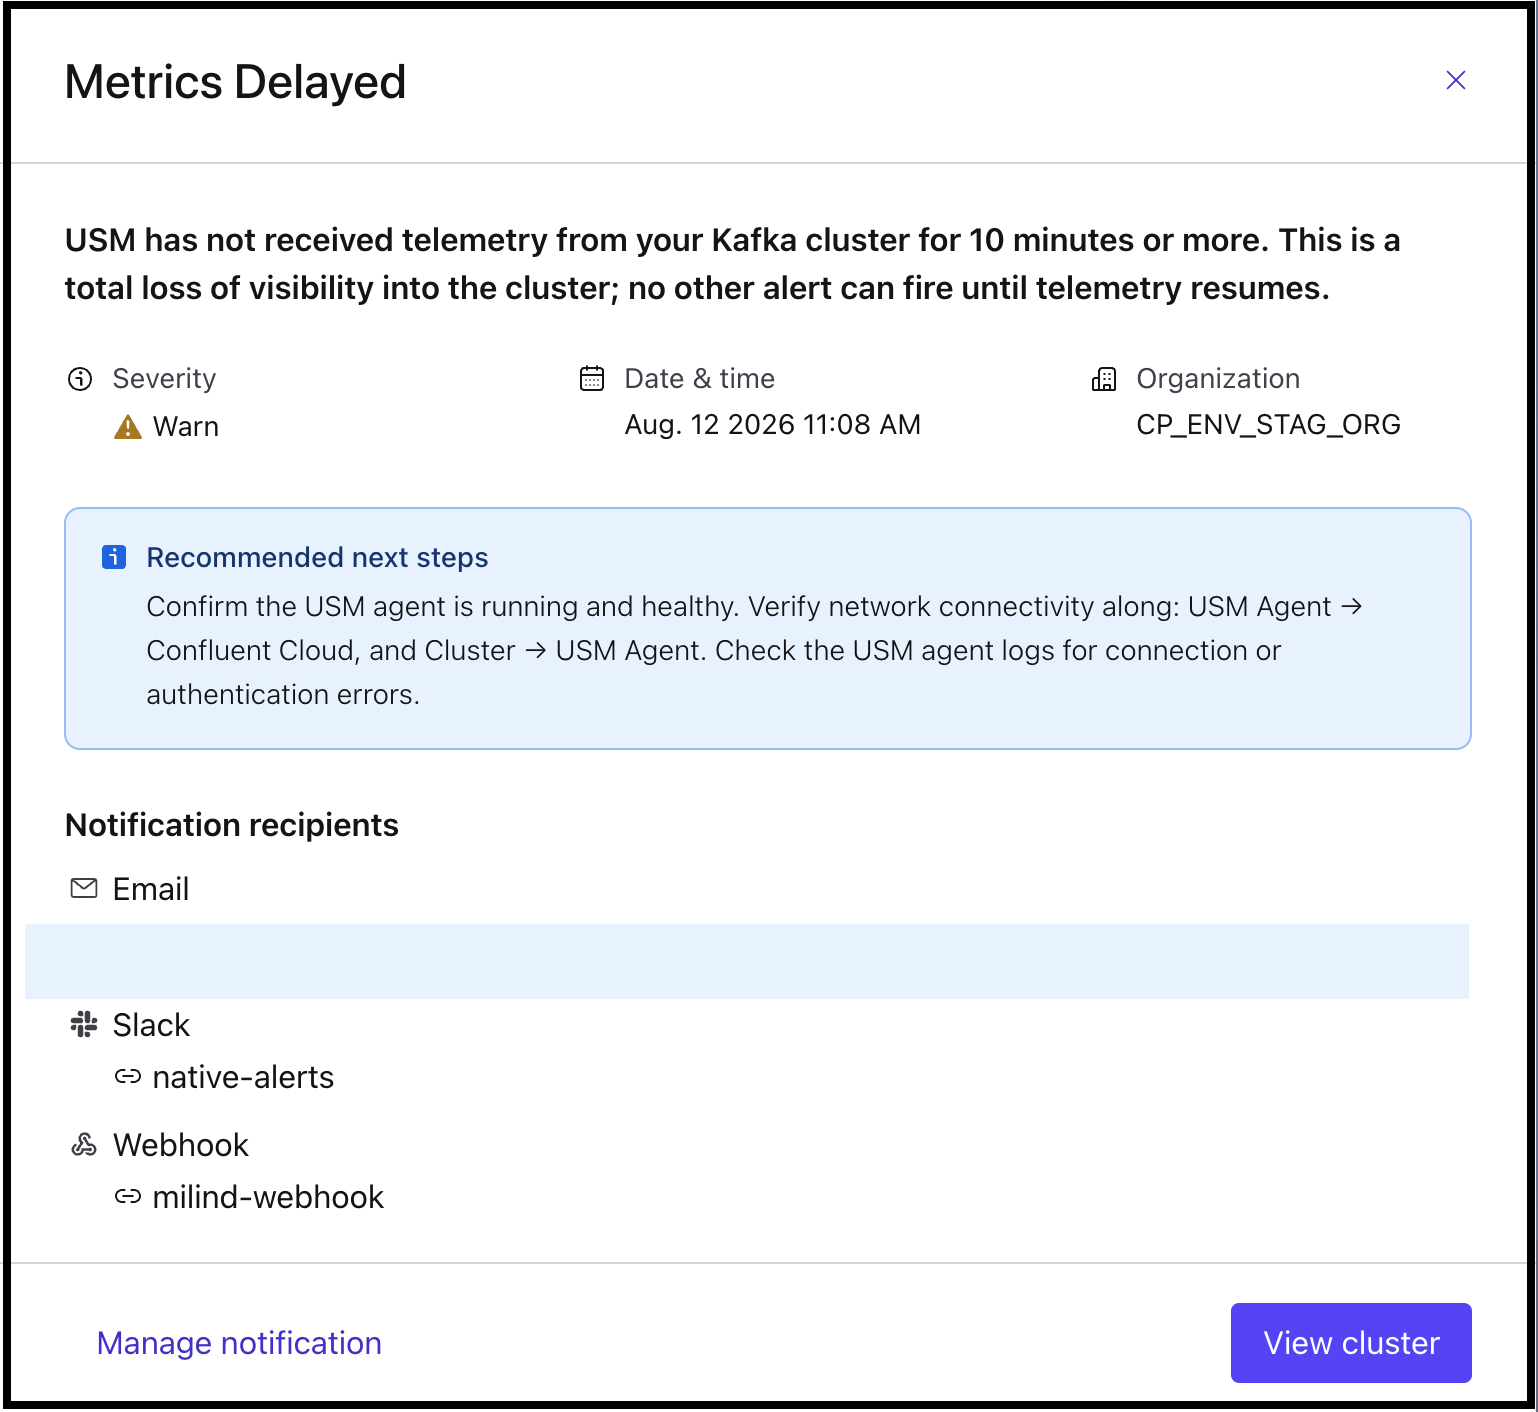
Each alert notification appears as a summary in your notification list. Click View details to see the full notification, which includes the following information:
The alert name
A description of the condition that triggered the alert
The severity
The date and time the alert fired
Your organization name
Recommended next steps to resolve the issue
A link to manage the notification, and a link to the affected cluster, broker, topic, or connector view in USM
Alert history
To view a history of your USM alert notifications, click the notifications bell icon in the Confluent Cloud Console.
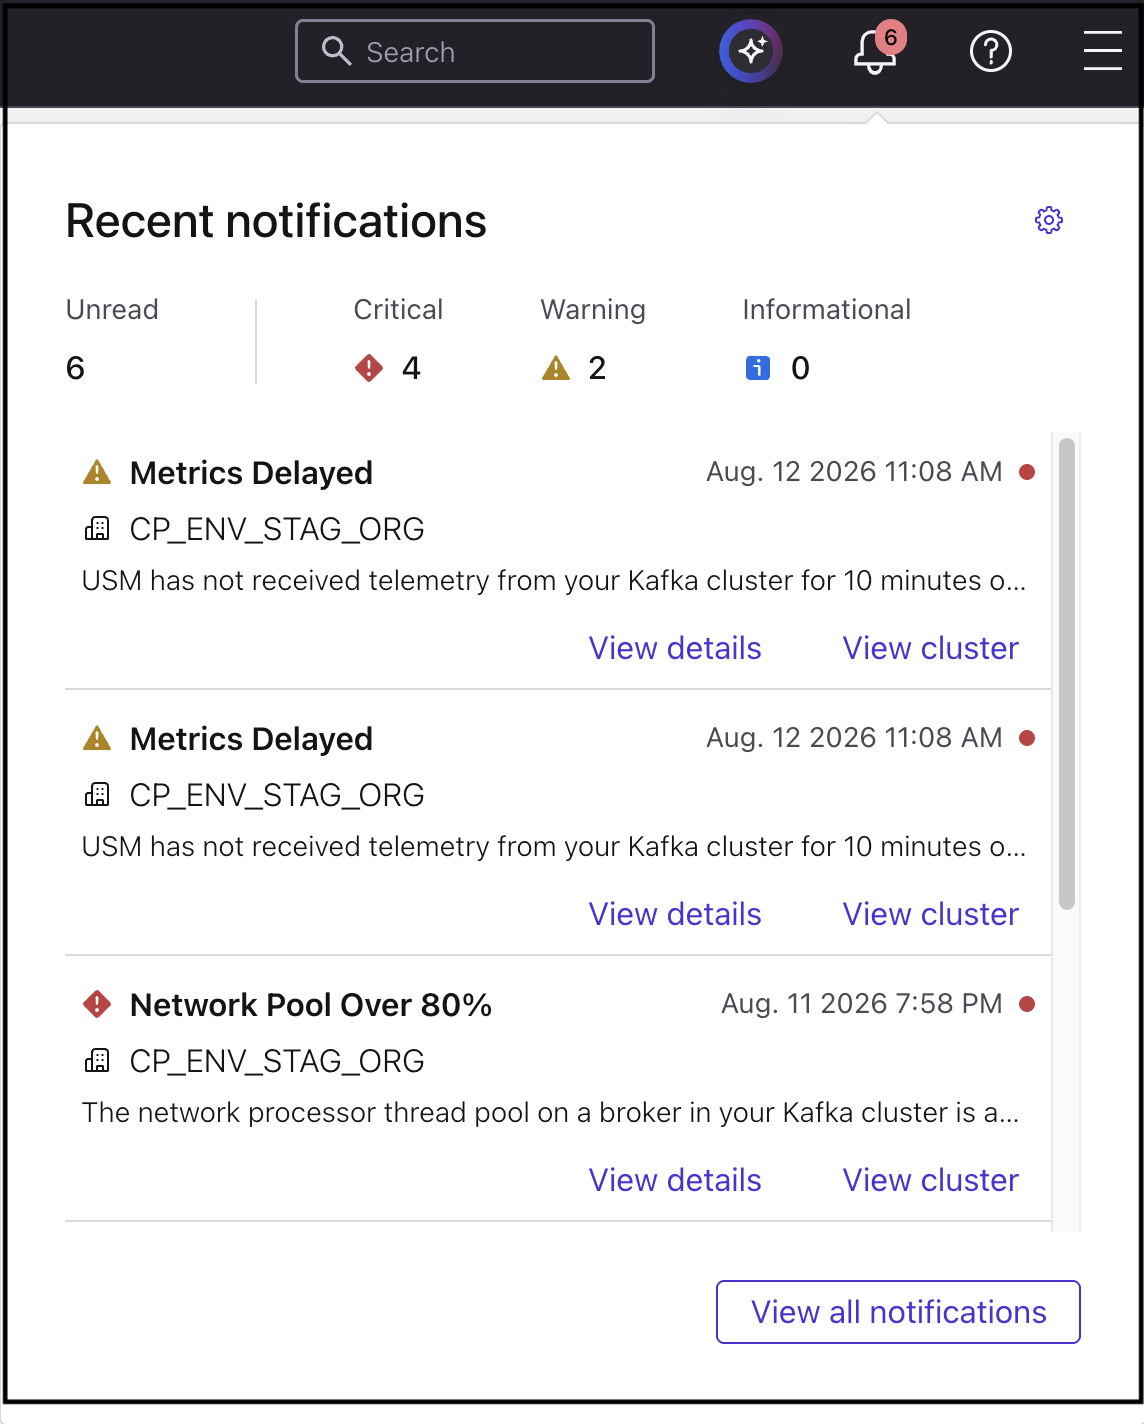
Then click View all notifications to open the Notifications page.
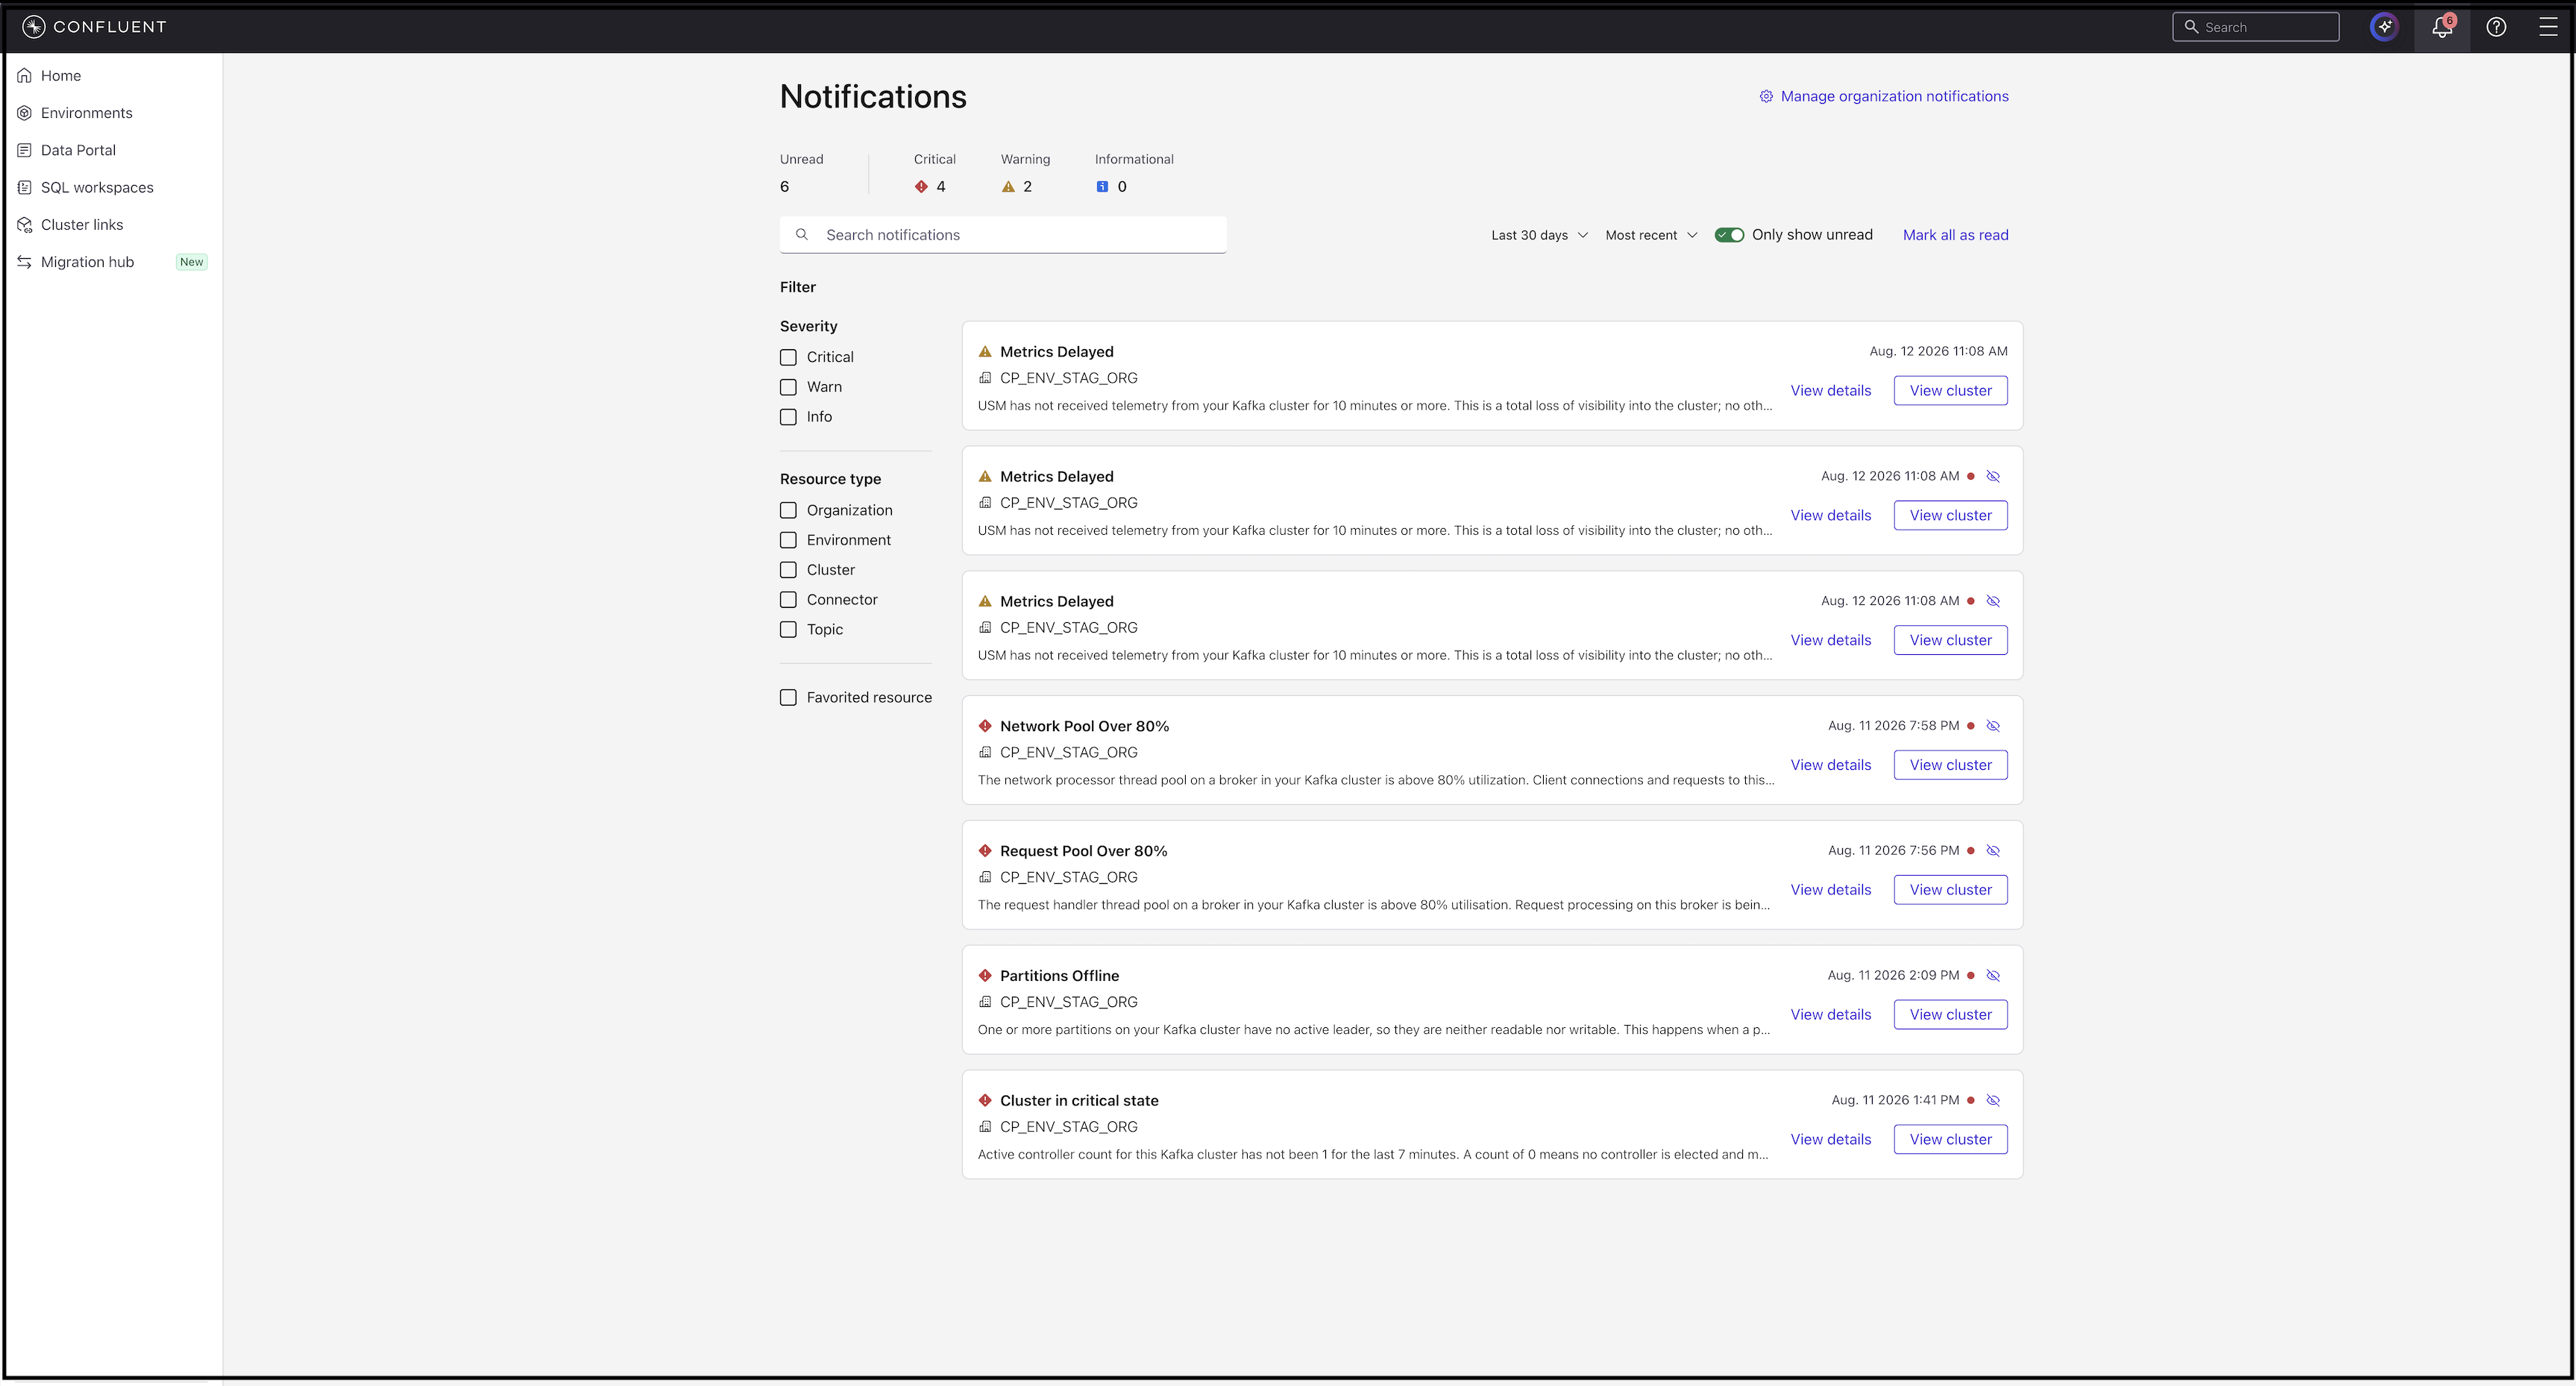
You can filter the page by:
Severity
Resource type: organization, environment, cluster, connector, or topic
Time range
Favorited resources
You can also mark individual notifications as read.
Limitations
Alerting in USM has the following limitations:
Alert thresholds are pre-configured and not user-configurable. There is no duration-based filtering to reduce noise from transient conditions.
PagerDuty isn’t available as a native notification channel. Use the generic webhook to integrate with PagerDuty.